The Agent Awareness subsystem (AGAW)
QueueMetrics was designed primarily to be used by supervisors and administrators to keep track of what is going on in the Call Centre. In most Call-Centres, keeping track of the current activity level using a real-time wallboard and/or the agent’s page is enough. In some high-performance setups, with large and geographically distributed agent groups, it is mandatory to have a better level of performance awareness by the agents, and to have "off band", live communication lines going from the supervisor to the agent and from the agent to the supervisor.
QueueMetrics addresses this issue using a module called Agent Awareness (AGAW), that is basically a Firefox or Chrome plug-in that each agent can use to see:
-
A wealth of information about how the agent and/or the queue is performing; this information offers a large set of performance metrics so that the feedback on the agent’s behaviour is immediate
-
A way for the agent to get in touch with her supervisors using an "off-band" channel (chat) so that they can keep on working with no downtime when speaking to their supervisors or with second-line product experts
-
A way for the supervisor to send targeted broadcast messages to his own agents, making it feasible to monitor geographically-dispersed agents
The choice of developing Firefox/Chrome plug-ins was because this way the agent can keep on working on a browser-based interface (CRM, data entry…) while keeping an eye on their own statistics in a non-obtrusive manner.
The AGAW implementation is divided into three logically distinct elements:
-
The configuration and supervisor access part, done through QueueMetrics: Supervisors and managers can monitor the AGAW modules through the QueueMetrics program, when given the correct security keys to do so. They can also send and remove broadcast messages to agents through the main QueueMetrics interface.
-
The Queue Runner : This is a command-line Java program that, in turn, runs statistics for all defined queues and agents. Though it leverages on QueueMetrics to run the analysis, it does not run within a servlet container and doesn’t have any visible interface. The Queue Runner can reside on a separate server from the main QueueMetrics instance.
-
The AGAW facades: The facades are the access points for each agent to log on and see their own statistics. They run in a servlet container and are positioned under the QueueMetrics webapp. The facades are not strictly speaking a part of QueueMetrics, and are thought of to be deployed on a separate server to handle very high load.
Each component can work separately on a separate server; the whole system is tied together by the usage of the same MySQL database. As the part that might be handling the highest load is the AGAW facades, that are constantly polled by hundreds or thousands of concurrent agents, they can be deployed on a plurality of separate servers and can even connect to multiple replicas of the main DB in order to handle the highest loads.
The AGAW architecture
The AGAW architecture is composed of the basic QM architecture and a number of new modules, as displayed.
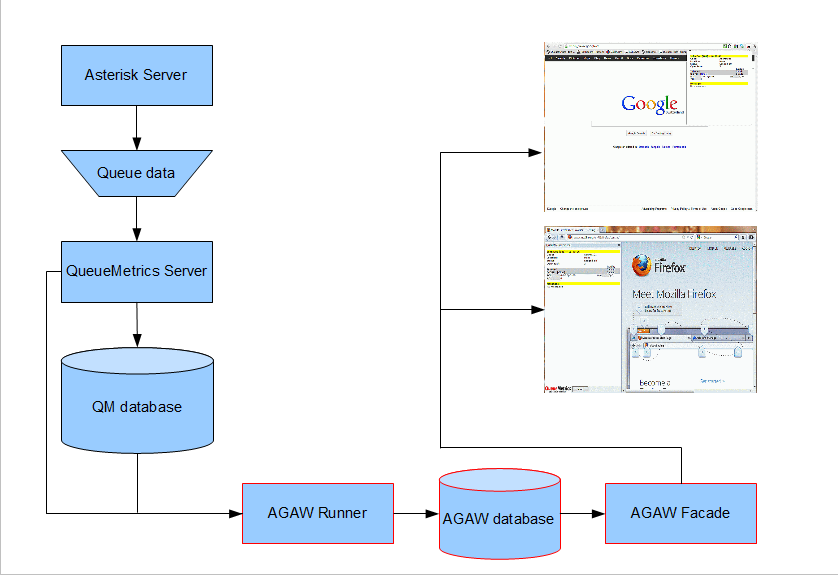
The new AGAW modules are drawn in red (AGAW Runner, AGAW database, AGAW Facade) while traditional QueueMetrics components are drawn in blue.
This is the way it works:
-
QueueMetrics receives data from one or more Asterisk servers and processes it
-
The AGAW Runner, a specialized, command-line script, runs periodically (e.g. every 5 minutes) and gather statistics for all selected queues. This is a time-consuming task where "hard real-time" is not necessary. Queues are processed in a sequential order.
-
Data processed by the Runner is stored in a specialized database
-
A set of cron scripts "purges" the database periodically from stale data.
On the client side:
-
A Firefox/Chrome extension polls the system every few seconds to gather new data and new broadcast messages
-
The AGAW facade component is able to retrieve the latest pre-processed data in a few milliseconds, allowing to have hundreds or thousands of clients fed without overloading the QueueMetrics server
Though it is a separate entity from the main QueueMetrics, all AGAW components ship within the same installation as QM - so there is no need for a separate installation.
In order to activate the AGAW subsystem, see Installing the AGAW runner. Full configuration information can be found in Configuring queues to be processed by the AGAW Runner. You will also need an AGAW licence key (or you can use the supplied, two-agent free key).
Security keys used by the AGAW subsystem
The following security keys control the accessibility of the AGAW sub system.
| Key | Subsystem | Meaning |
|---|---|---|
AGAW |
Facades |
This agent can access data through a facade (already set by default in class AGENTS) |
AGAW_ADM |
QM |
Lets you access the AGAW administrator pages: seeing the logs, the runs in progress, etc. |
AGAW_REP |
QM |
Lets you access per-supervision and per-location supervisor statistics |
BRO_MSG |
QM |
Enables the Broadcast Messages page (from the Real-time page) |
MON_IM |
QM |
This supervisor can start an IM chat to the given client (if the agent has an IM address defined on record) |
Installing the AGAW Licence
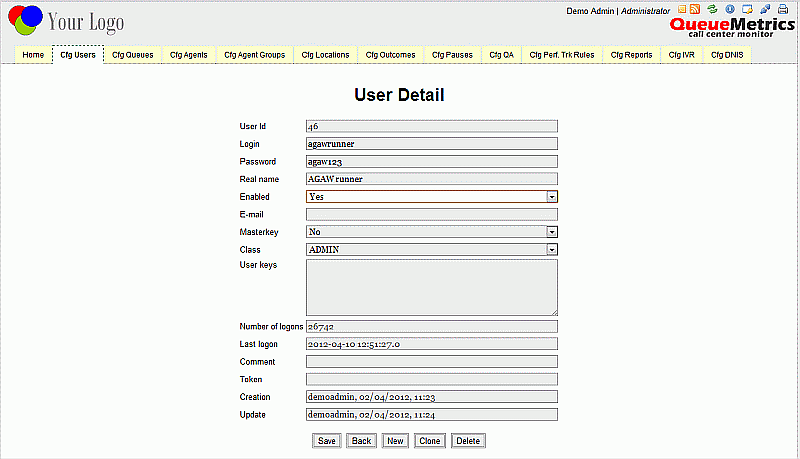
The installation of the AGAW licence requires a first step prior to installing the licence key, whereas we need to enable the AGAW profile that ships with QueueMetrics (which is usually disabled) by configuring the AGAW user. Choose "Edit Users" from the Home page and select the "Cfg Users" tab. Make sure that "Enabled" field is set to "Yes". Once you have filled out the required fields, as shown in the image below, select "Save".
You can now install the new AGAW licence key by selecting the "Agent Awareness manager" link from the Home page and clicking on the "Install new key" button at the bottom of the screen. This will open a popup that allows to enter/paste the new licence key. By clicking on the "Run" button, we will see that the AGAW runner is restarted.
To check the successful installation of the new key, select the "Logs" tab, where you should see that the Queue runner is currently running on a set of queues.
You now have to configure the queues on which AGAW will run. Select "Edit Queues" from the Home page and select one of the atomic queues (not a composite queues) amongst the displayed queues (ie. a queue that matches only one Asterisk queue).
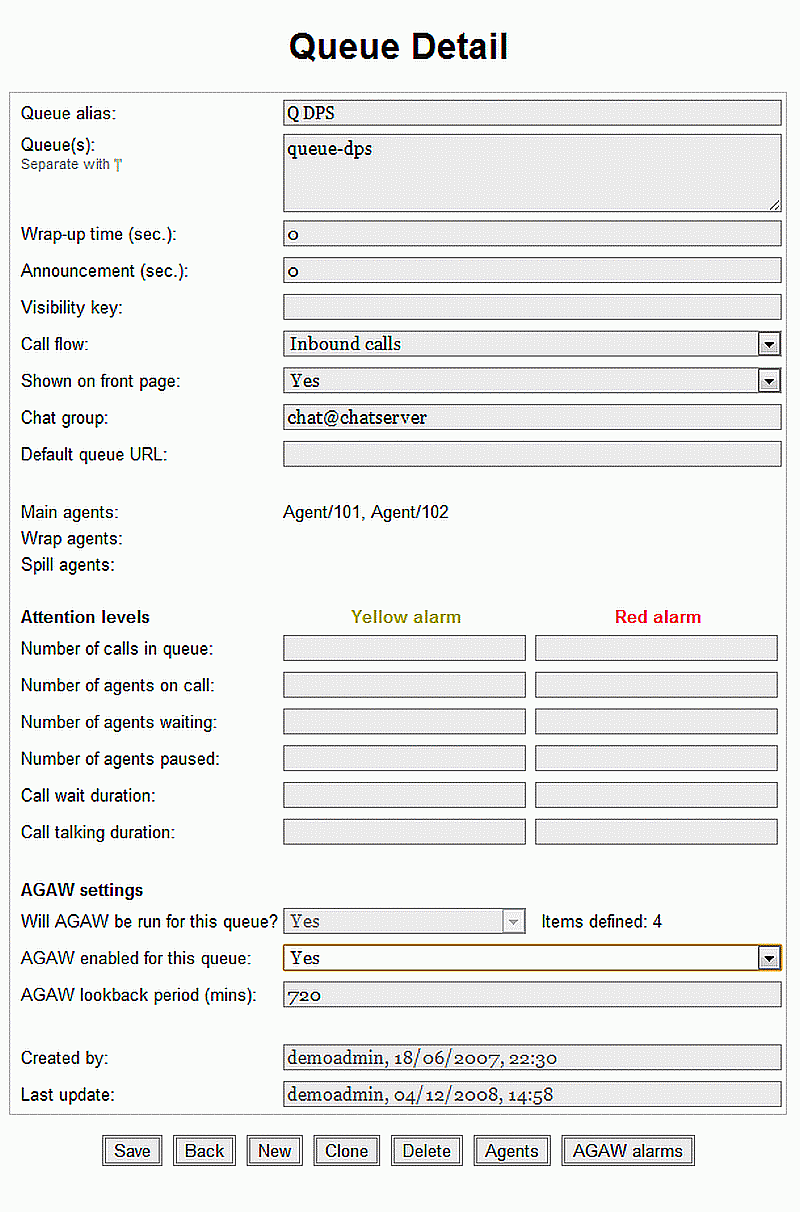
Make sure that the field "AGAW enabled for this queue" is set to "Yes" as shown in the image above. Set the "AGAW lookback period", which is the length of time (in minutes) in the past that is used for the realtime analysis.
The AGAW "Attention Levels" are alarms that can be set as values in seconds, to trigger alarms for the queue or the agent. Once this form has been completed, select "Save" and proceed with the installation of the AGAW Client, as described in the following chapters.
Agents: the AGAW client
The AGAW client is used by each agent taking part in the AGAW project and receiving statistics. It is currently deployed as a Firefox/Chrome extension; the facade component was meant to be modular, so it is well possible that other front-ends will be written in the future.
Installing with Firefox
AGAW can be installed in Firefox by browsing the Licence page of QueueMetrics and clicking on the "Firefox" link. It will work both in Windows and Linux versions of Firefox.
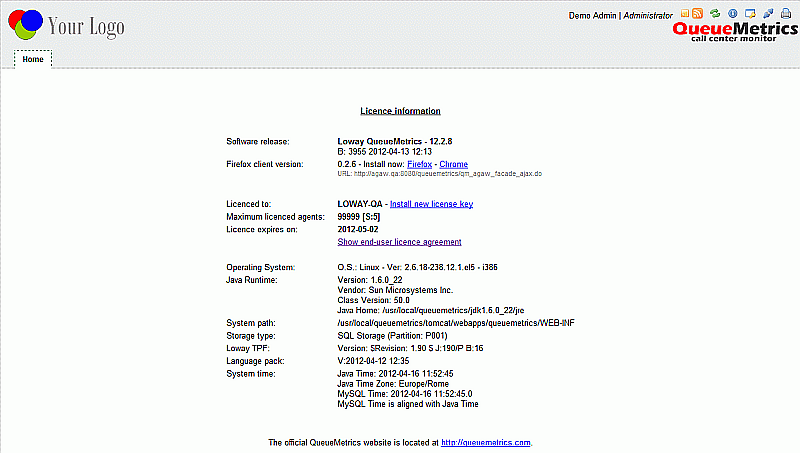
The link requires internet access, as the extension is downloaded from the Mozilla Add-on store.
After the installation, you will need to restart your browser. When you restart, you will notice a new entry called "QueueMetrics sidebar" in the "Tools" menu.
| In recent FireFox versions, you have to manually enable the "Menu" bar, so that you can find the "Tools" menu. To do so, from the Menu button select "Customize" and then "Show/hide menu bar". Once the extension is active and running, you can disable the "Menu" bar if you do not want to see it. |
The first time you open the sidebar, you will have to click on the "Setup" button.
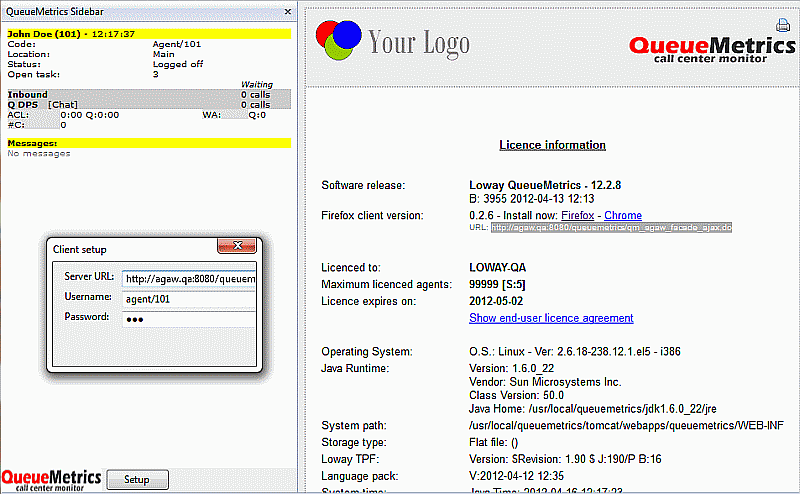
You should enter the following information:
-
Server URL: http://myserver:8080/queuemetrics/qm_agaw_facade_ajax.do (take from the Licence page)
-
Username: the agent code (or leave blank)
-
Password: the agent’s QM password (or leave blank)
Installing with Chrome
AGAW can be installed in Chrome by browsing the Licence page of QueueMetrics and clicking on the "Chrome" link.

It is also possible to send the link via e-mail to other Chrome users that share the same QueueMetrics instance.
On older versions of Chrome, it is enough to click on the link to have the extension installed. On versions 21 and higher, the user must:
-
Download the extension (agaw4chrome.crx) to their PC
-
Click the wrench icon on the browser toolbar.
-
Select "Tools" > "Extensions".
-
Drag the file just downloaded onto the Extensions page.
-
You will need to authorize the newly installed extension after reviewing its security settings
This will add the QM icon at the top right-hand corner of your browser page (next to the Chrome settings icon).
| Sysadmins managing a large number of workstations may find it easier to simply add their QM instance to the list of safe servers users can add extensions from. See http://www.chromium.org/administrators/policy-list-3#ExtensionInstallSources |
By clicking on the new icon, the QueueMetrics AGAW settings page will be displayed, as shown below:
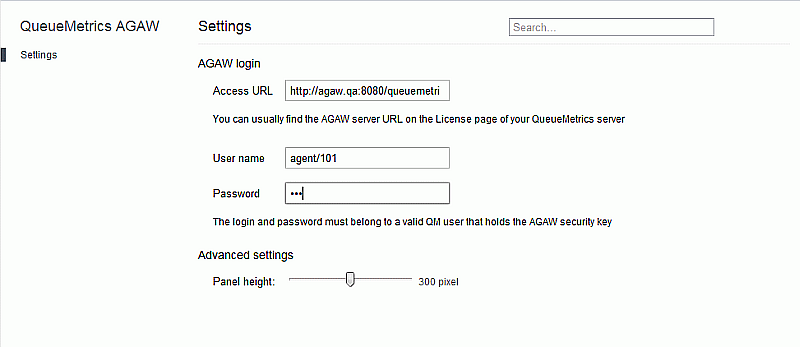
You should enter the following information:
-
Server URL: http://myserver:8080/queuemetrics/qm_agaw_facade_ajax.do (take from the Licence page)
-
Username: the agent code
-
Password: the agent’s QM password
The "Panel height" Advanced setting allows to alter/adjust the size (in pixels) of the extension panel, as required.
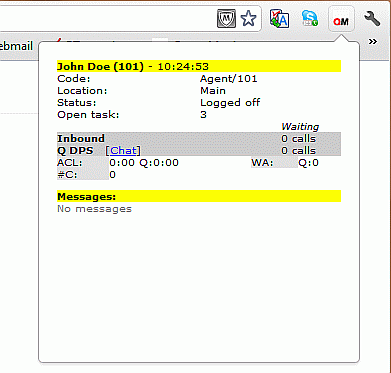
If you ever need to remove the AGAW extension you can simply select the Chrome settings icon and choose Tools/Extensions - here you can click on the "Remove" button next to the extension name. Confirm the extension removal.
AGAW Client usage
AGAW Client usage depends on the agent being able to login to QueueMetrics using the Agent’s page and hold the AGAW key.
If the AGAW web-server processes crash, the client will become blank and it can be restarted by toggling the sidebar off and on again.
The client can be set up to require a manual authentication or to provide it by default, by entering or not entering the defaults in the Setup popup.
Once the agent logs in, he gets a display that shows the current situation. On the top of the section, the current name of the agent is displayed, as well as the system time when the page was last updated. Other agent information is shown, e.g. the current agent status, the Asterisk code, the current location and supervisor (if any).
Also, a list of queues is displayed, where:
-
The agent is a known member, or
-
The agent has data for it
For each queue a different set of parameters can be displayed. The only common parameter is the current number of waiting calls, that is always displayed. Each parameter can be shown at the agent level, or at the queue level, or both.
Each parameter can have its own alarm threshold - this is definable separately per-queue and per-agent.
At the bottom of the client section there is a space reserved for broadcast messages that are of interest for the current agent, and are shown in a "bulletin board" fashion, for a given period (a few hours) and showing only the latest ones.
| At the moment, you can either use QueueMetrics or the AGAW client in the same browser, unless you use a different alias for the server in order to have two active, distinct user sessions. |
Which parameters can be displayed on the client?
A large set of metrics can be displayed on the client. We suggest to keep them to a minimum, to avoid cluttering the agent’s view with information that is not currently critical to her work.
| Code | Description | Available for queue? | Available for Agent? |
|---|---|---|---|
ACL |
Average Call Length |
X |
X |
WR |
Average wrap time |
X |
X |
AW |
Average wait time |
X |
|
MW |
Maximum wait time |
X |
|
WA |
Number of calls waiting |
X |
|
N Calls |
Absolute number of calls |
X |
|
CPH |
Contacts per Hour |
X |
X |
QCPH |
Qualified Contacts per Hour |
X |
X |
SPH |
Sales per Hour |
X |
X |
QCONV% |
Qualified Conversions % |
X |
X |
CONV% |
Conversions % |
X |
X |
#C |
Answered calls for agent |
X |
For all metrics, red and yellow alarms can be set separately at the queue and agent level, and for each queue separately.
Contacting supervisors
If this feature is enabled in the queue, agents can talk back to supervisors using an XMPP/Jabber client. This will happen by clicking on a link that points to the correct supervisor next to the queue name.
If you have FastPath installed, you can use FastPath to create a virtual supervisor queue that will be available through a "Chat Now" button that will appear on the bottom of the AGAW client.
Supervisors: accessing AGAW statistics
By giving the key AGAW_REP to your supervisors, you can have them monitor the statistics of their own agents, filtering by the locations they are allowed to see or their own supervision.
This will lead to a page where the statistics for the relevant agents will be displayed. These are the actual live stats that your agents are seeing.
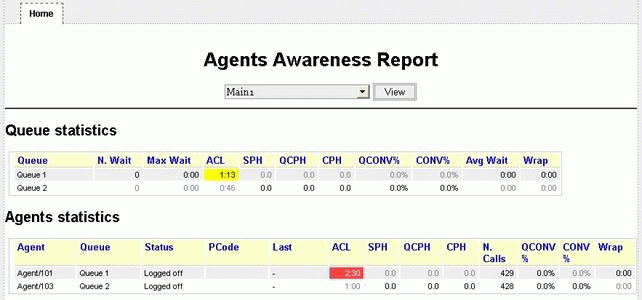
All the statistics can be displayed in a set of colours:
-
Black: the agent is seeing this item, no alarms
-
Yellow: the agent is seeing this item, yellow alarm triggered
-
Red: the agent is seeing this item, red alarm triggered
-
Gray: this item is hidden from the agent (but is calculated all the same).
Statistics are reloaded when the AGAW runner script runs, so will be updated sequentially by queue. If the runner script is not active, stale statistics will be displayed.
Supervisors: sending broadcast notifications
If the supervisor holds the key BRO_MSG, when he navigates to the Realtime page there will be a tab called "Broadcast" as in the following page:
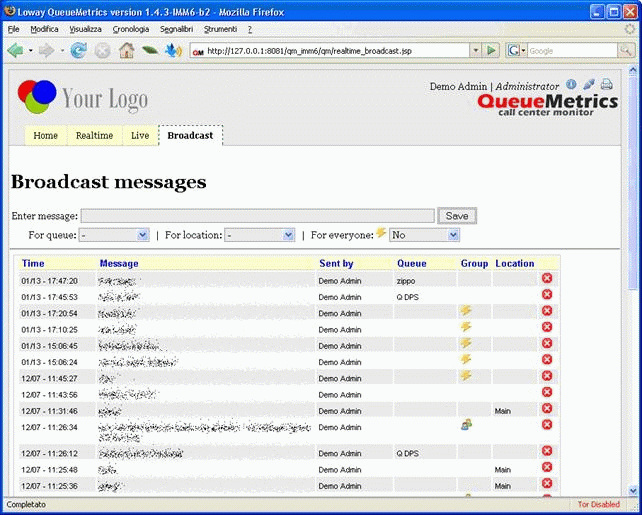
From this page you can enter broadcast messages that can reach one or more of the following:
-
Everyone logged in (using the Lightning icon)
-
All agents working on a queue
-
All agents working at a specific location
-
A specific agent
-
If the user has the key SUPERVISOR, all the agents he’s currently supervising (using the Group icon)
It is also possible to remove messages that have been sent using the "Delete" icon on the right.
Broadcast notifications can be received in multiple ways:
-
By agents using the AGAW client, or
-
By agents logged in with the Agent’s page, or
-
By agents via an RSS feed
In order for your agents to access their broadcast feed, they should point their RSS reader to the following URL:
http://qmserver-rssname.corp:8080/queuemetrics/qm_rss_broadcasts.do?user=Agent/101
where 'Agent/101' is the agent code for the agent whose messages we want to receive.
| Enabling RSS feeds requires a special configuration - see the discussion for Tasks over RSS which address the same needs. |
Administrators: monitoring the AGAW system
Administrators can run a general supervision of the whole AGAW system. In order for this feature to be enabled, they must be given the AGAW_ADM key.
This allows for the "Agent Awareness" entry to appear under the "Edit QueueMetrics settings" section.
By clicking on it, the user is led to the Status page.
The AGAW status page
This is the main page used to monitor the AGAW subsystem. All data in this section is populated by the Queue Runner - if the Queue Runner is not running, then you will find no data in this section!
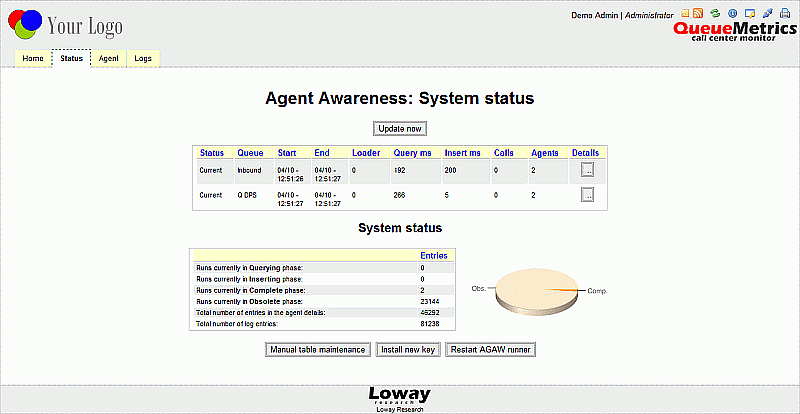
This page shows the name of each queue that has been or is being processed, when the run started and ended, how much time it took to run, the number of calls and distinct agents involved.
For example, in the screenshot you can see that there are two queues in "Current" status.
At the bottom of the page, you can see the number of entries per status plus the database size. When requested, QueueMetrics will send the client all queues that are in the "Complete" state.
Possible run statuses are:
-
Querying: data is being gathered for this queue
-
Inserting: data is being written to the database
-
Complete: data is available for the AGAW clients to read
-
Obsolete: data that was previously available, now waiting for deletion (A number of database systems have better performance if data is being added to a table versus the case where it is being added and deleted. So we do programmed deletions of stale data)
A histogram makes it clearer as to which kind of lines are in the database.
The page can be reloaded using the button at the top to see what’s going on in real-time.
By clicking on the details of a run, you will see all agent information that has been computed for that run of the queue, like in the following screenshot:
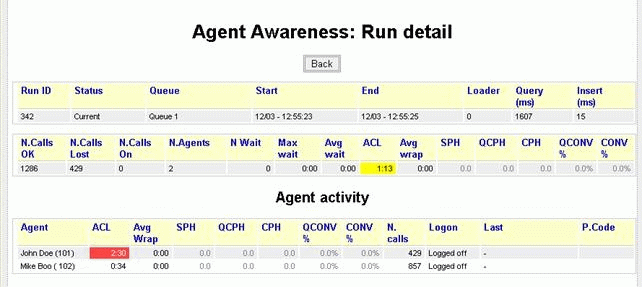
If there are any color alarms, they are shown as the background color. Possible color configurations are:
-
Black text: item visible in the client, no alarm
-
Yellow background: Item visible, yellow alarm
-
Red background: Item visible, red alarm
-
Gray text: This item is hidden from the client.
The AGAW Table maintenance page
It is possible to perform either a manual or a programmed table maintenance. We suggest basically running table maintenance from a script, but the manual option is available in case it’s needed.
Maintenance will first purge unused records, and will then run a table optimization to maximize access and insert speed.
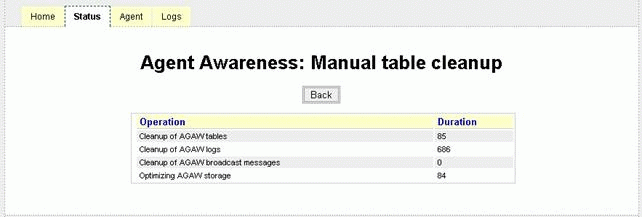
For each operation performed, an overview is displayed, showing the duration of the required operation in milliseconds.
When running on a busy system, high maintenance times are normal, as the database back-end will try to find a suitable moment to perform the required operations.
The AGAW Agents page
The Agent page is based on the same routine that fetches data for an agent - if you select the agent, then all the data that would be currently served to that agent is shown.
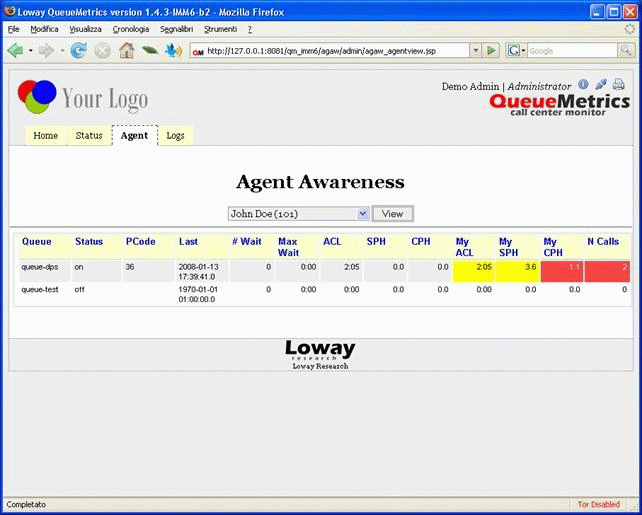
Agents can be selected from the drop-down box on the top of the page.
This is useful to see what an agent would see without accessing a real facade.
The AGAW logs page
The system log instead will show the log of the activity for both the Queue Runner and for each agent - this is useful to see real-life performance:
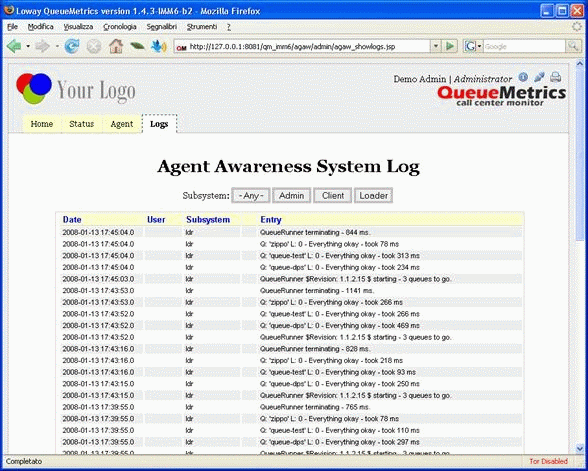
The AGAW log is divided into three parts:
-
Admin: operations performed by the administrators.
-
Client: access times for clients reading AGAW data. One entry is added for each time the AGAW system is accessed
-
Loader: The activity log of the AGAW runner. From here you can see if the Runner is working and what it is doing.
In case of errors, the relevant lines are displayed with a red dot.
When the Runner is processing, you get:
-
A line saying that the runner is starting, its current version and how many queues it’s going to consider (eg. "Queue Runner $Revision: 1.16 $ starting - 3 queues to go.")
-
A line for each processed queue, if errors were encountered and how long it took, one by one (e.g. "Q: 'queue-dps' L: 0 - Everything okay - took 250 ms");
-
A line saying that the runner is shutting down and how long the whole run took (e.g. "Queue Runner terminating - 828 ms")
You can also see client accesses for debug purposes:
-
You see which agent requested data and the amount of processing time (e.g. "Agent/101 - Client Query: Q:2 B:0 E:0 Took 297 ms Pr:0 Lo:94 Ut:0 Pe:0 Co:203 Br:0 = 297")
-
The various figures can be used for debugging purposes (e.g. "Co" is the connection time to the DB)