Editing QueueMetrics settings
System configuration must be done by the system administrator. Most configuration may be done straight from QM itself, while system wide preferences must be set editing a text file on the installation server.
To log on as an administrator, you can use the supplied account demoadmin, password demo, that will bring you to a home page like the following one:

Editing a setting, or even displaying the full detail of a specific item, is always protected by security keys, and in any case is logged on the Audit Log for further inspection - see The Audit log for more details.
Configuring users
Users and classes can be added, modified and deleted right from QM.
A list of users is presented and you can filter it by class or user name.
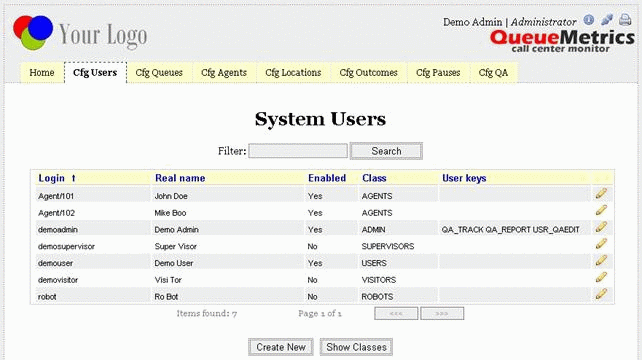
For each user, the login and full name are shown, together with the current class and any additional user keys. A user must be enabled in order to log on, so if you want to prevent somebody from logging on without deleting its user information, you can simply disable it. A number of default users are shipped with Enable: No in order to prevent unauthorized access.
The list of users is paged and you can use the top box named "Filter" in order to search for a specific user or a set of users that match the entered substring. You can also click on the column name to toggle ascending versus descending sort order.
The "Create new" button lets you add new users while the "Show classes" button leads to the class editor.
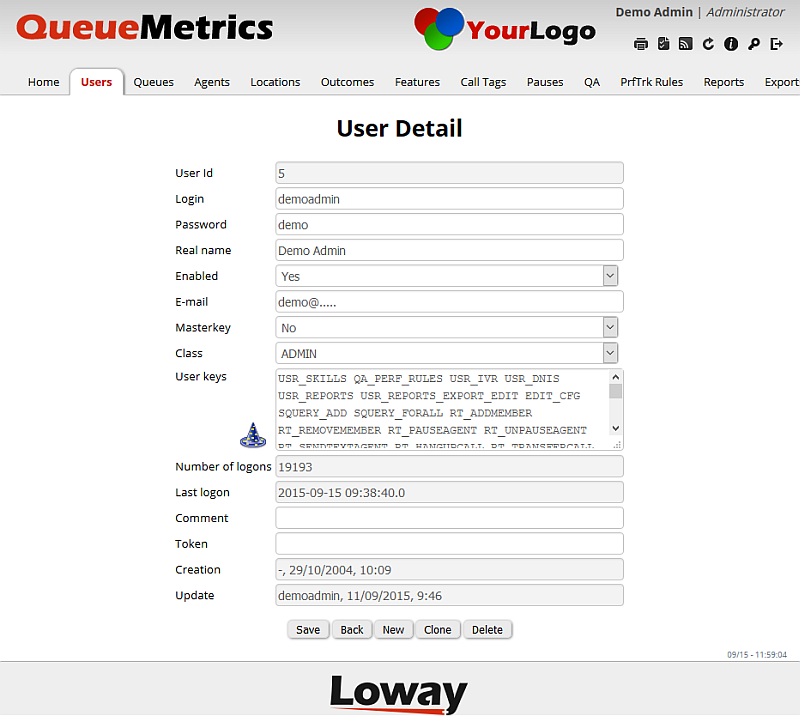
When you add or edit a user, you are presented with a list of fields to enter:
-
Userid is a technical reference used internally. Read only.
-
Login is the login string.
-
Password is the password, shown in clear text.
-
Real name is the name shown in the top part of the screen
-
Enabled lets you temporarily disable somebody from using QM.
-
E-mail is the user’s e-mail address (Optional).
-
Masterkey: if set to Yes, all security key checks are bypassed. DO NOT SET UNLESS YOU KNOW WHAT YOU ARE DOING!
-
Class is the current user class
-
User keys are additional keys the user holds. Separate each key with a space. If a key is preceded by the minus sign, it means it’s revoked even if the class grants it. The pushbutton HandleKeys starts a wizard helping administrators to proper handle keys for users (see below).
-
Number of logons tells how many times the user logged on in QM. Read only.
-
Comment is an optional free comment.
-
Token is used for Single Sign-on.
-
Creation and Update: the user and date/time when the record was first created and then last updated. Read only.
| When you first log on to QueueMetrics, you must change the passwords to all default users. Failure to do so represents an important security breach! |
The "wizard’s hat" icon located under the User keys field opens a popup where all available pre-defined security keys are listed together with a description. By clicking on each checkbox is possible to assign/unassign the associated key to the user. The wizard helps the administrator to generate a valid keyset by computing key dependencies and/or uncompatibles key pairs and checking or unckecking keys accordingly.
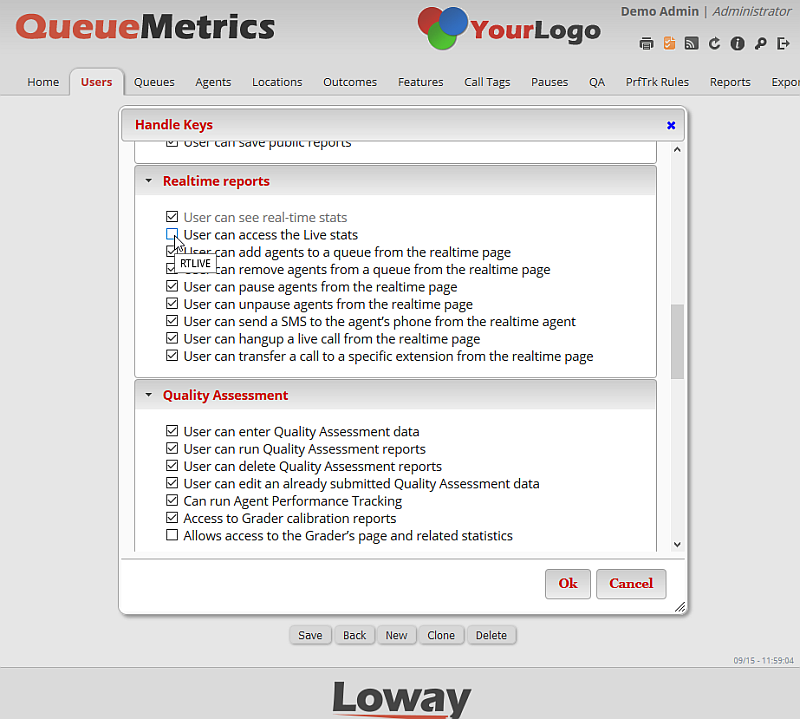
Keys inherited from the class where the user is belonging to are greyed out. Is, moreover, possible to uncheck an inherited security key thus generating the proper negative definition for the edited user.
Flying over a checkbox with the mouse, a tooltip containing the associated security key value is shown.
Pressing Save closes the wizard and updates accordingly the User key list in the user definition page.
Editing user classes
User classes can be configured freely; you can create individual key rings with special privileges to best suit your needs.
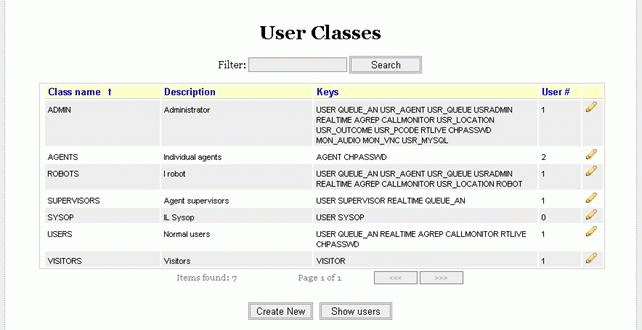
Each class has a set of keys that can be freely edited in much the same way as users by clicking on the "edit" icon (the pencil).
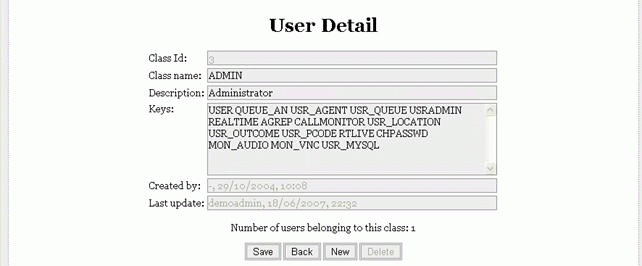
No class can be deleted as long as there is at least one user that is member of it.
The default classes should be enough to get most systems started:
-
ADMIN is for the system administrator only, and lets you do nearly everything, including system configuration;
-
MANAGERS is for most QM users, the ones that have to run the reports and monitor real-time activity;
-
AGENTS is for individual agents logging on to their web page.
-
VISITORS is for visitors accessing the simplified real-time page
-
ROBOTS is for automated data download
| The administrator can start a security key wizard by clicking on the button HandleKeys. For more information on this wizard, please refer to the previous paragraph. |
Password Encryption
Since version 18.04, QueueMetrics allows for user passwords to be encrypted, in order to guarantee greater security.
To manage the process of password encryption, two new system parameters have been added to the system configuration.
-
pwd.minAllowedLevel
-
pwd.defaultLevel
The first parameter, pwd.minAllowedLevel, dictates if the system allows users with non encrypted passwords to access the system.
The two different behaviours are associated with two different values for the system parameter:
-
pwd.minAllowedLevel=1 Users with non-encrypted passwords can login onto the system.
-
pwd.minAllowedLevel=2 Users with non-encrypted passwords cannot login onto the system.
The second parameter, pwd.defaultLevel, indicates if the new passwords that are set will be encrypted or not. When saving a new password for a user, this property decides if the password is to be encrypted:
-
pwd.defaultLevel=1 New User’s passwords will NOT be encrypted.
-
pwd.defaultLevel=2 New User’s passwords will be encrypted.
To encrypt a user’s password, the system administrator should first set pwd.defaultLevel to a value of 2 then, by accessing the Edit User page, a new password for the user must be set. With QueueMetrics 18.04 the user editing page has been modified to include a password confirmation field.
When the new password is set, and the modifications are saved, the new password will be saved as an encrypted password.
Configuring queues
A list of queues must be set before accessing QM. Each queue can be made visible to only a specific set of users by adding a key - this can be useful if, for example, each queue has a manager viewing data for it, while only a CC manager sees data for all queues in the center.
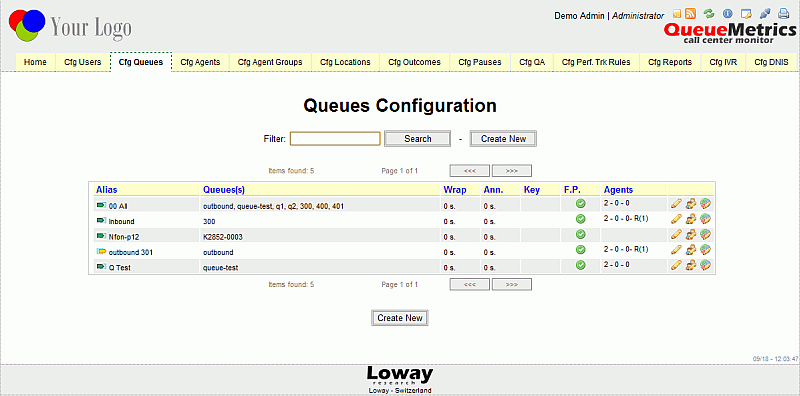
You can search for a specific queue by entering data into the Filter box on top of the page, or change the default sort order for the list by clicking on one of the column names.
The default page shows:
-
The queue Alias and Composition
-
The Wrap and Announcement durations
-
The key protecting the queue, if any
-
FP - Front Page: Whether that queue will be visible from the queue selection boxes
-
The number of known agents that are member of the queue, by service level (as Main - Wrap - Spill).
The pencil icon will let you edit the queue, while the "People with pencil" icon lets you change queue associations. The 'pie chart' icon at the end allows to define/assign the set of queues on which agents can run reports. No specific key or property are required, but this feature is only available as of QueueMetrics version 12.10. For an administrator to make this feature available for the agent, it is necessary to have at least one queue and a report assigned to the agent.
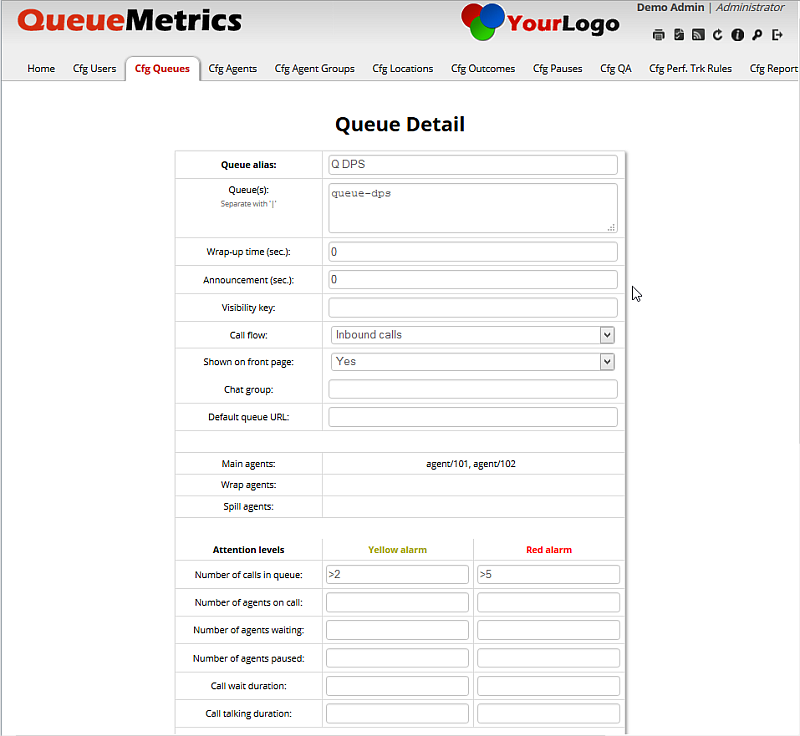
For each queue you have to define:
-
An Alias, that is the name users will see in the queues combo box on the Home Page;
-
A set of Queues, that can be the name of an Asterisk queue as seen from the Queue() command or a set of names separated by the pipe symbol, as in queue1|queue2|queue3. This lets you aggregate queues freely. You can also use wildcards - see below. Queue names can contain spaces, though we suggest using simple strings.
-
An optional Wrap-up time, i.e. how many seconds an agent stays idle after hanging up;
-
An optional Announcement duration, that lets you deduce the duration of the queue announcement that is played to the agent from the actual metrics;
-
An optional Visibility key, that makes the queue visible only to users holding that key.
-
The Call flow direction, i.e. whether the queue is an inbound (classical) queue or an outbound queue (made to track individuals agents calling out or the activity of a full-fledged predictive dialler). Select "any call" when you aggregate queues with different call flow settings.
-
If it’s Shown on front page, that is, in the main Queue selector combo box (if not, the queue is said to be invisible).
-
A Chat group, that is, the XMPP address of a queue manager
-
A Default URL to be used on the Agent’s page if no URL is passed in the queue log (see below) in order to open a third-party application.
-
A Service Level Agreement (in seconds), that is the point in time where you want SLA measured for reports using this metric, e.g. DD09, DH09, DW09
-
External reference: An identifier for the queue that is used at the PBX level and is opaque to QueueMetrics. Used by some interaction or autoconfiguration modules.
-
Update protection: If this option is set to "Yes", the queue cannot be updated by the "Configuration Synchronizer". Default is set to yes.
-
Delete protection: If this option is set to "Yes", the queue cannot be deleted by the "Configuration Synchronizer". Default is set to yes.
-
A number of Attention levels, see below.
-
The current known Service groups for that queue, i.e. which agents are linked to that queue
-
The current WombatDialer campaings for the queue (see below)
-
The current AGAW settings for the queue (see below)
-
The current AMO settings for the queue (see below)
By clicking on the Agents icon, you can define the position of each agent as a member of the service groups for that key. An agent cannot be a member of more than one group per each queue s/he is a member of.
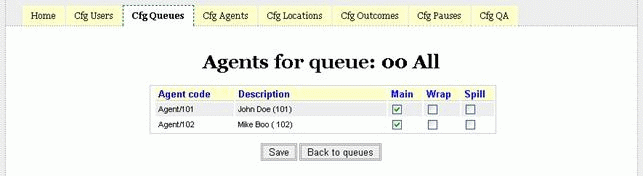
It is of course perfectly legal for an agent defined not to be used in a specific queue.
| If, usually because of a misconfiguration, a queue has a known member that does not exist within the agent list, then the queue name is shown in red in the queues list and the code for such agent(s) is shown in red on the queue details. This may happen, for example, if you create an agent, add it to a queue as a member, and then go back and delete such agent. |
The Queue URL
The rules followed by QueueMetrics when displaying a link icon (and linking to the associated URL for your call) are as follows.
On report pages:
-
If the reporting queue is not a composed queue and the queue has an associated URL (coming from the queue definition page), then this URL is shown.
-
If the reporting queue is a composed queue and/or no URL is associated to that queue in the queue definition page, then:
-
If the call has an associated URL in the queue_log, this will be shown
-
If the call has not an associated URL in the queue_log then the URL specified in the configuration properties key default.crmapp will be shown. If no default.crmapp URL has been specified in the configuration properties file, the icon will not be shown.
-
On the live agent page:
-
If the queue where the call comes has an associated URL in the queue configuration page then this URL is shown for each call
-
If the queue where the call comes has not an associated URL in the queue configuration page then:
-
If the call has an associatd URL in the queue_log, this will be shown
-
If the call has not an associated URL in the queue_log then the URL specified in the configuration properties key default.crmapp will be shown. If no default.crmapp URL has been specified in the configuration properties file, the icon will not be shown.
-
Setting attention levels (Red and yellow alarms)
It is possible - but not mandatory - to define all or some attention levels for the given queue. To do so, you have to fill in each queue attention levels parameter with an expression that will be matched to the current property’s value in order to trigger a defined alarm.
QueueMetrics does currently allow to set two possible alarm thresholds; that is a "yellow" and a "red" alarm. You can define one or both of these properties, according to your preferences. Those values are used currently only to trigger alarms in the real-time panel.
For example, imagine we want to set a yellow alarm on the queue wait for each call; we want cells to turn yellow if the wait time exceeds 30 seconds, and to turn red if it is over one minute. To do so, we enter "> 30" in the yellow alarm box near to "Call wait duration", and "> 60" in the red alarm box on the same line.
In the case where both yellow and red conditions match, the red alarm prevails.
Currently, the following functions can be used to match a value "=", "<", ">", "!=" (different).
The possible alarms are the following:
-
Number of calls in queue: how many calls are present in the queue.
-
Number of agents on call: how many agents are on call
-
Number of agents waiting: how many agents are idle
-
Number of agents paused: how many agents are on pause
-
Call wait duration: how much a call is waiting before being answered
-
Call talking duration: the duration of the agent’s conversation
Using wildcards in queue names
QueueMetrics allows a limited use of wildcards to group together queue names. Wildcards work by matching the composition of known single queues, so if a queue is not defined in QueueMetrics (even if it is present on Asterisk) it will NOT be matched by a wildcard of "*".
On the other side, a hidden single queue will be matched by a non-hidden front-page queue whose definition is "*".
With wildcard matching:
-
The Asterisk
stands for any number of characters. E.g., "open" as the queue composition will match any atomic queue starting with "open". Just entering "*" as a queue composition will match any atomic queue on the system. -
The question mark
?stands for a single character - e.g. "open?" will stand for "open1" and "openq", but not for "open99". You can group together a number of question marks to match multi-character sequences of known length, e.g. "open??" will match "open99". -
Any string starting with a caret
^will be interpreted as a case-insensitive regular expression that can be used to create very complex rules. For example, if you want all queues that do not start witn an underscore, you could use^(?!_).+.
AMO Settings
To create an AMO campaign:
-
Make sure that the queue is set for Outbound
-
Set "AMO enabled" to Yes
Once a campaign is set for AMO, it is visible in AMO Campaigns.
You can then edit the details of how the campaign is supposed to behave.
-
Max attempts is the maximum number of times a number is recycled in front of negative outcomes.
-
Seconds before recall is the minimum time that will be interleavled between further attempts. As calls are "pulled" by agents, you have no guarantee that this time will be respected - that is, this is a minimum value, but the actual value may be way higher. Measured since the the reschedule decision is taken.
-
Recall stepping might be Fixed, Linear or Exponential. In fixed mode, recalls are always spaced by the same distance. In linear mode, recalls are multiplied by the number of recalls it is being attempted - that is, the first time the recall distance is applied, then two times, then three times, and so on. In exponential mode, the distance is multiplied by 2 raised to the number of attempt - so the first time it’s the basic distance, the second time two times that, then four times that, then eight, and so on.
-
Valid outcomes are the set of call outcomes that will be considered signs of a successful call. "*" means any outcome, "NONE" means no outcome set, or you can enter a set of coutcome codes separated by space.
-
Recall attributes are the attributes that will be copied from the number into the
queue_log, as QueueMetrics variables. Separate with space.
| To understand how AMO works, see Assisted Manual Outbound. |
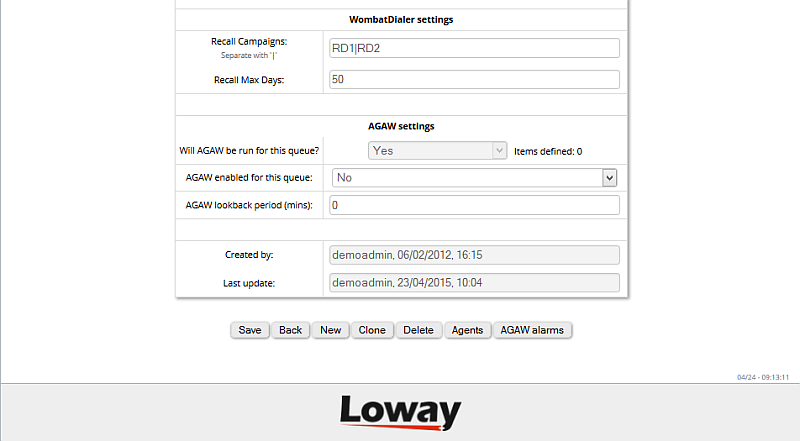
Configuring redial services through WombatDialer
WombatDialer is highly scalable, multi-server, easy-to-use telecasting platform produced by Loway. Queues in QueueMetrics can be associated to dial campaigns in WombatDialer thus allowing easy implementation of recall services. By specifying a set of pipe separated campaings and a maximum recall day period, an agent can schedule a recall by clicking on an icon on the call list in their own agent’s page. For further clarifications, see section Recall Scheduler
Configuring queues to be processed by the AGAW Runner
The AGAW Runner will use the following rules to decide which queues and agents to process:
-
All queues that are "simple", i.e. not composite, are taken into consideration for processing by the runner. All queues that have the AGAW runner enabled will be actually processed (you must enable that manually in the queue config page).
-
All agents that are linked to a queue are processed for that queue, even if there is no data for them; plus, any unknown agent that is detected working on a queue is processed for that queue..
In order for a queue to be processed by the runner, and show visible metrics to the user:
-
The "Will AGAW be run…" must be set to "yes"
-
The Items defined must be > 0 (or the agent will see no metrics)
-
The AGAW enabled should be "Yes"
-
The AGAW look back period can be left blank (default). This is the size of the look-back period the AGAW runner uses.
The set of metrics that is enabled and their alarms is defined in the AGAW queue configuration screen (click on the "AGAW alarms" button):
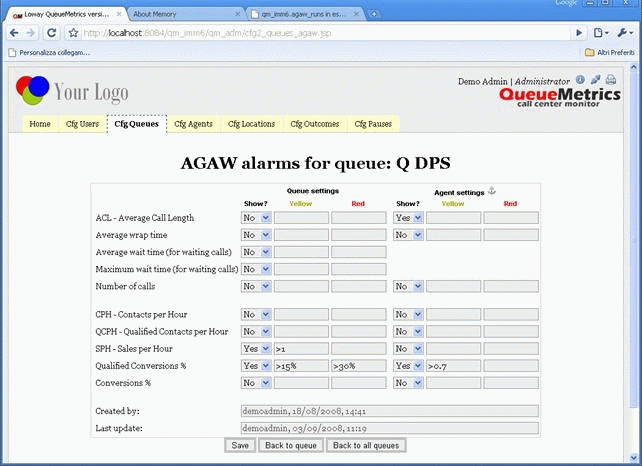
As you can see, for each metric there are a couple of switches that decide:
-
Whether that metrics is to be shown at all
-
Red and yellow alarm levels for the whole queue (to be shown in AGAW, so they might differ from the ones used for the real-time page)
-
Red and yellow alarm levels for each agent separately
These settings are applied from the next run of the AGAW runner, so they can be modified while the AGAW runner is active and will be picked up when the relevant queue is processed.
All values are always computed; you can toggle visibility of values on and off (if they are "Off" they are visible in the AGAW monitor but NOT to the user).
Alarms can be expressed as:
-
Integers (for time periods and n. calls)
-
Floating-point values ( e.g. > 3.7)
-
Percentages (e.g. > 10%).
While percentages for the Queue part translate to the corresponding ratio (e.g. 10% means 0.1) in the Agent part they are anchored to the Queue metrics - that is if number of calls is at a given moment 1000 and there is an agent alarm at "< 1%" , if the number of calls taken by that agent are less than 1% of the queue the alarm will be triggered.
If you need to express a fixed percentage in the Agent part, use the corresponding ratio, as in the Qualified Conversion example above.
Configuring AMO campaigns
To enable AMO (Assisted Manual Outbound) calls on a queue, you will need to open the Queue Settings page of a given Queue, and set the "Enabled" flag to "Yes" in the "AMO Settings" section.
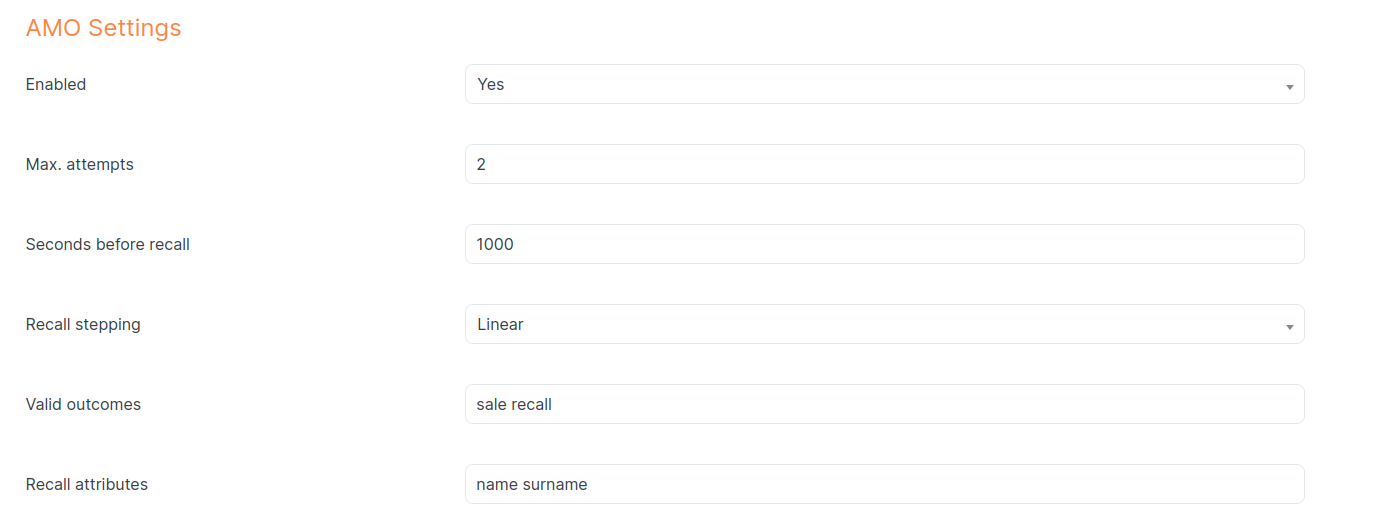
This will mark the queue as an AMO queue, which will reflect in the Agent Page by showing the AMO tag on the selected queue.

Other important setting you can configure here are:
-
Max. Attempts: The maximum numbers of times an AMO number can be retried before being discarded.
-
Seconds before recall: The number of seconds that needs to pass between a failed AMO call and its re-shuffling in the AMO queue.
-
Recall stepping: The type of Recall Stepping algorithm to use.
-
Valid outcomes: The call outcomes that are counted as valid towards marking an AMO call as completed.
-
Recall attributes: The attributes for the AMO call that QueueMetrics will keep track of. These should match the attributes associated to a number in an AMO list.
Once the AMO queue is configured correctly, you can move to the AMO editor, where you should immediately see the Queues that are AMO enabled, listed as AMO Campaigns (Each queue counts as a single AMO Campaign).
Clicking on the Queue name will navigate you back to the Queue Setting for the Queue associated with that AMO campaign.
Clicking on the pencil icon will navigate you to the List editor for that specific AMO campaign, where you can work on the list of numbers linked to the AMO Campaign in question.
Configuring AMO lists
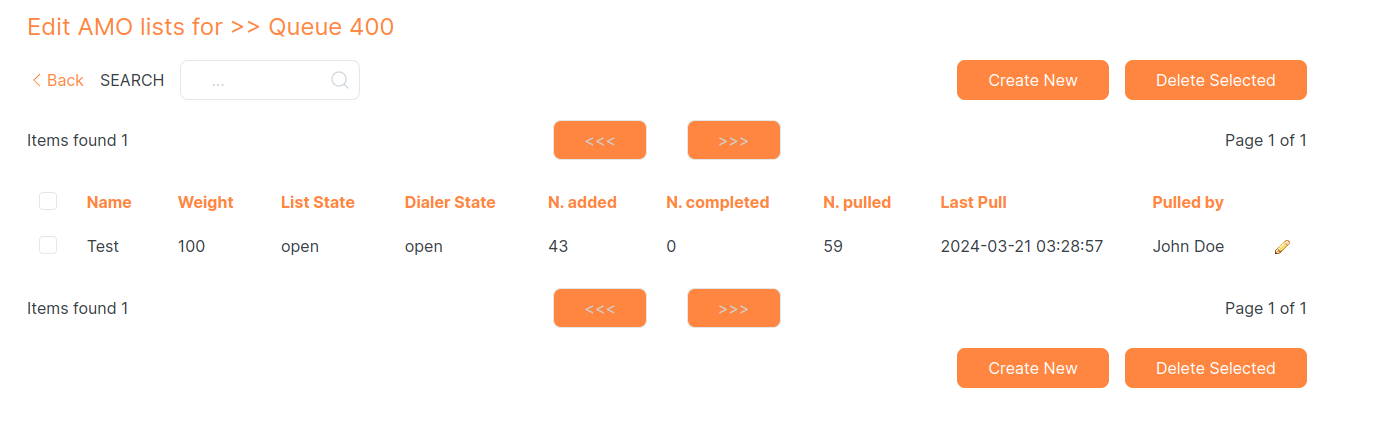
Here, you will see a list of AMO lists that are related to the currently selected AMO Campaign. You can always navigate back to the AMO campaigns list by clicking on the "< Back" button in the top-left of the screen.
Clicking on the pencil icon will navigate you to the editor for that specific AMO list. Here, you can edit the list itself, see its usage statistics, and upload numbers by uploading a CSV file.
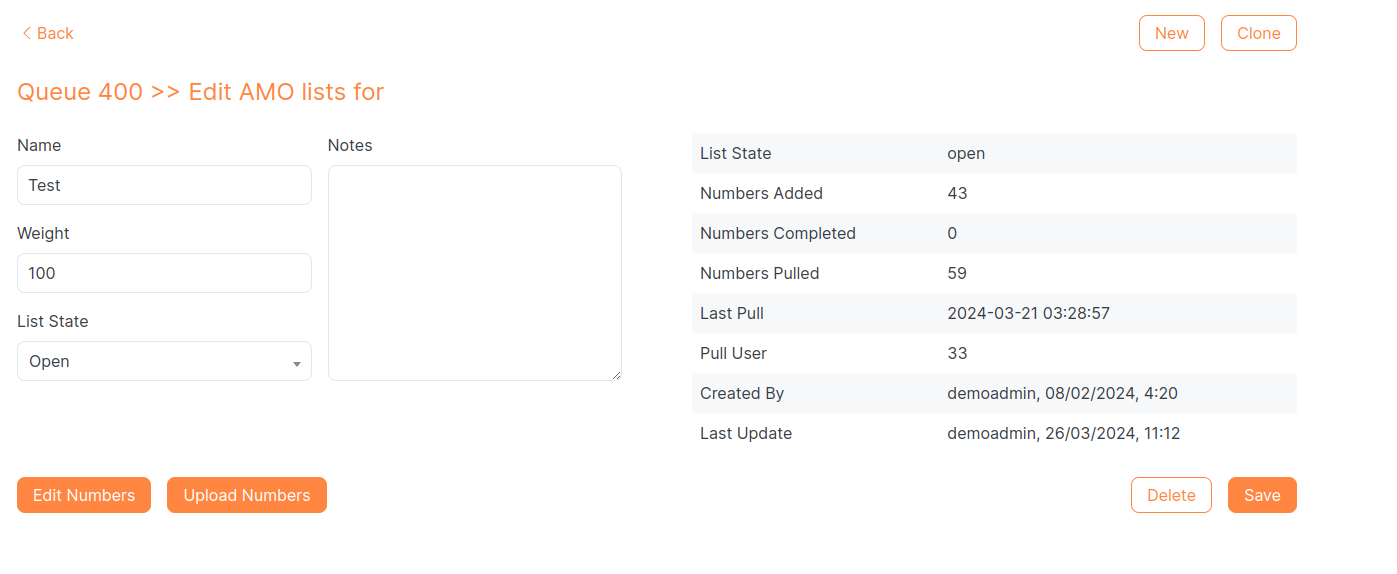
Configuring AMO numbers
The most convenient way to upload numbers into an AMO list, is to use the "Upload Numbers" button in the List editor. This will open a modal that allows you to drag and drop or click to upload a .csv file containing the numbers in question.
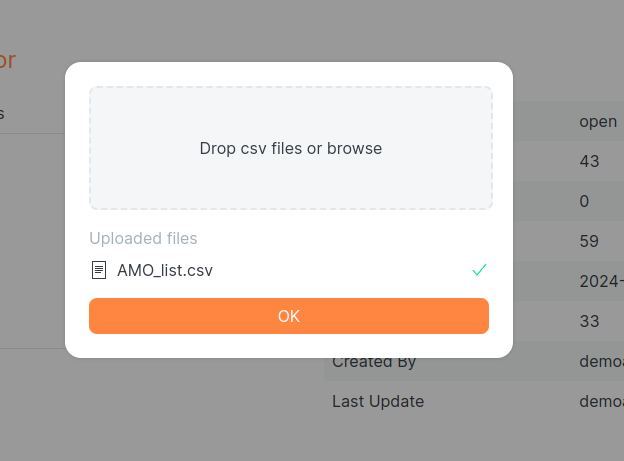
By clicking "OK", the file will be processed and uploaded to QueueMetrics, adding the numbers to the current list.
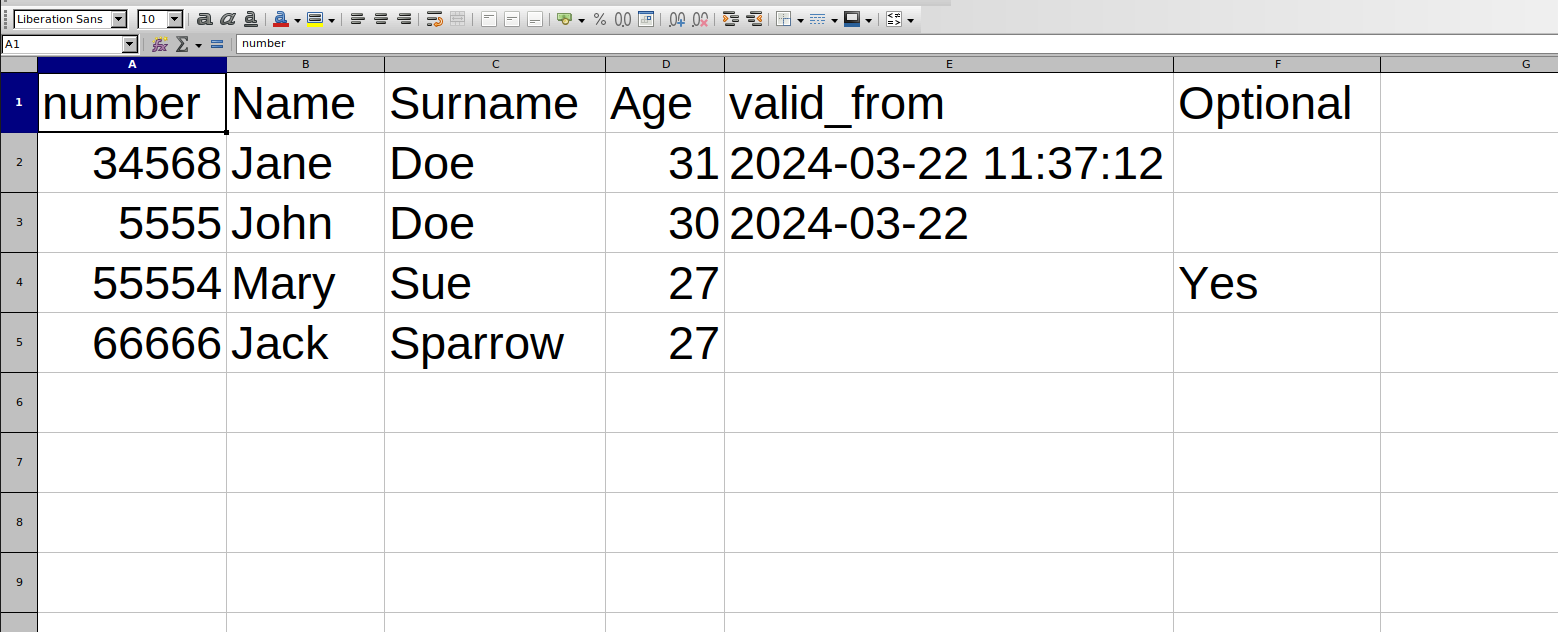
| The file MUST be a .csv file, and it needs to contain: |
-
A "number" attribute.
-
At least one record.
-
Any number of arbitrary attribute/key pair (Remember to also write them in the Queue AMO Settings, under "Recall Attributes".)
-
The valid_from attribute (Optional) in the format "AAAA-mm-gg HH.mm.ss" or "AAAA-mm-gg". If the hour is missing, it will be automatically set to 00:00:00. If the whole day is missing, the number will be immediately marked as valid for shuffling in the AMO Campaign.
Configuring agents
Agents should be configured so that they:
-
are decoded to their own name when they are found in reports
-
can be set as members of service levels for queues.
-
can be assigned an optional Location, that can also be used as a filter condition.
-
can be assigned an optional User Group, that can also be used as a filter condition.
-
can be assigned to a Supervisor
-
can have a VNC URL defined
-
can have a Current Teminal defined.
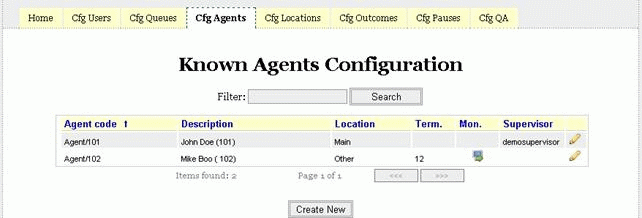
When editing an agent, the following screenshot appears:
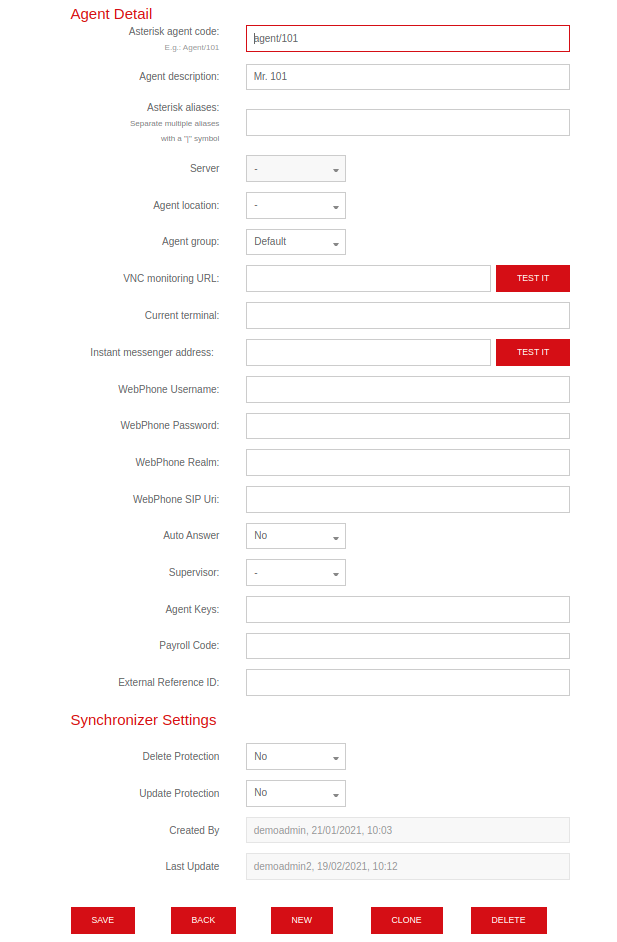
For each agent in use, enter:
-
Agent code as the Asterisk agent code, e.g. Agent/101;
-
Agent description as the agent’s own name.
-
Asterisk aliases is a list of aliases that the agent appears on the
queue_logas. See below. -
Default server: for cluster mode, the default server for the agent. This information is used to pre-populate the related field in the realtime agent page logon panel. Leave empty if the agent is not associated to a specific server.
-
Agent location and Agent group can be selected from a drop-down list of defined locations. Leave blank if not needed.
-
VNC Monitoring URL: the URL that will launch the VNC monitoring app for the given agent
-
Current terminal: the current terminal for the given agent. If this field is left blank, unattended audio monitoring will not work. If you are using regular Asterisk agents, just enter "-" as the current terminal to make audio monitoring work. This field is used to pre-populate the "Current extension" field in the agent real-time logon panel.
-
Instant messenger address: an XMPP address associated to the agent. Used in the real-time page for supervisors to initiate a chat with the agent.
-
WebPhone Username: the SIP username used by the softphone in the realtime agent page to authenticate the agent
-
WebPhone Password: the SIP password used by the sofphone in the realtime agent page to authenticate the agent
-
WebPhone Realm: The authentication SIP Realm used by the softphone in the realtime agent page to authenticate the agent
-
WebPhone SIP Uri: An optional SIP URI used by the softphone. If blank, the username@sipserver is used
-
Auto Answer: If set to yes, the agent’s Softphone (in the agent page) will automatically answer incoming calls, if no other calls are currently active.
-
Supervisor: the supervisor for this agent. This can be selected between all users holding the key SUPERVISOR.
-
External reference: An identifier for the agent that is used at the PBX level and is opaque to QueueMetrics. Used by some interaction or autoconfiguration modules.
-
Update protection: If this option is set to "Yes", the agent cannot be updated by the "Configuration Synchronizer". Default is set to yes.
-
Delete protection: If this option is set to "Yes", the agent cannot be deleted by the "Configuration Synchronizer". Default is set to yes.
If you want an agent to log on to their own page, you also have to create a user with the same name.
On the bottom of the page, the current association of that agent to a set of queues is shown.
The Agent Detail page is accessed by selecting the "Edit agents" link on the QueueMetrics Home page and then clicking on the "Edit" icon for a specific agent.
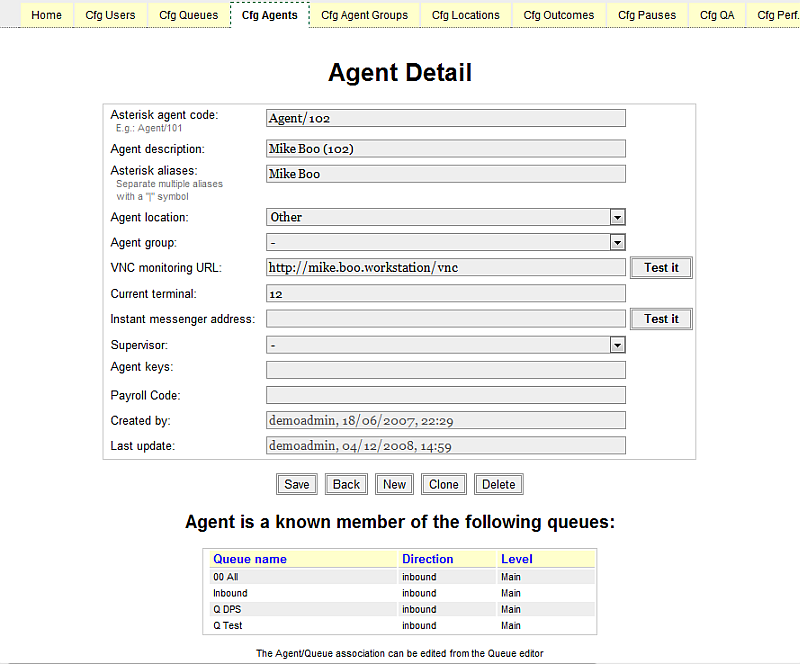
Asterisk aliases
It is possible to add one or more "friendly names" for agents within the "Asterisk aliases" field, which can be found in the Agent Detail page. Such names are alternate ways that the same agent is logged on the queue_log.
This may be useful if the code for the same agent was changed (e.g. up to a certain date you used two digits for agents, and at some point you made them tree digits, so the same person who had code "20" now appears as "120" - but it is always the same person). Another common occurrence is FreePBX logging the agent’s full name instead of their code.
You may have multiple aliases, all separated by the pipe symbol. If an alias ends with a space, you have to enter a trailing pipe symbol too (e.g. `"john doe |“). Note that when an unknown alias that has trailing spaces appears on reports, it is printed with dots instead of spaces (e.g. "`agent/john·doe·”), so that you can see those spaces are there.
When you enter an alias that does not start with "agent", QueueMetrics will automatically add a second alias starting with "agent", so that when you define e.g. alias "120" you do not need to explicitly define "agent/120" too (but the opposite does not apply!).
| If you use the hot-desking mode, you must make sure that no extension used for hotdesking is ever set as an agent alias; otherwise the agent will be logged on corrrectly, but it will be impossible to pause or log them off (as the extension will not be found, and shown as empty). You will notice such cases because, on the Real-time page, the agent who logged on with hot-desking will have a blank Extension field. If this happens, to fix the issue, just remove the alias. |
Configuring locations
The following configuration transaction lets you define locations for your agents. To access this page, a user must be holding the USR_LOCATION key.
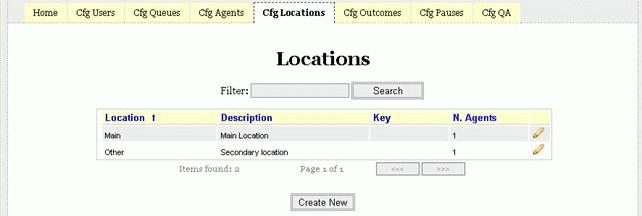
Each location has a short name, a longer description, and a visibility key, so that only users holding that key may select that location as a source for reports.
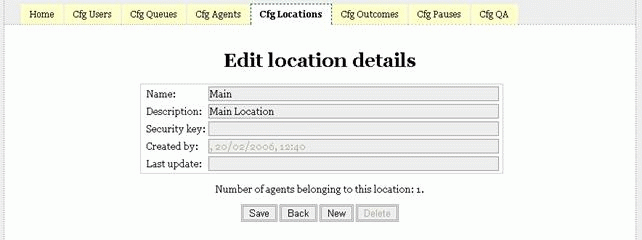
A location cannot be deleted if at least one agent is defined for that location.
Configuring call outcomes
We define a call outcome as a flag to be added to a call, either when the call is ongoing or when the call has just finished, that will signal the result of the call from a business point of view. Such a flag is optional for QueueMetrics and can be added to both incoming and outgoing traffic.
The call outcome will be defined by a numeric sequence that the agent will either key in on their telephone terminal or report through QueueMetrics itself through the Agent’s page. QueueMetrics will not consider how the sequence is entered, as long as it’s present in the queue_log data it runs on. Such records can be generated, for example, by an outbound dialler that is able to pre-screen answered traffic.
To minimize internal searching costs, the call activity must be entered either while the call is in progress or within one hour of its completion. If more than one call activity code is entered, the latest takes precedence over the previous ones.
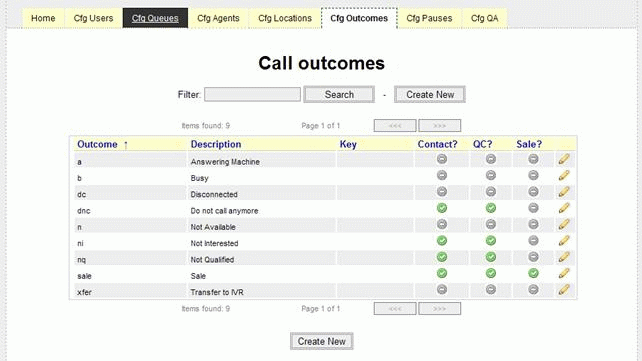
As you can see, each outcome can set two flags: a "This call qualifies as contact?", "The call qualifies as Qualified Contact" and a "This call qualifies as sale?" flag. This will be used in order to produce statistics on traffic (see section How are Call Outcomes calculated?).
If a call code is found but not defined through the configuration screen, QM will report on it and treat it as a "No contact" and "No sale" call.
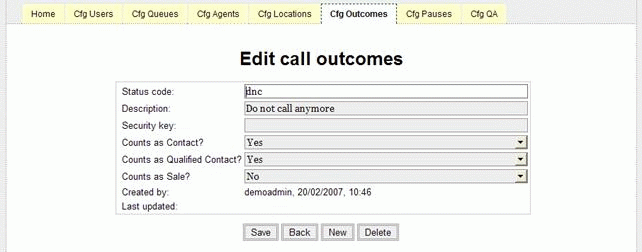
The editor page lets you set:
-
A numeric code for that outcome. The system will check that it will not be duplicated on the list (The code should be numeric so it may optionally be keyed-in using the rep’s terminal)
-
A text label for the outcome (e.g. "Contact")
-
A flag telling the system whether that outcome counts as a "Contact"
-
A flag telling the system whether that outcome counts as a "Sale"
-
An optional security key for that outcome. This will be used only when displaying outcome choices for a given call in the Agent’s page. The reporting engine will report on all outcomes present in its analysis.
-
A 'Queue visibility' list - you can list a set of atomic queues for which this code will be displayed. Queues are separated by whitespaces. The field accepts wildcards to match multiple queues and/or subqueues. If the field is left blank, then the code is displayed for all queues.
| Outcome status codes MUST be defined only with numbers and lowercase letters. The following characters are also allowed: _-.@/()=?^ . QueueMetrics will automatically delete wrong characters and change uppercase characters to their lowercase equivalent. |
Configuring Feature Codes
For call centers that require to analyze agent performances at a level below call outcome, the concept of feature codes has been added since QueueMetrics version 15.09. A user can think about feature code like a sub-outcomes. They can, optionally, have hierarchical relationships with the primary outcome code. A simple example of the feature code concept is the pair of outcome/feature like "Not Interested"/"costs too much". A call may have an unlimited number of features associated with. Some features may be flagged as goal. Goal features are counted separately and generate separated statistical figures in reports.
Editing feature codes requires holding the key USR_OUTCOME.
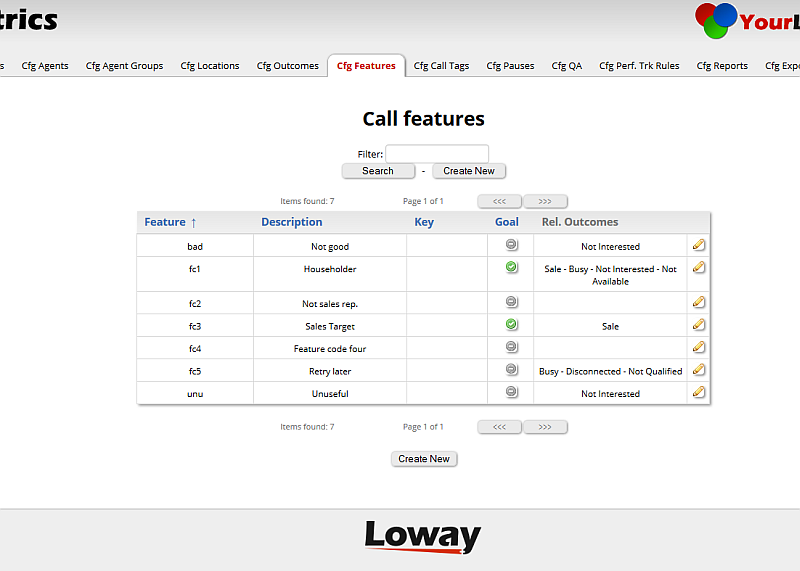
By clicking on Create New button or on the pencil icon present on each feature code row in the list, a user can create or edit an already present feature code.
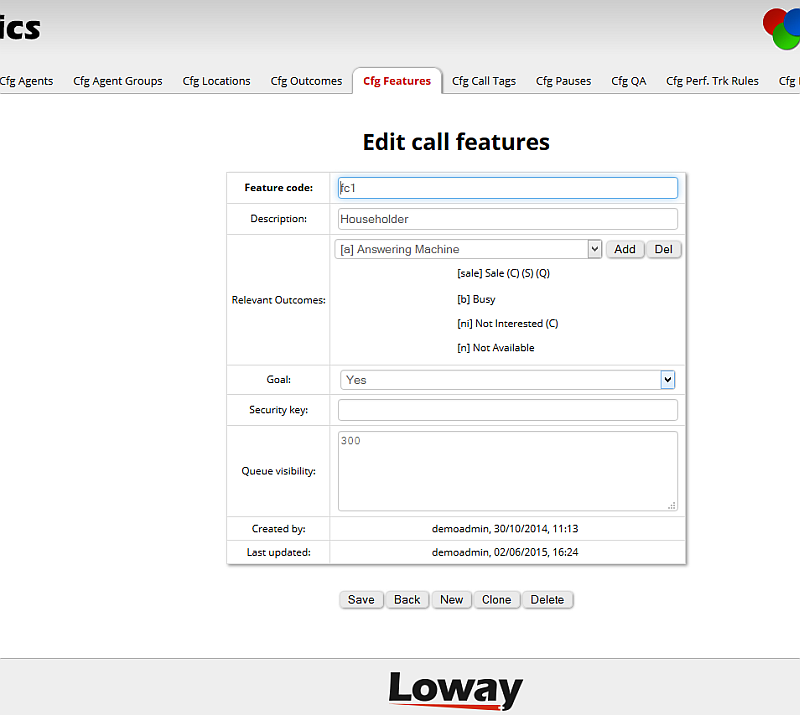
As told before, tag features can be linked with a specific outcome code set. To link a feature code with a specific outcome or set of outcomes, a user should select the outcome from the dropdown, then click on the Add button. The list of already associated outcomes are shown below the dropdown. To remove an outcome association, a user should select the proper outcome from the dropdown, then click on the Del button.
Clicking on Save updates the feature code on QueueMetrics database.
| Feature status codes MUST be defined only with numbers and lowercase letters. The following characters are also allowed: _-.@/()=?^ . QueueMetrics will automatically delete wrong characters and change uppercase characters to their lowercase equivalent. |
Configuring Tag Codes
Some call centers require to report call set at the list level below campaign. This is frequently used for outbound campaings. The idea is to add the concept of generic tag to calls, so that, if assigned to each calls, it could be used to create a new level of reporting, parallel to the queue. When each call is associated to a single tag, the queue would be the physical medium for handling calls, while the tag could bee freely set. Imagine, for example, to set up a special number for a Tv Ad, or a printed advertising, that makes it possible to discriminate where the caller saw the Ad. Tags are set by the system (i.e. there is no way for QueueMetrics to add a tag on a specific call but is up to the PBX/dialplan to add a tag signature in the queue log); for more information on that, please refer to this paragraph. Tags associated to a call will be shown by QueueMetrics and decoded following the tag list defined by the administration page, as reported below.
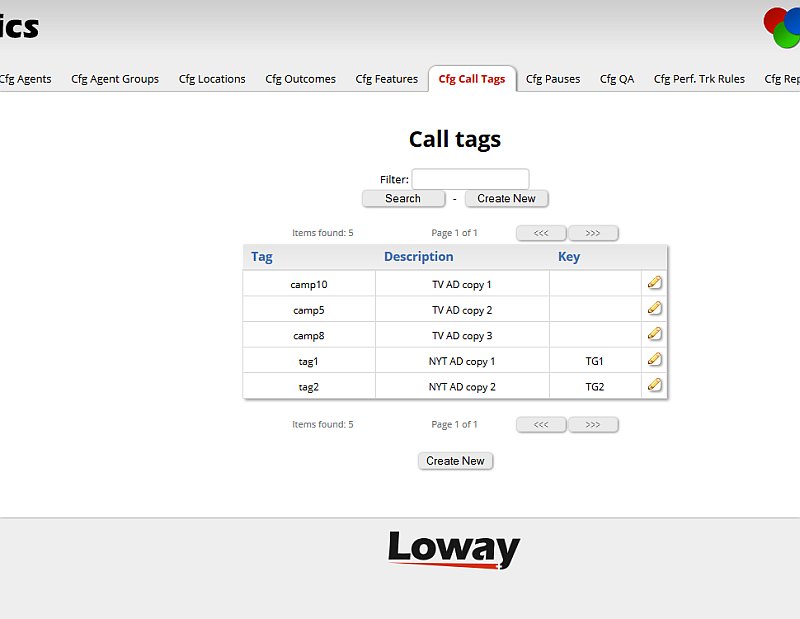
By clicking on Create New button or on the pencil icon present on each tag code row in the list, a user can create or edit an already present tag description.
Tags definition/listing is available only for users holding the USR_CALLTAG security key.
Configuring pause codes
The agent’s time is defined in QueueMetrics as made up of different activities. The main activity for an agent will be "Available time", i.e. the time when an agent is ready taking or placing calls. When an agent pauses out of "Available time", they may want to flag the reason for the pausing, e.g. doing backend activities, lunch, etc. This way you can track agent activities punctually. If they don’t flag a pause, it will be computed as simply "Pause" time.
Each pause code is written on the queue log while the pause in progress, i.e. after the agent goes on pause and before the agent stops that pause. The pause code will usually be defined by a numeric sequence that the agent will either key in on their telephone terminal or report through QueueMetrics itself through the Agent’s page. QueueMetrics will not consider how the sequence is entered, as long as it’s present in the queue_log data it runs on.
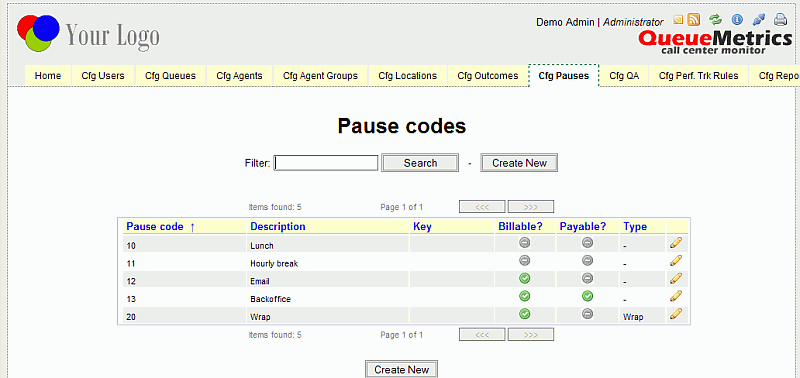
For each pause code, it is possible to tell QueueMetrics whether that time is:
-
billable or non-billable - whether the pause will be counted for client billing
-
payable or non-payable - whether the pause will be counted for payroll generation
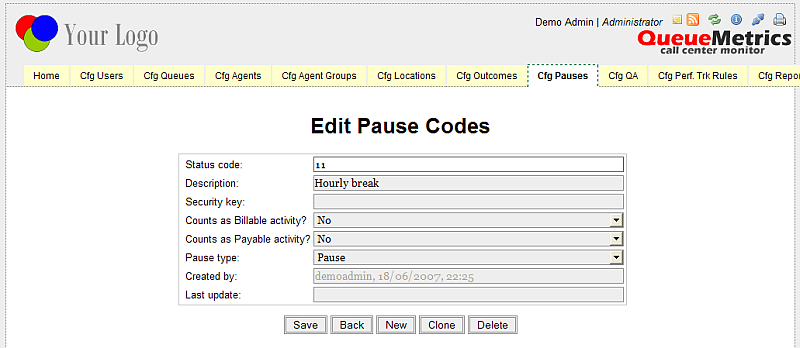
All activities are optional and may be added or deleted at will. The following fields apply:
-
A numeric code for that activity. The system will check that it will not be duplicated on the list (The code should be numeric so it may optionally be keyed-in using the rep’s terminal. This is not a technical requirement anyway)
-
A text label for the activity (e.g. "Lunch")
-
A flag telling the system whether that activity is: Billable or Not Billable
-
A flag telling the system whether that activity is: Payable or Not payable
-
A flag showing the type of pause. A pause can be a standard pause, or a pause of the ACD made to produce outbound calls, or a call wrap-up pause (As of QueueMetrics 1.7.0, this is partially implemented only in the AGAW sub system) or an administation type pause.
-
An optional security key for that activity. This will be used only when displaying activity choices in the Agent’s page. The reporting engine will report on all activities present in its analysis.
| pause status codes MUST be defined with no whitespaces. Apart from numbers, only lowercase letters and the following characters are also allowed: _-.@/()=?^ . QueueMetrics will automatically delete wrong characters, change uppercase characters to their lowercase equivalent and trim the whitespaces. |
Configuring agent groups
An agent group is an attribute that is applied to an agent in order to keep track of their life-cycle. This is used as a filtering criterion in QM and is developed in the QA monitoring subsystem.
The idea here is that you can have e.g. "New hires", "Regular agents", "Expert agents"; each agent group has a different icon, that is displayed throughout QM whenever the agent name is displayed.
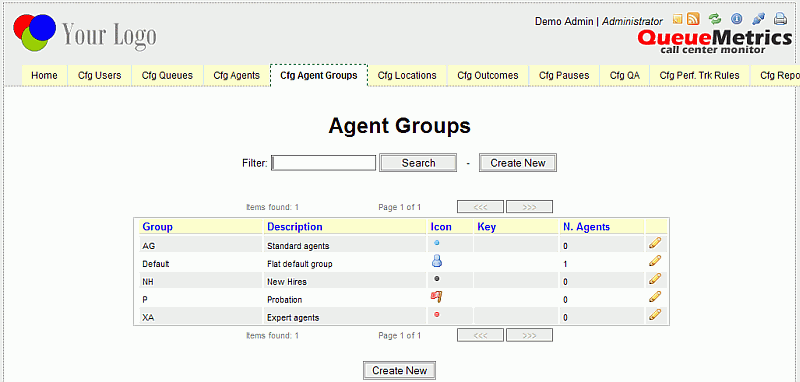
You can select different icons by clicking on them in the editor.
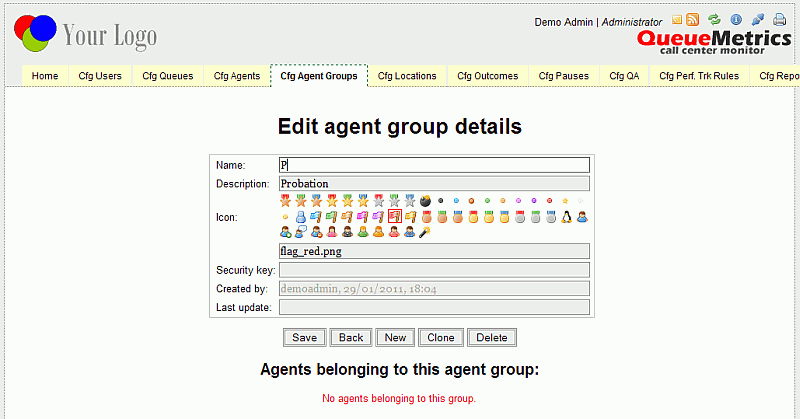
| you can add more icons that better suit your liking by uploading them to the '/img/agent_groups' folder in QueueMetrics. |
Configuring skills
Skills are attributes that can be associated to a call and can be used to implement somethig useful like skill based routing on Asterisk queues. QueueMetrics reports can be filtered by a set of specific skills through the custom report page. Skill codes can be associated to labels through the skill configuration page available to all users holding the USR_SKILLS security key.
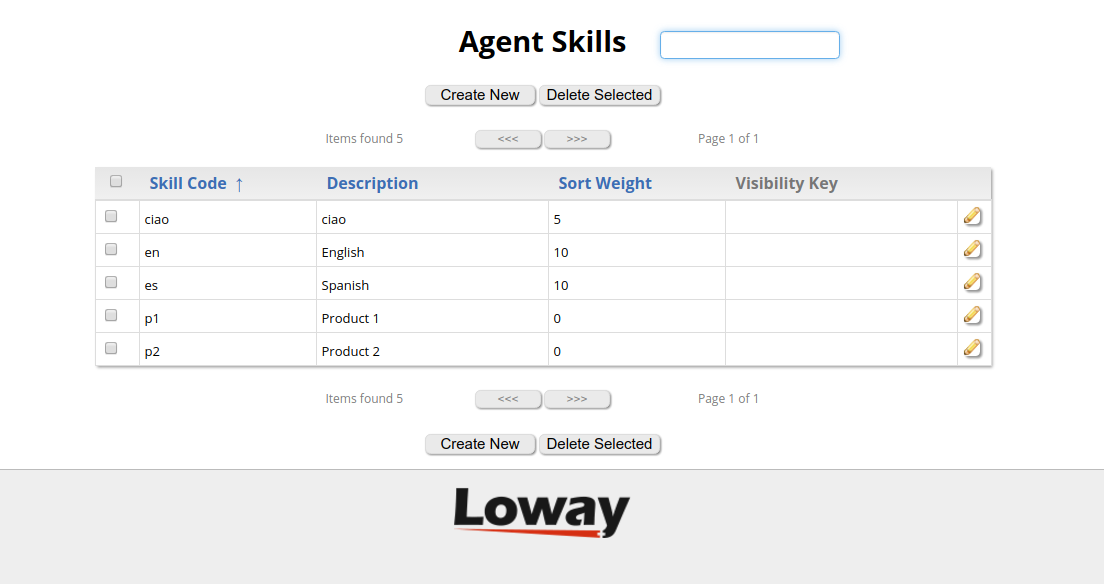
The list of available skills can be reached from the main page.
Clicking on the Create New button or the pencil icon on each skill reported in the table, is possible to create or edit a skill entry.
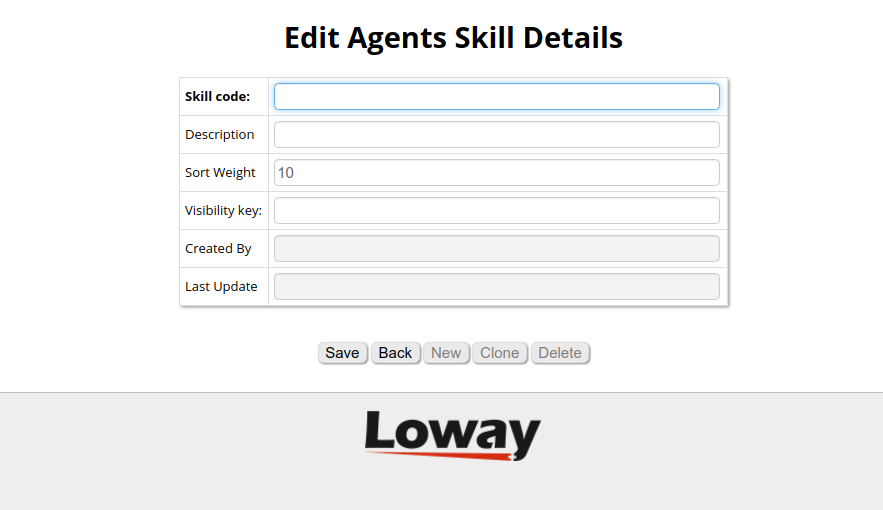
Apart from the skill code and the description for the skill that can be defined, a field named Sort Weight can be found. The weight field is used to define the order in which skills will be shown in report columns. Skills with a lower weight will always be placed before skills with a higher weight. If two skills have the same weight, they will be ordered based on the alphabetical order of their description.
The Visibility key field indicates that a user must possess the chosen key to use this particular skill.
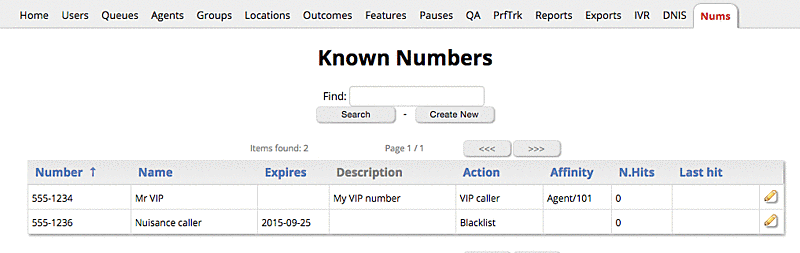
Configuring known numbers (VIP callers / blacklists)
Known numbers are phone numbers that are known to QueueMetrics and can have properties associated to them. They are meant to be used by the numberLookup API in order to implement strategies based on the calling number - see Using known numbers - and will be used to "improve" the display of said numbers as described in Displaying numbers.
At the moment, QueueMetrics will use "known numbers" to:
-
Earmark specific calls as BLACKLIST or VIP, where at the dialplan level a proper function is implemented to route thise numbers to specific high priority / low priority queues
-
Store a known description for the number that can be used to set a caller-id for the number in a format that will make the number "stand out". It coud be the name of a client, or their CRM IDs
-
Store a known agent affinity for the number, where at the dialplan level there is an attempt to route the call to a specific agent before queuing the number on a "general purpouse" queue
In order to access this page, users must hold the security key USR_KNUMBERS.
When editing a record, you see a form like the following one:
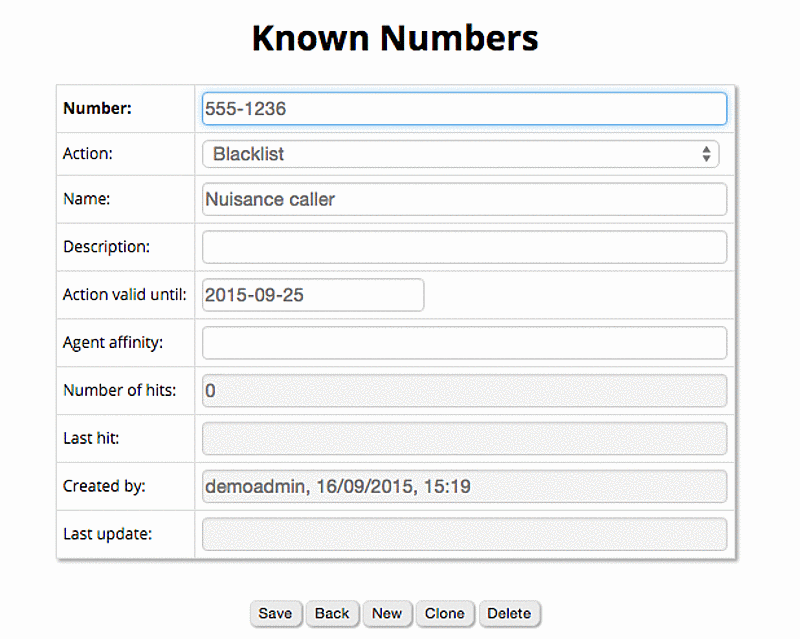
The editor will track:
-
A number. This can be input freely, es "(555) 555-5555", and will be internally normalized to the sequence of DTMF digits it uses.
-
A name. This will be used by the service "name"
-
An action, currently belonging to the set:
-
BLACKLIST
-
VIP
-
None (used in the case you just want affinity or name decoding)
-
-
A free text descripton
-
An agent id, to set the agent affinity for this number
-
A record expiry date. When the record is expired, all associated attributes are inactive (action, name and affinity). This does not affect number rewriting.
The editor will also display, in read-only mode:
-
The total number of hits that were received for this number. A hit is a successful lookup.
-
The time this number was last hit.
| Each number can only appear once (as per its normalized form) in the editor; attempts to have it listed multiple times will be rejected. |
Configuring QA forms
The set of current QA forms can be configured through the QA form editor. It shows the current set of defined forms and lets you performs the usual operations (search, filter, sorting, paged listing…).
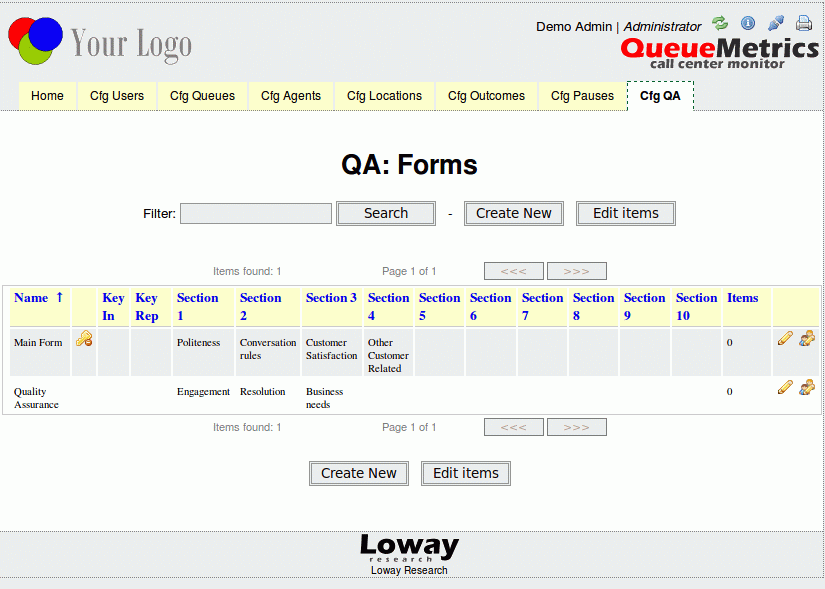
The names of each section and the number of items that have been input for that form are shown on the front page. If a form has any number of items input, it is considered "locked" and cannot be modified anymore, though you can create a different form with the same set of items.
The form editor looks like the following page:
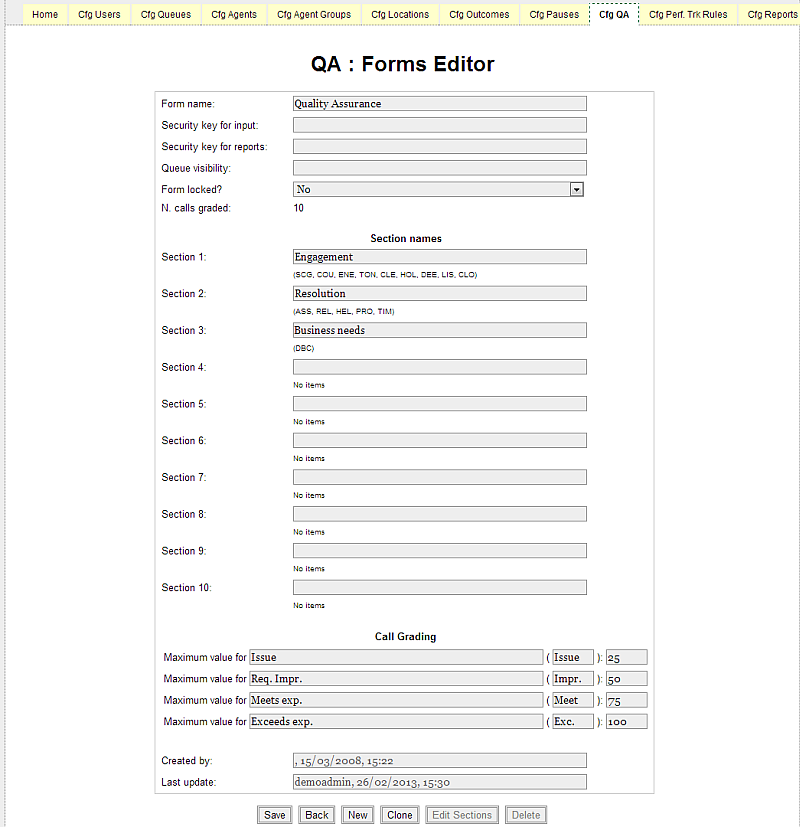
You can enter:
-
The form name
-
The security key required (in addition to the basic one) to grade calls using this form
-
The security key required (in addition to the basic one) to run reports on this form
-
Whether the form allows new input or not; the total number of calls graded using this form is shown
-
The names of the section. There can be up to five sections. Any section MUST have a name, and there must be at least one section.
-
The threshold values for Call grading (the maximum for "Exceeds expectations" is fixed at 100).
-
The labels associated to each level in the Call grading (defaults are "Issue", "Req.Impr.", "Meets exp.", "Exceeds exp."). Please note that a short label, used on the report pages, could be also defined (defaults are "Issue", "Impr.", "Meet", "Exc.").
-
A 'Queue visibility' list - you can list a set of atomic queues for which this form will be displayed. Queues are separated by whitespaces. The field accepts wildcards to match multiple queues and/or subqueues. If the field is left blank, then the form is displayed for all queues.
To edit the set of items that belong to a form, you should have no data reported for that
form. If you have no data, the item editor icon  will show
from the main form page.
will show
from the main form page.
The editor looks like the following page:
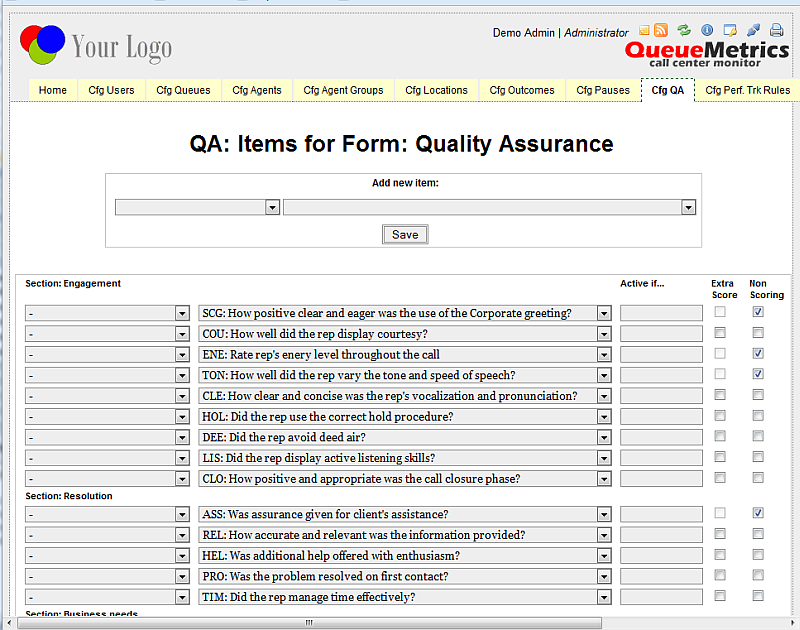
To add a new element, just select an element on the top form and a section it should be added to.
On the main part of the page, you can edit the elements by changing them, moving them up or down and removing them.
The "Active if…" field allows to enter a dependent rule, as described within the following chapter: "Handling dependent questions".
The Extra Score checkbox allows to give extra scoring to a particular question, in order to highlight an agent’s higher performance within a specific section, or to balance his/her averages. The question in the form will have two main characteristics: it can have a score above the 100 standard value (up to a maximum of 120) and the score assigned to the question will not be calculated within the denominator part, when totalling averages for the specific section and the overall QA form.
The "Non Scoring" checkbox, if checked, forces the engine to ignore the inserted question score when calculating the section and form average. Questions flagged as "Non Scoring" are not classified as "under or over performing items" in the QA form. Non scoring questions are aggregated on reports based on the number of times a particular score is found in the query period.
| When only one extra score question is within a section, the average will show as zero, given that within the denominator there are no values, but it is null. |
Handling dependent questions
Since QueueMetrics 1.7.0, it is possible to have Dependent Questions, i.e. questions that are enabled or disabled according to values input in a different question.
In order to enable this, a new input area is defined on the right side of each item. Here the administrator can insert a rule that associated the question to a particular parent question. There are several restrictions in the rule definitions:
-
A rule should be defined with the sequence LABEL, OPERATOR and VALUE where:
-
LABEL is the short code associated to each item in the section
-
OPERATOR is a mathematical operator in the subset: <, >, ⇐, >=, ==, !=
-
VALUE is a numerical value in the interval 0 (included) to 100 (included)
-
-
A rule cannot be composed by other rules
When the administrator saves the form, the server will parse each inserted rule and, if an invlalid rule is be found, an exception is raised specifying the first incorrect rule found. The administrator must then modify the wrong rule before submitting the form definition again.
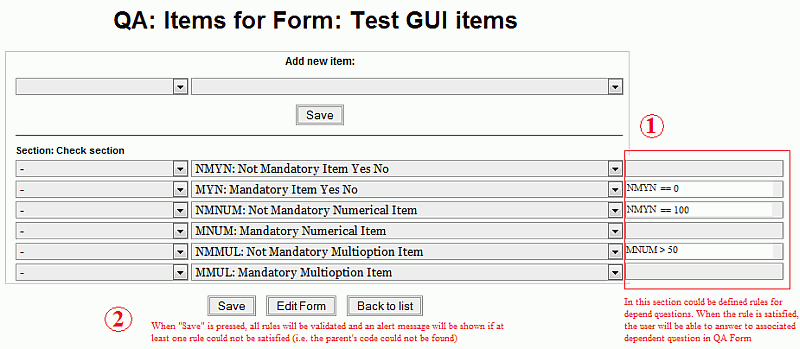
For example, a few rules are defined in the picture above:
-
The item NMYN is parent of two items: MYN and NMNUM. The MYN item is enabled only if the value inserted is equal to 0; the NMNUM item is enabled only if the value associated to the NMYN question is equal to 100.
-
The item NMMUL is related to the itemMNUM. This question is enabled only if the score given to the MNUM item is greater then 50.
-
The question MMUL is a normal question and is always enabled.
A couple of rules govern the way values for dependent question are handled when the question is disabled:
-
Dependent questions, when saved, receive a "N/A" value, so they behave like non-madatory items when you check the "N/A" box. The value will be counted in the grading report statistics following the same rule.
-
The "N/A" value works with the same rule even if the dependent question is a shortcut one: if it is disabled it is not considered a shortcut.
Configuring QA items
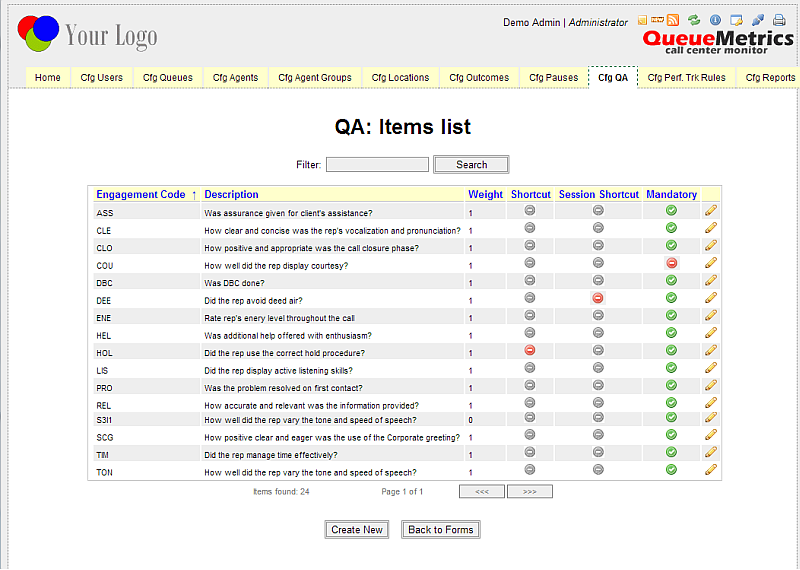
The set of items that are selectable as members of a form can be configured by the user by clicking on the "Edit items" button at the bottom of the QA forms editor.
New items can be added and the description can be edited if needed.
The weight of an item is the number of times that an item must be counted in comparison to other items. All form level scores consider the item’s weight.
| If you average an item with a score of 50 and one with a score of 100, each weighting one item, you have an average of (50+100)/2 = 75. If you average an item with score 50 and weight 2 and one with score 100 and weight one, you get ((50 + 50)+100)/3 = 66! |
A shortcut item is an item that, if failed, will fail the entire form. They are marked with a red icon when present.
| If a shortcut item fails, the whole form will have an overall score of zero, no matter what other scores are. While averages at the form level are affected by shortcuts, averages at the item level are not affected. |
A session shortcut item is an item that, if failed, will fail the entire section. They are marked with a red icon when present.
| If a session shortcut item fails, the whole section will have an overall score of zero, no matter what other scores are. |
A mandatory field requires you to select a valid value; if it is not checked, the user can optionally leave those items blank. Mandatory fields are marked with a green icon.
Different kinds of input can be accepted by the item - see below.
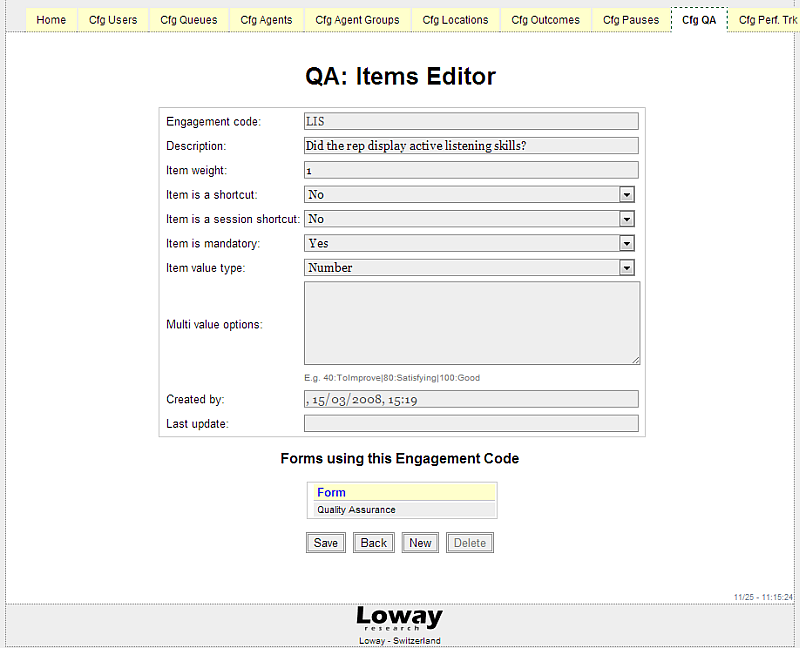
The Engagement code cannot be modified once input, and there can be no two items with the same engagement code.
Items cannot be deleted if they are in use by at least one form. You can see the set of forms that are using the chosen it at the bottom of the editor’s page.
Item value type: Numeric
A numeric value type must be an integer number between 0 and 100, extremes included.
Item value type: Combo
This lets you create a drop-down selector, asscociating each entry with a given value.
You enter the list of values in "Multi value format" text box, with the format:
40:ToImprove|80:Satisfying|100:Good
Each option is made up of a numeric value plus the colon symbol ":" plus the text to be displayed. Multiple options are separated by the pipe "|" character.
Defining agent performance rules
As explained above, in order to track performance you first have to express a set of business targets that express what is expected from your agents and how much deviations from each rule are comparatively worth, expressed in review points. This is called a ruleset.
This can be done through the proper configuration page by users holding the key "QA_PERF_RULES"; they will see a new link from the home page:
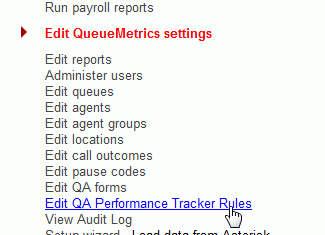
Selecting the link, a new page is shown listing rulesets already defined. In order to define a new ruleset, you press the "Create New" button.
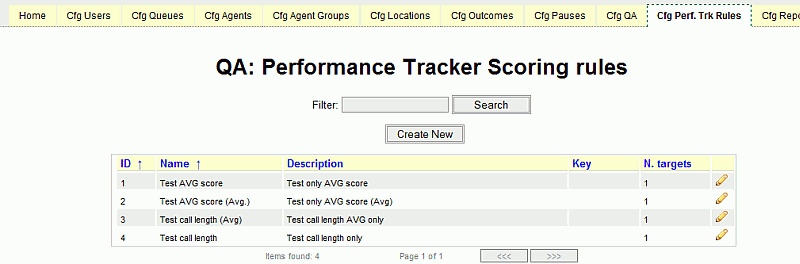
The "Create New" button opens a new page where an empty rule is shown, like in the picture below.
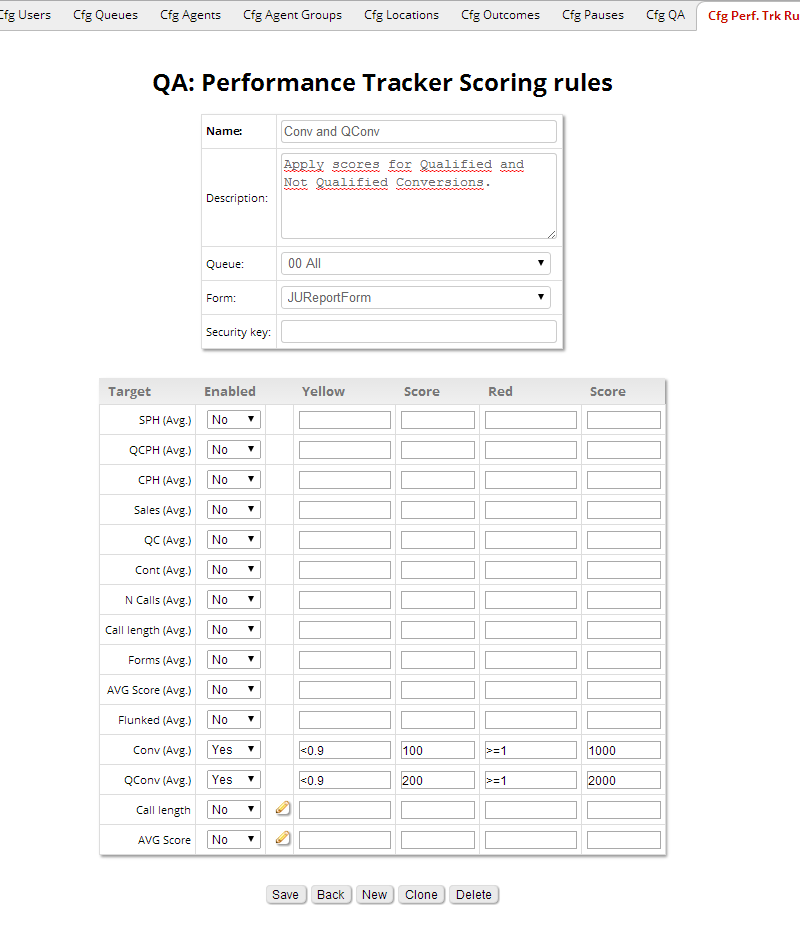
| Targets will not be displayed until you first save the ruleset. |
The creator should assign to the new ruleset a name, a short description, and optionally a security key.
A rule is usually linked to a specific queue (or set of queues) and form. This is because we expect to have homogeneous statistic distributions in the same queue and form items. This might not be true outside a specific form and/or queue. The user should select a specific queue and form before pressing "Save".
Available targets
When editing a ruleset, you see it is actually built out of a number of targets. It is important to understand that there are basically two different kinds of targets:
-
"Aggregated" targets - identified by AVG - that are computed once per agent, and
-
"Atomic" targets that are computed for each call handled by the agent
When computing the review score for an agent, first each call is checked against atomic targets and a first score is computed, then averages for the dataset are taken, and they are computed against aggregated targets and an aggregate score is computed; the final score is the sum of both scores.
| You can use either type of target, or both as once, as you best see fit. Try and run some tests to make yourself familiar with the ruleset. |
| It is important to note that some targets are not available as atomic targets. Examples are the QCPH, Sales, Number of calls, (Qualified) Conversion etc. that are obviously associated to a set of calls and make no sense in relation to a single call. |
Setting targets
For each possible target within the rule set, you can:
-
Enable or Disable a specific target rule
-
Insert an algebraic expression defining the rule for the "yellow" theshold
-
Specify a score that the engine will assign to the target when matching the "yellow" expression
-
Insert an algebraic expression defining the rule for the "red" level
-
Specify a score that the engine will assign to the target when matching the "red" expression
The algebraic expressions that can be used to define a threshold are:
-
simple mathematical expressions formed by an operator (in the set of "<", ">", "⇐", ">=") and a value.
-
X << Y: defines the internal interval between the values X and Y (excluded)
-
X ⇐⇐ Y: defines the internal interval between the values X and Y (included)
-
X >> Y: defines the external interval outside the values X and Y (excluded)
-
X >⇒= Y: defines the external interval outside the values X and Y (included)
Valid examples are:
-
"< 10" is triggered by a number lower than 10
-
">= 40" is triggered by a number greater or equalling 40
-
"40 << 80" is triggered by a number between 40 and 80
For not-averaged rules the user can access a wizard that simplifies definition of interval-based rules.
Dataset-based agent performance wizard
A rule set can be inferred from the measured properties of a given data set; this basically lets you express differences in terms of a percentage of outliers expressed on the total number of calls.
In order to access the wizard, you click on the "pencil" icon:
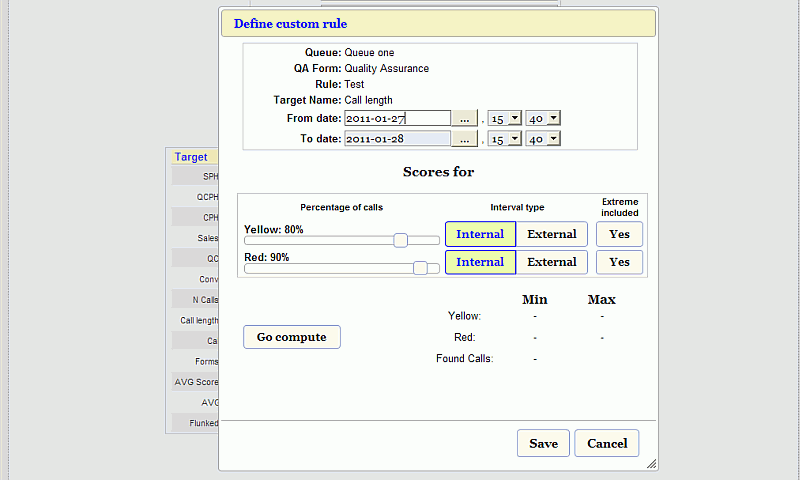
In this modal dialog you define a start and end time period and the "yellow" and "red" percentage of calls the user wants to include in the resulting rule, the type of interval (internal or external) and whether the interval extreme values should be included or not in the resulting rule.
| Imagine you want to consider "yellow" the 10% of calls that are too long or too short and red the 5% of calls that are way too long or way too short in relation to the average length. You would set the "yellow" slider to "90% external" (meaning you want the external tails) and the "red" slider to "98% external". |
The "Go compute" button runs an internal analysis that reports, in the lower right table present in the dialog, the minimum and maximum values representing the interval fulfilling the inserted parameters and the number of calls analyzed. You can repeat the calculation until satisfied, then press "Save" to insert the rule in the rule-set or press "Cancel" to forget it.
Configuring Custom DataBlocks
Users holding the key USR_CUSTOMBLOCKS_EDIT can edit the list of Custom DataBlocks.
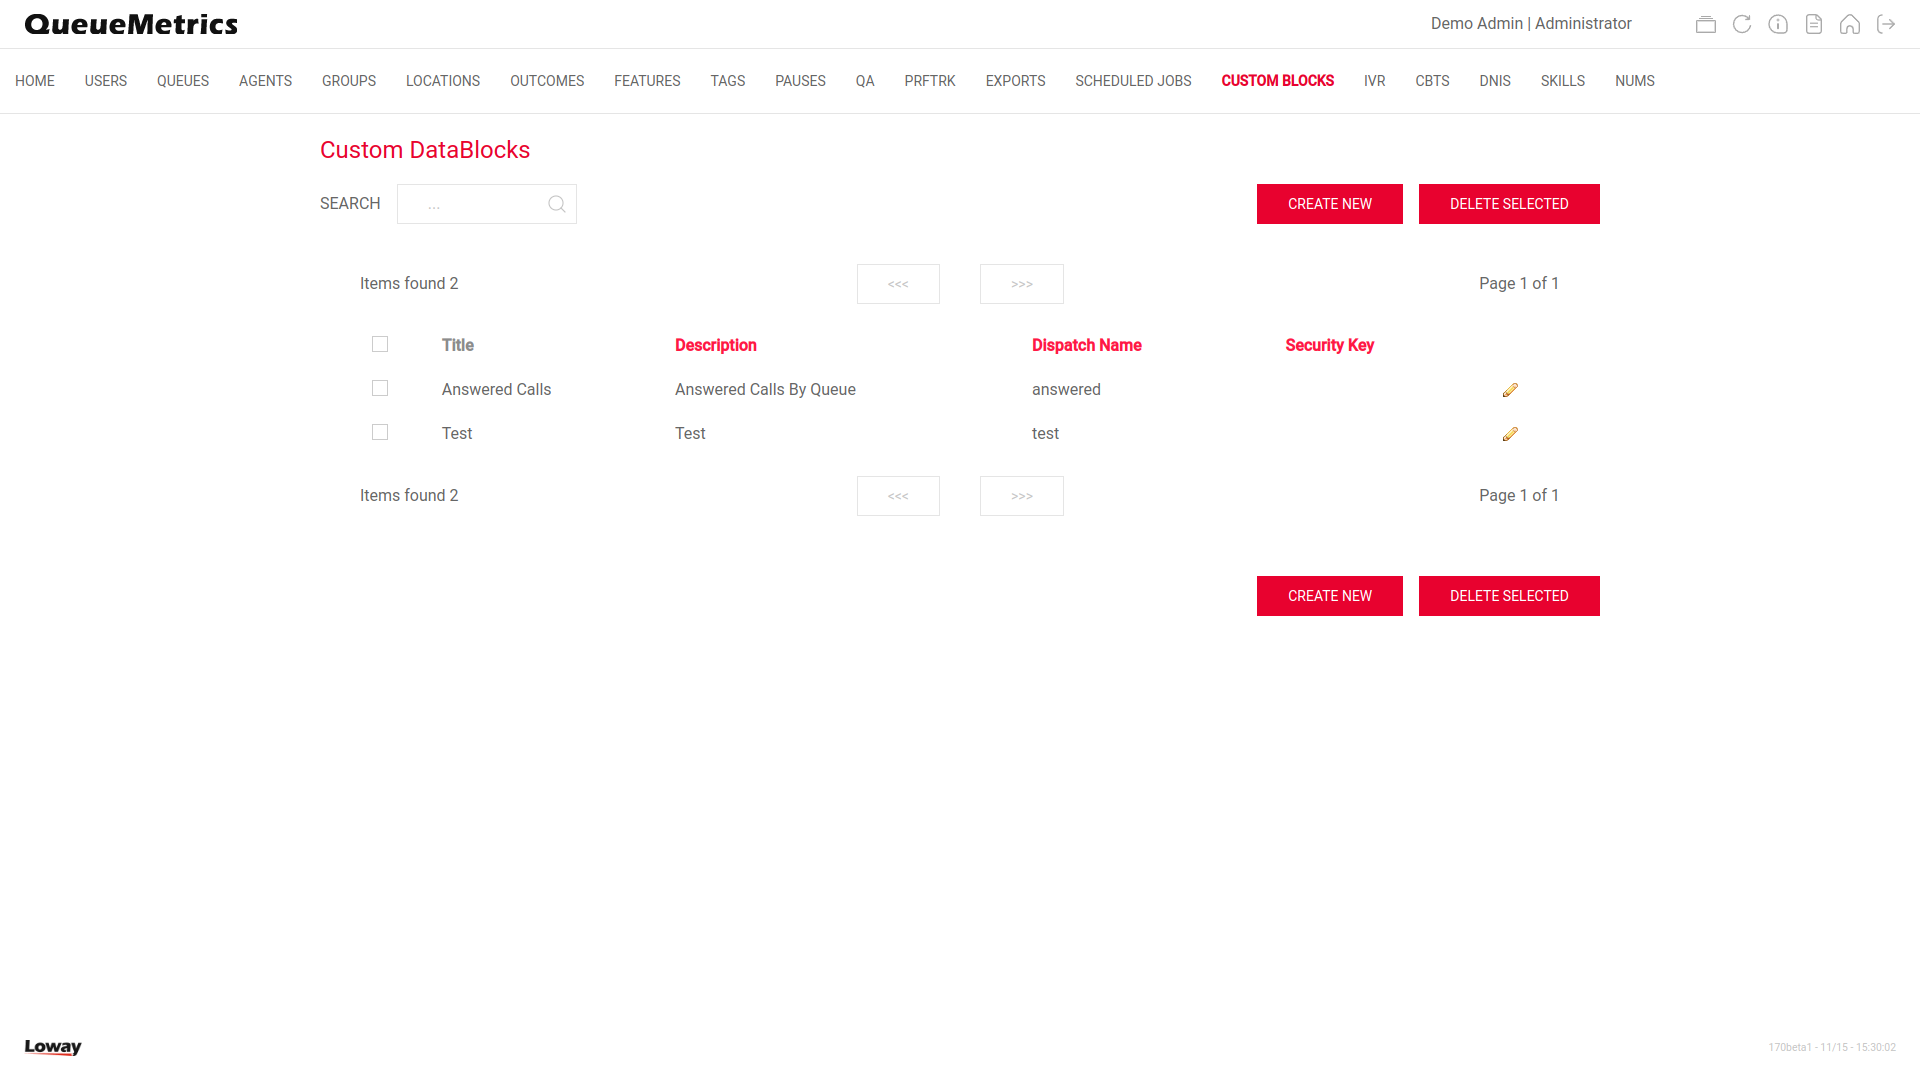
Since Version 22.11, QueueMetrics allows the user to create their own Custom DataBlocks, by specifying a source and a list of columns to show.
Custom DataBlocks are filtered views of existing DataBlocks. For this reason, these DataBlocks need to be based on an existing DataBlock (including another Custom DataBlock).
When creating a new Custom DataBlock, the user needs to input the following options:
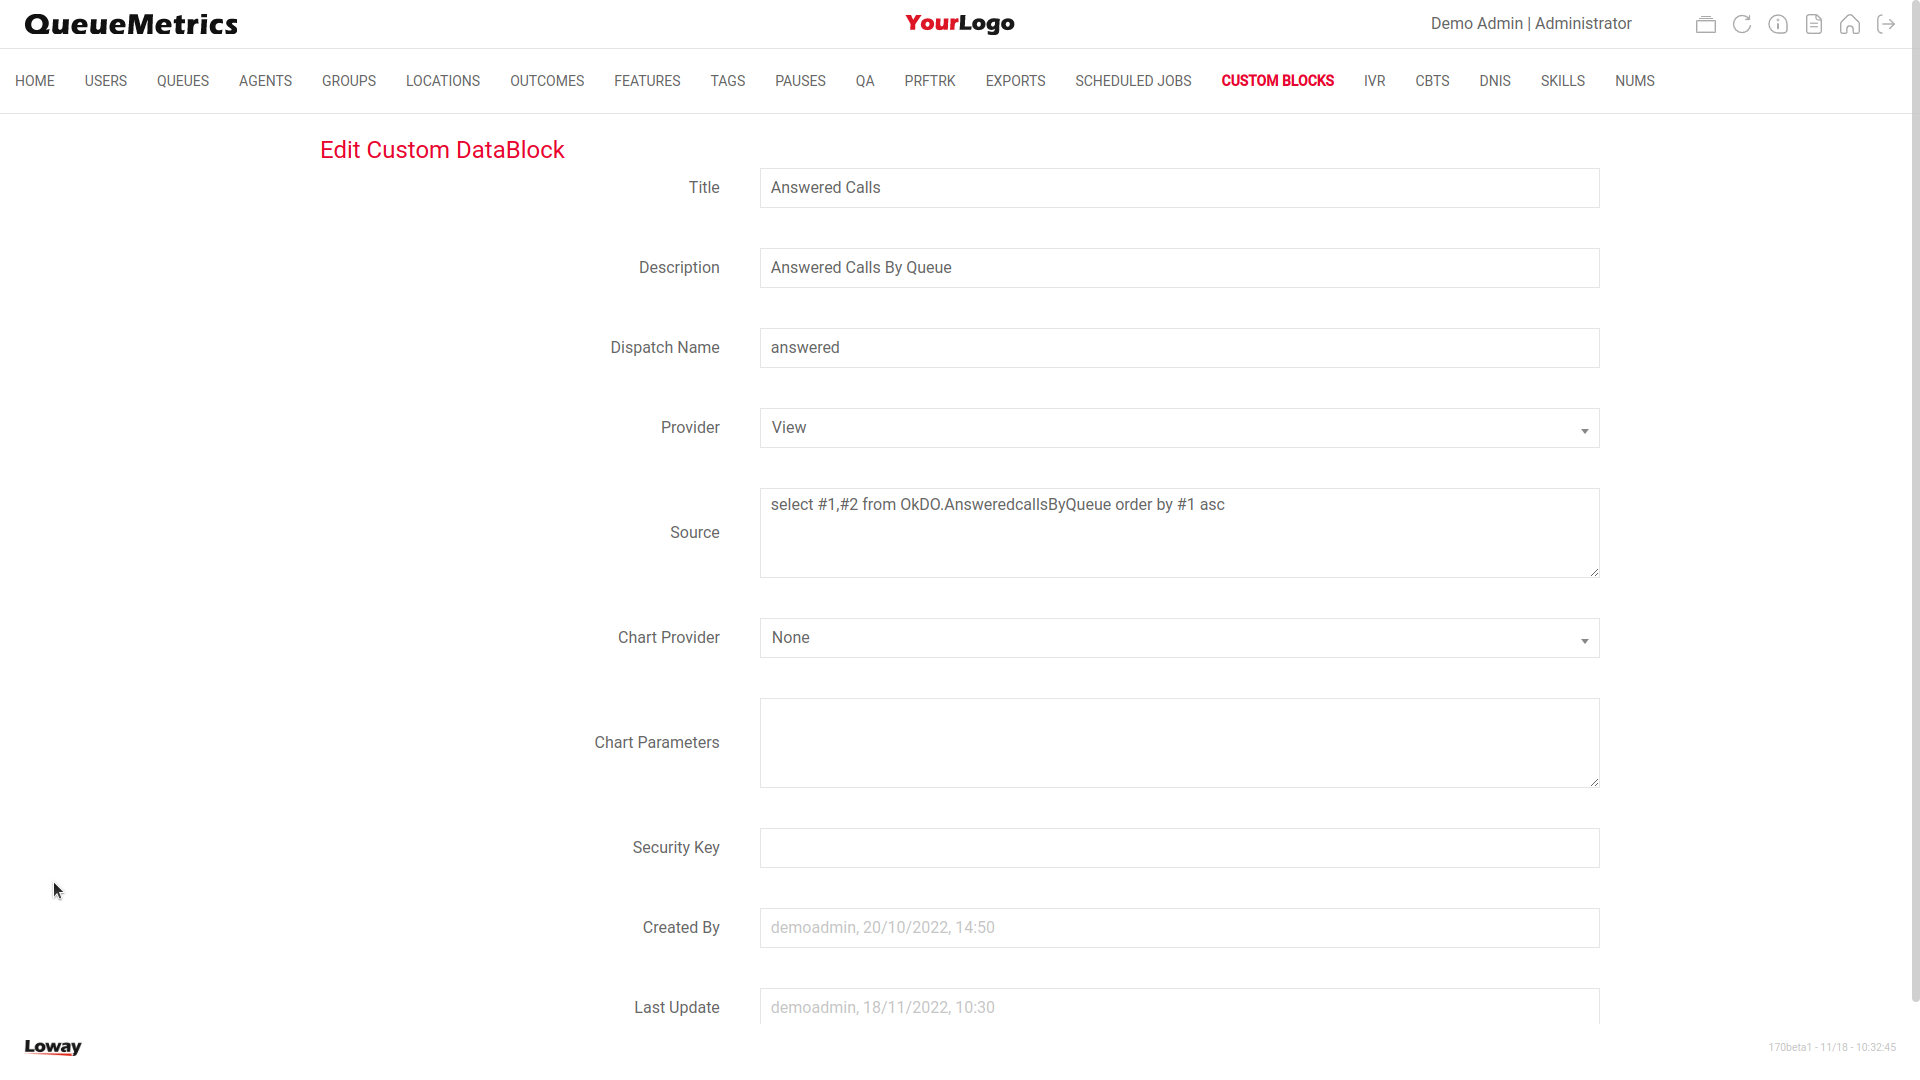
-
Title
-
Description
-
Dispatch Name: This will be the actual name of the DataBlock. Has to be unique.
-
Provider: Type of DataBlock. Only View can be selected as of QM 22.11.
-
Source: The source code of the DataBlock (More info below).
-
Chart Provider: The type of Chart, if any. Only React is available as of QM 22.11.
-
Chart Parameters: More information below.
-
Security Key: The security key for the block, in case access needs to be restricted to some users.
DataBlock Source Code
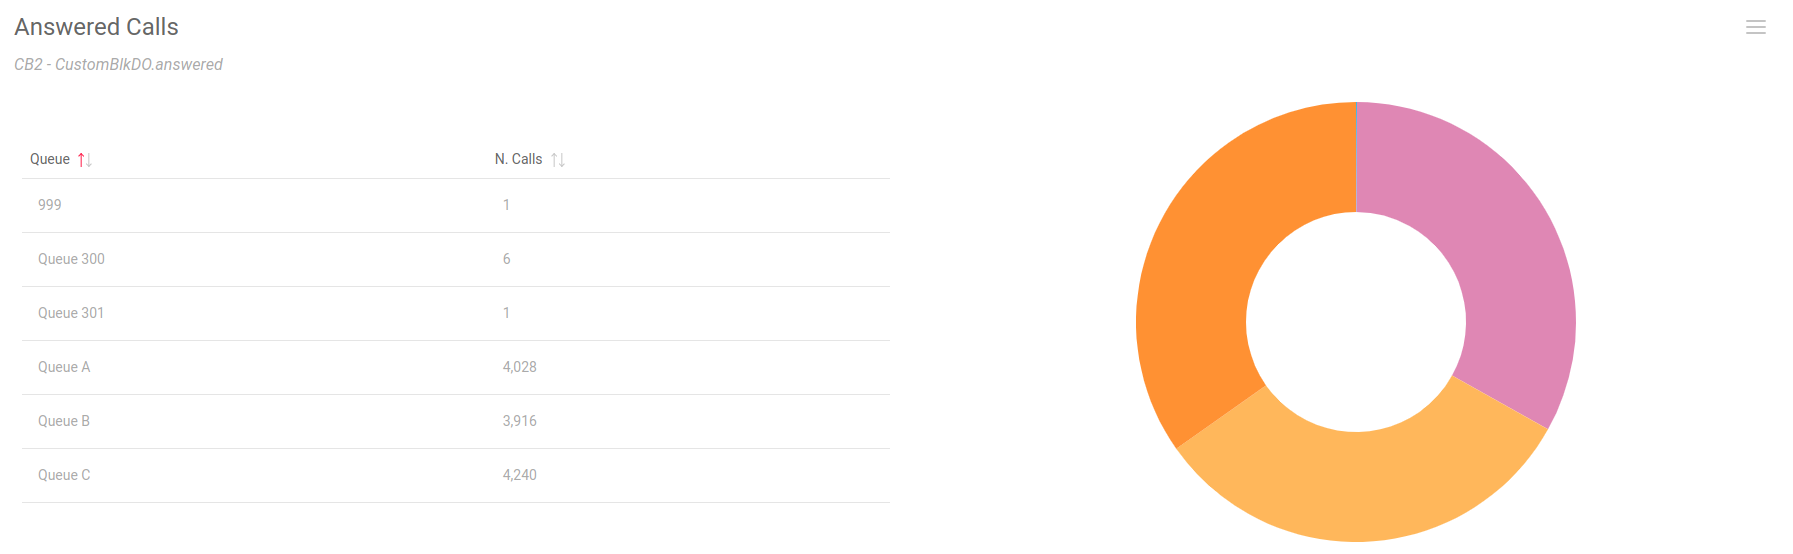
A Custom DataBlock’s source code is the formal definition of said custom DataBlock. By defining a Custom DataBlock, you can create a view of another existing customblock, by specifying the origin DataBlock and the colums you want to pick from that DataBlock. You can also specify an order (ascendant or descendant) for a specific field.
A well formed DataBlock is defined as such:
select {COLUMNS} from {DATABLOCK} order by {COLUMN} {DIRECTION}
so, for example:
select #1,#2 from OkDO.AnsweredcallsByQueue order by #1 asc
Will generate a DataBlock like this one:
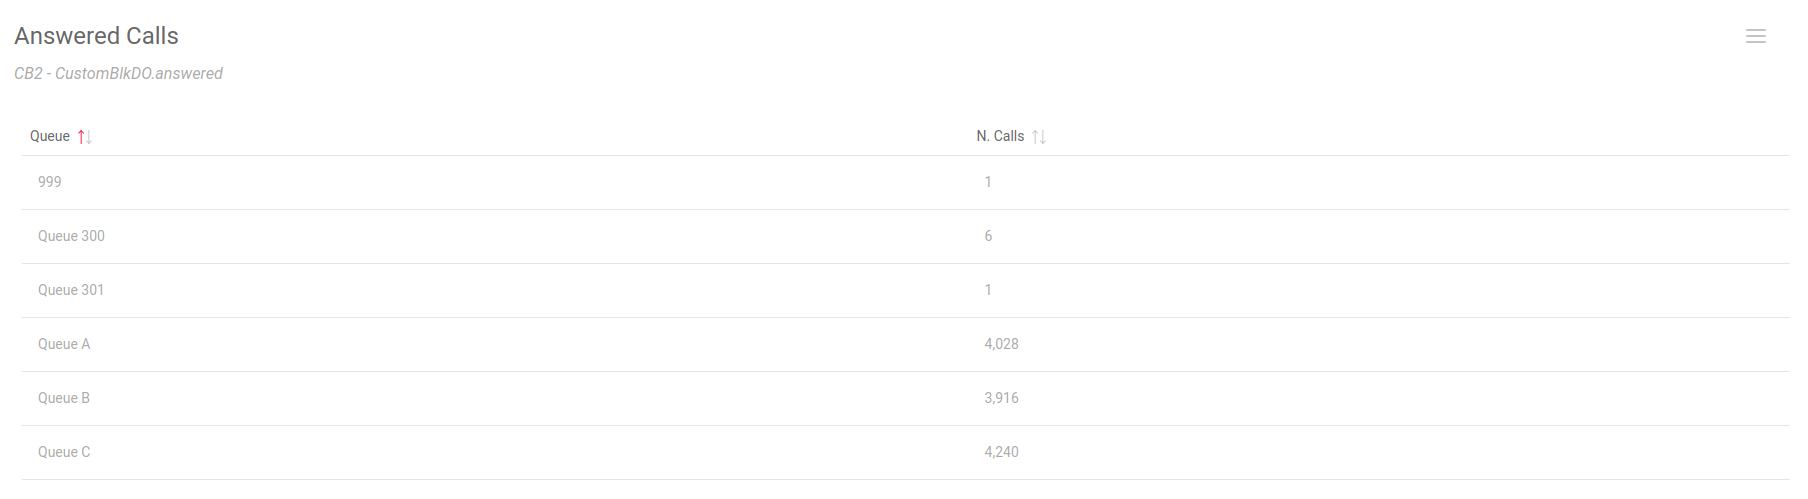
Where only Column #1 and Column #2 of the original DataBlock are visible, sorted by field #1 in a ascending order.
The sorting part of the source can be omitted, but the select and from clauses are mandatory.
select {COLUMNS} from {DATABLOCK}
is a perfectly valid DataBlock.
select #1,#2 from OkDO.AnsweredcallsByQueue
If you want to select all the columns of the original DataBlock, you can use the following syntax:
select * from OkDO.AnsweredcallsByQueue
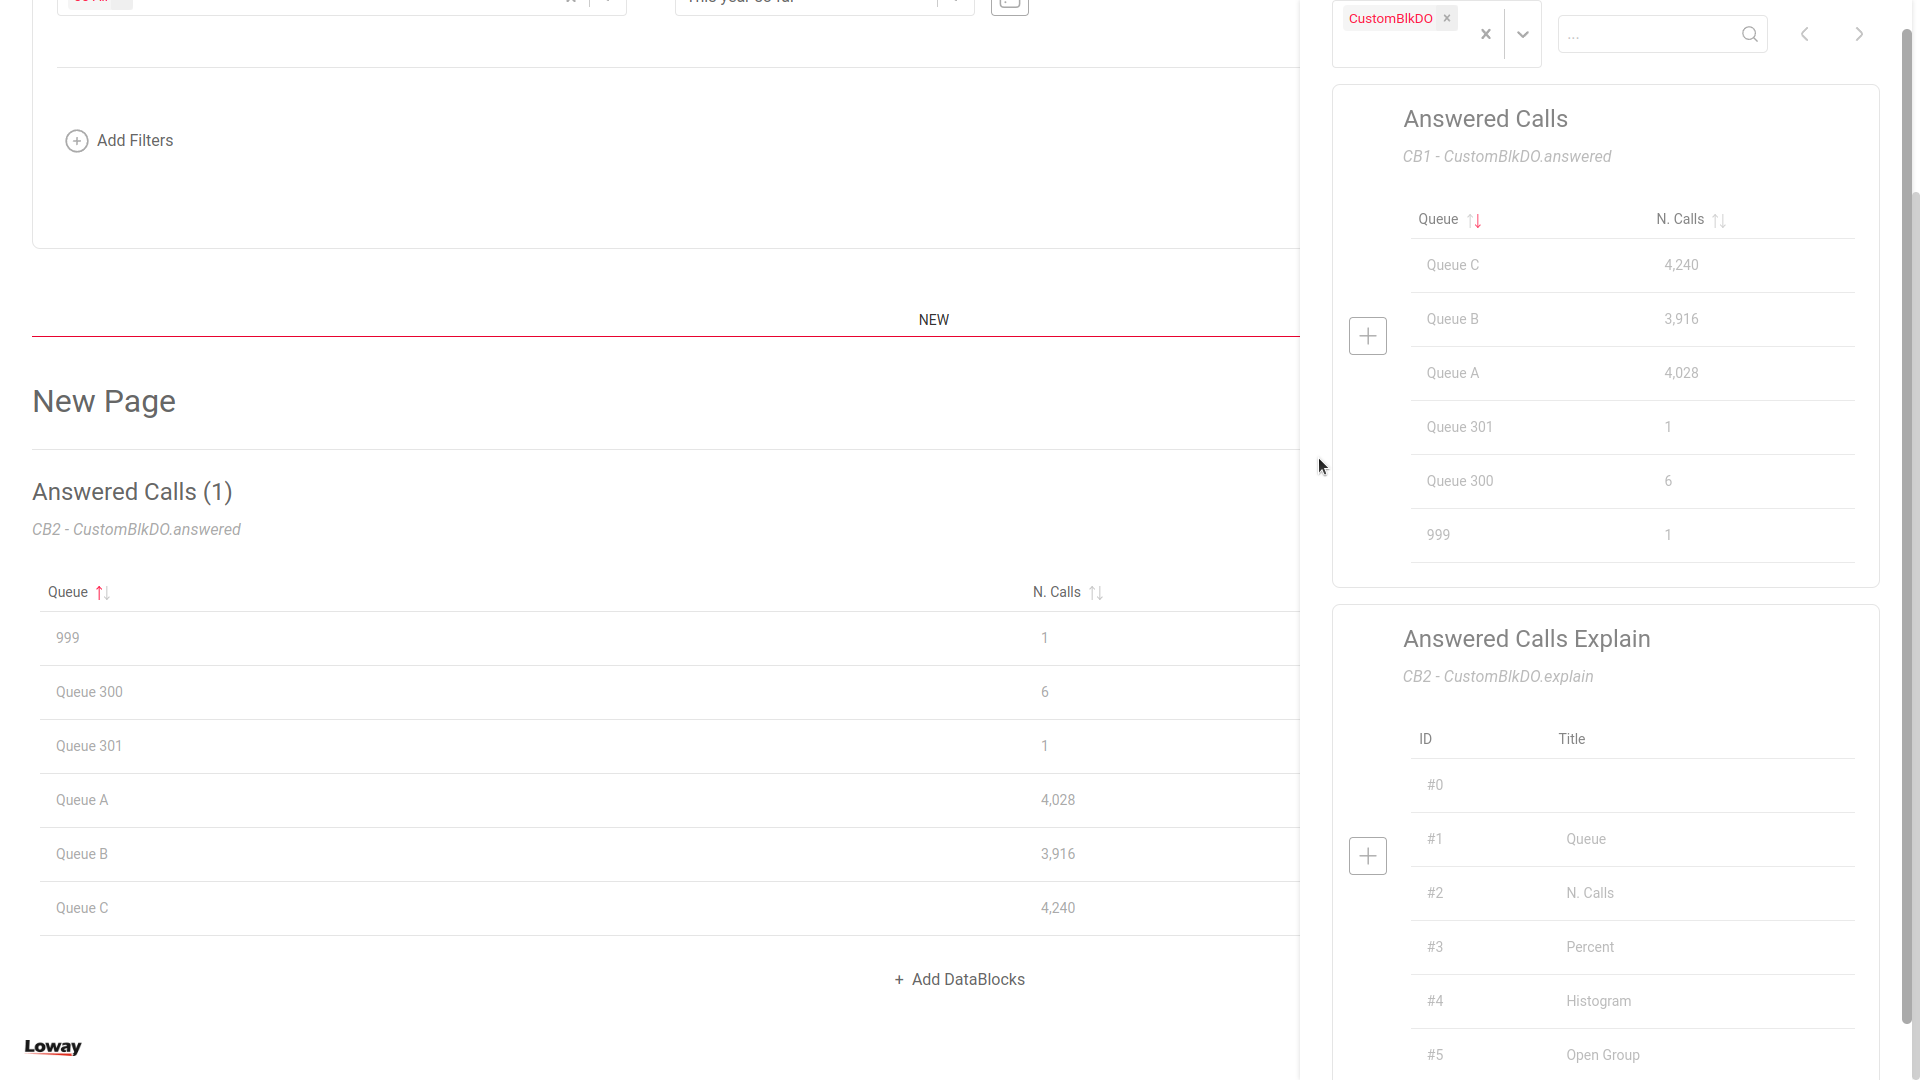
Adding Custom DataBlocks to a report
To add Custom DataBlocks to a report, you need to look for them in the DataBlock Selector in QueueMetrics' Report Page. You can access the DataBlock Selector by clicking on the "Add Datablock" button at the end of every page, or from the Reports' Page command menu
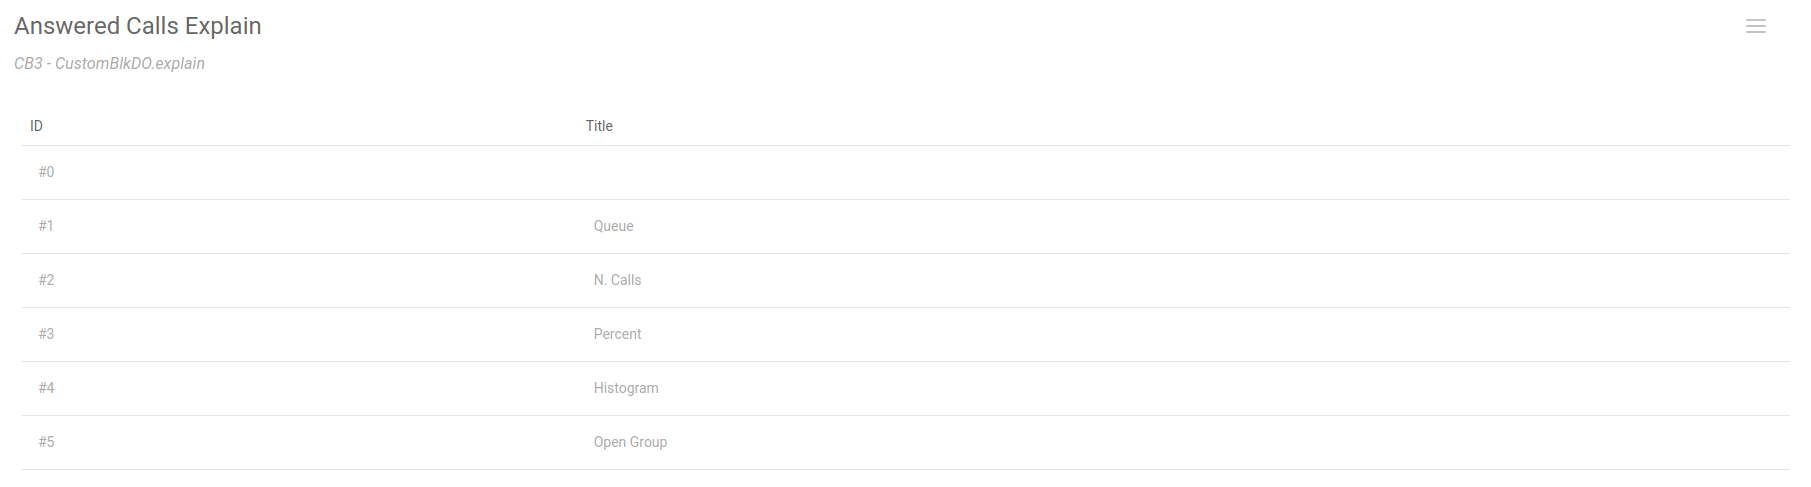
Explain DataBlocks
Since not all DataBlocks will have columns with ID #1 and #2, to create a view of an existing DataBlock it’s usually better to create an "Explain" DataBlock for the DataBlock we want to create a view of.
An Explain DataBlock is a DataBlock that, when added to a report, will show the name and ID of the various columns of a DataBlock, so that the user can see the IDs of the columns to use in the Select clause of a Custom DataBlock’s source.
The syntax to define a Custom DataBlock is as follows:
explain * from {DATABLOCK}
for example:
explain * from OkDO.AnsweredcallsByQueue
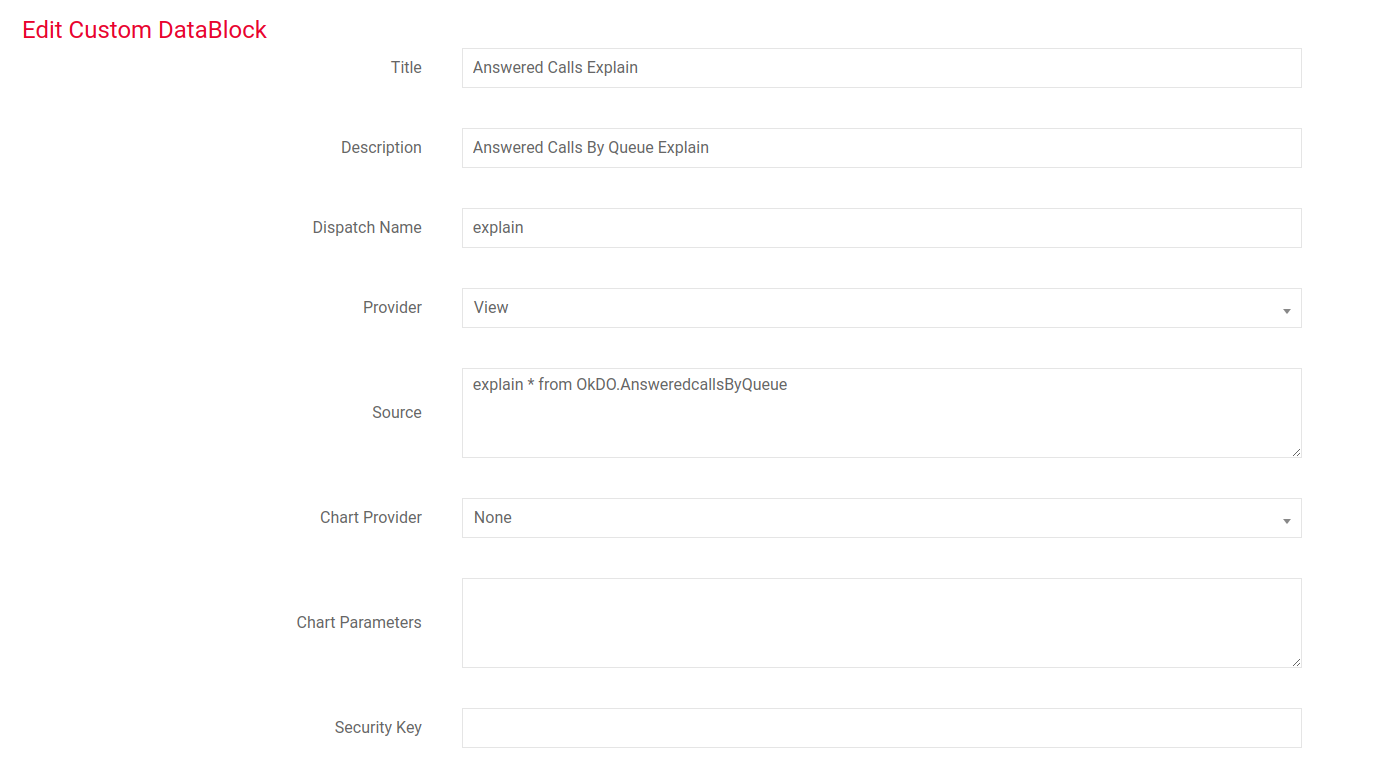
will yield the following result.
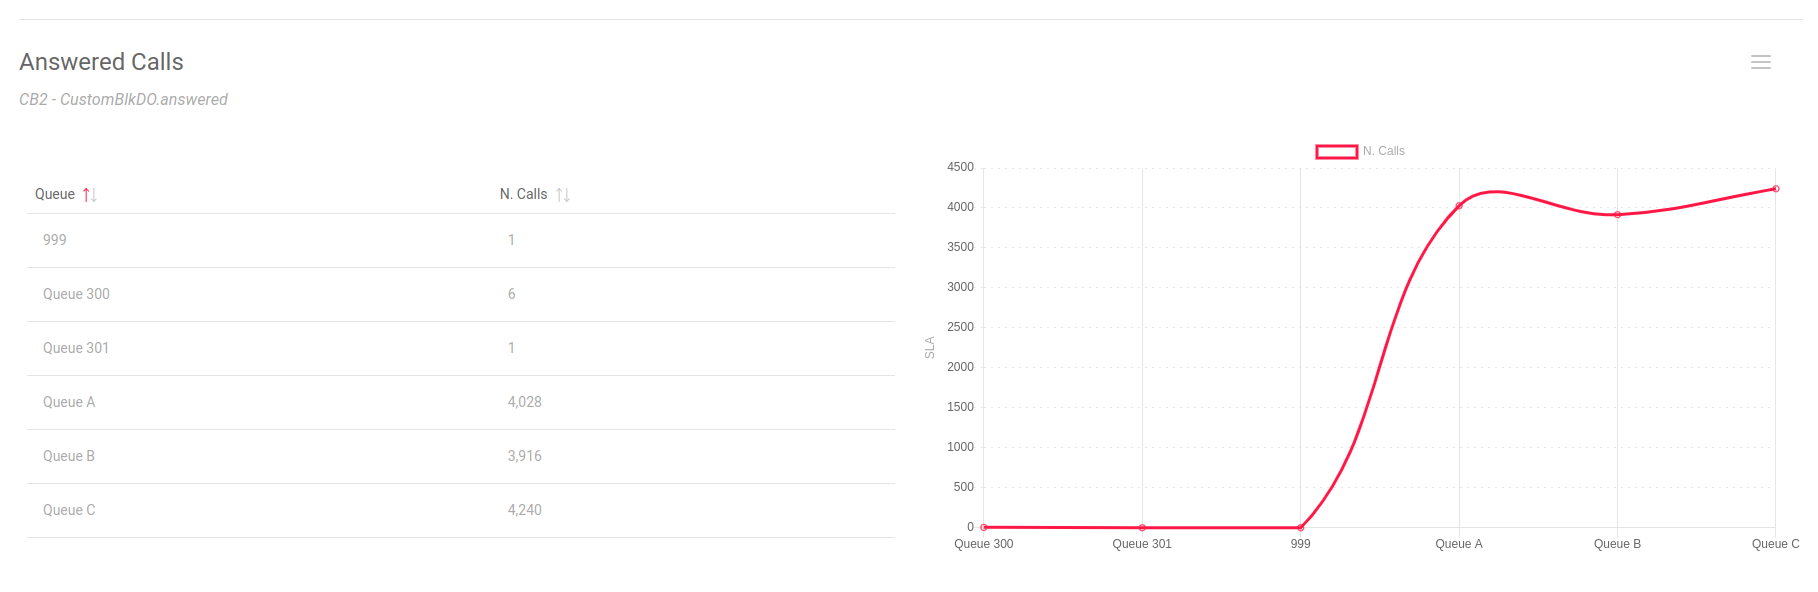
Custom DataBlocks Charts
Custom DataBlocks offer the ability to define customizable charts to go with them.
When defining a custom DataBlock, the user can select "React" as a Chart Provider, and set the parameters for the chart.
The chart parameters are built as follows:
-
CHART: Type of chart. Can be PIE, BAR, LINE, RADAR.
-
DATATYPE:_Type of data. Can be NUMBER, DATA or TIME.
-
XCOLUMN: The column that will be used as the X Axis
-
YCOlUMN: The column that will be used as the Y Axis
| Data type NUMBER is to be used when the Y Column is comprised of numerical values. DATA will take the values as they are, while TIME is to be used if the values are durations in the format 00:23. |
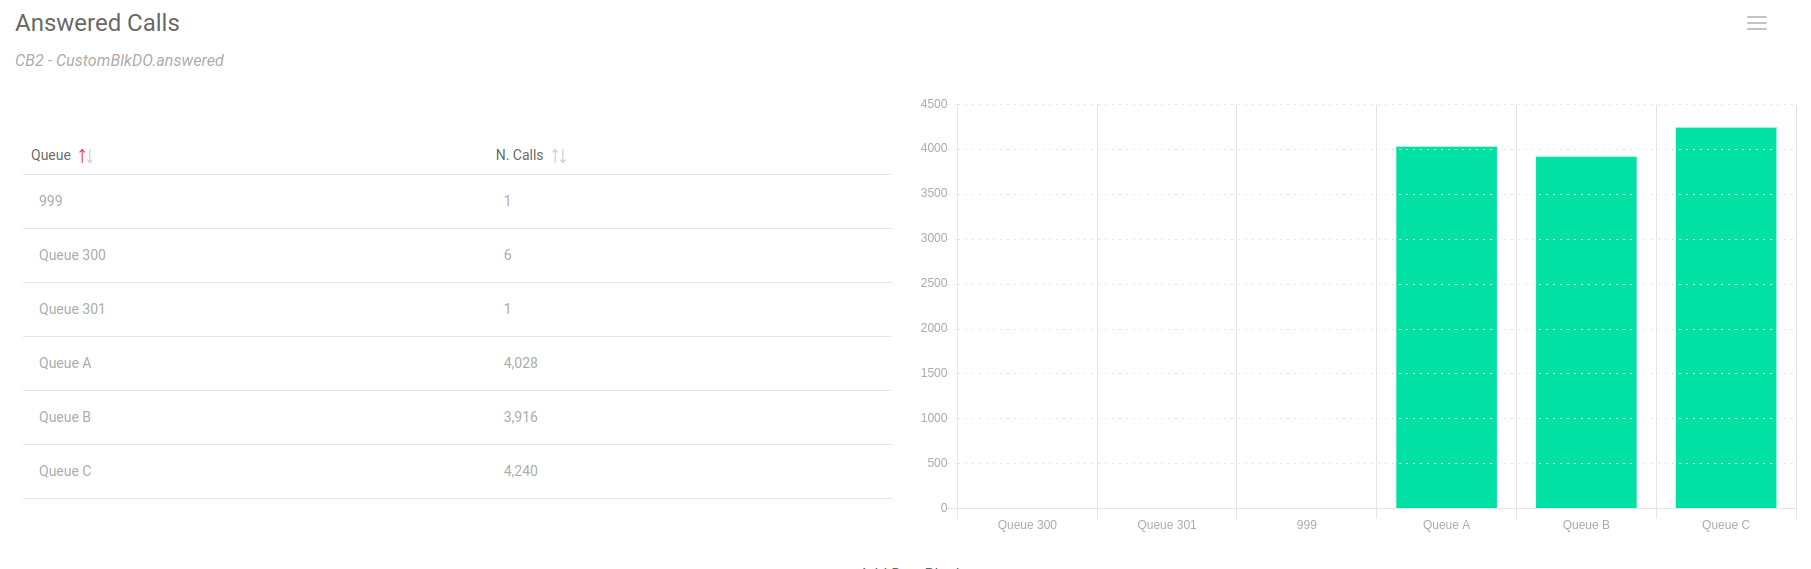
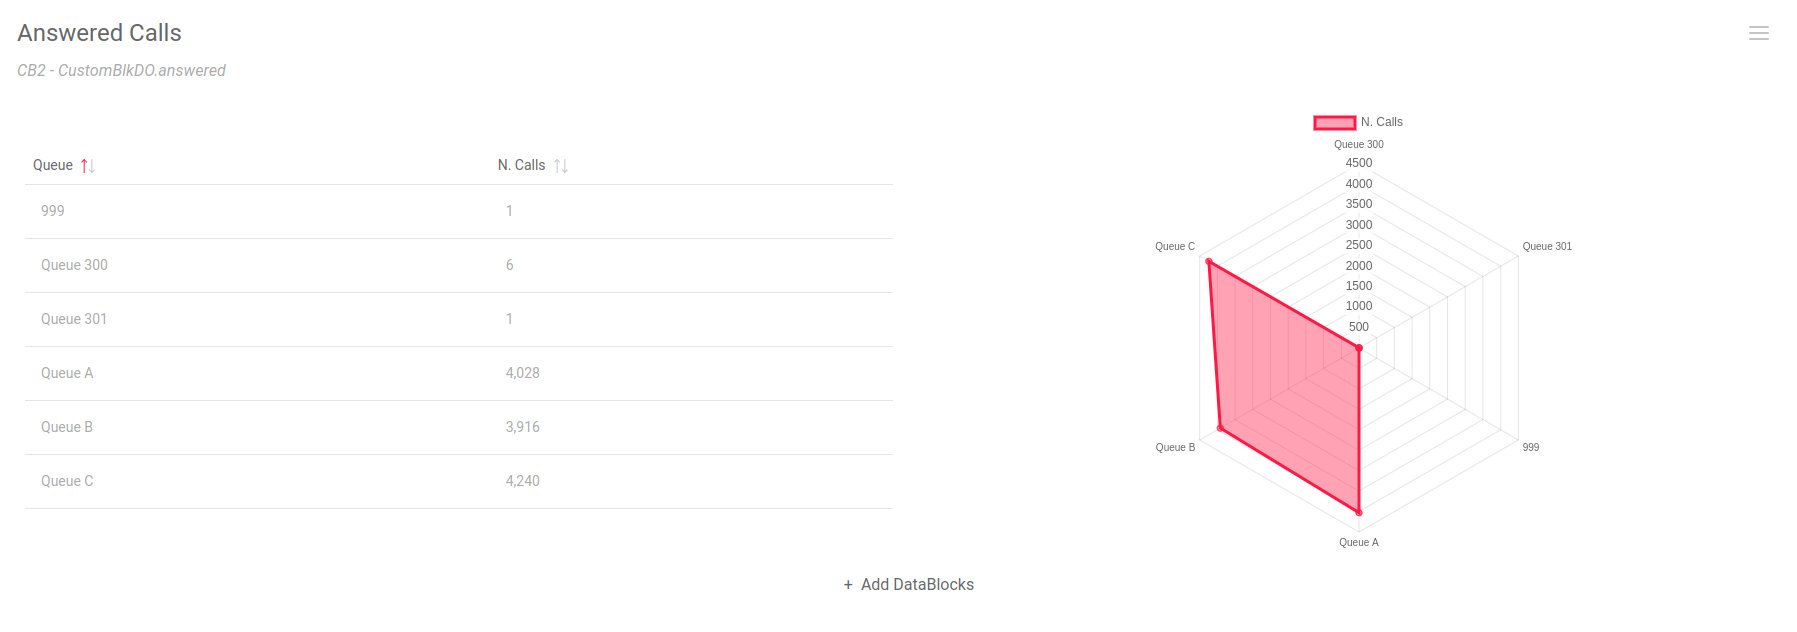
Some valid chart parameter examples for the above custom DataBlock are:
CHART=LINE DATATYPE=NUMBER XCOLUMN=#1 YCOLUMN=#2
CHART=BAR DATATYPE=NUMBER XCOLUMN=#1 YCOLUMN=#2
CHART=RADAR DATATYPE=NUMBER XCOLUMN=#1 YCOLUMN=#2
CHART=PIE DATATYPE=NUMBER XCOLUMN=#1 YCOLUMN=#2
As you can see below, these recipes will result in different charts for the DataBlock.
If there’s an error with the chart configuration, you will see a placeholder picture in its place as such:

Report Export Configuration pages
Users holding the key USR_REPORTS_EXPORT_EDIT can edit the list of PDF and XLS export jobs.
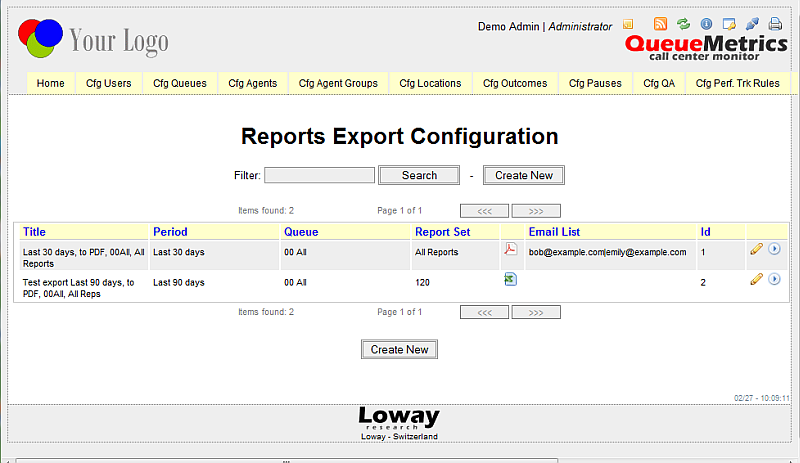
Each job is associated to a specific query period, queue and report set meaning that, each time the report is run, QueueMetrics calculates the results based on the input parameters and exports the whole report set to the required format. The generated document is sent to the recipients list specified for the job. Each job is identified by a numeric id generated by QueueMetrics and shown in the Id column. As defined in the chapter Generate PDF and XLS reports and send them by e-mail this id has to be used to run the report by an external ROBOT profile.
The user can edit a specific job, by clicking on the pencil icon, or can run it immediately, by clicking on the blue button shown on the list.
| The user is allowed to run the report only if holding the USR_REPORTS_EXPORT key. |
Each time a user creates or edits a job, the next screen will be shown:
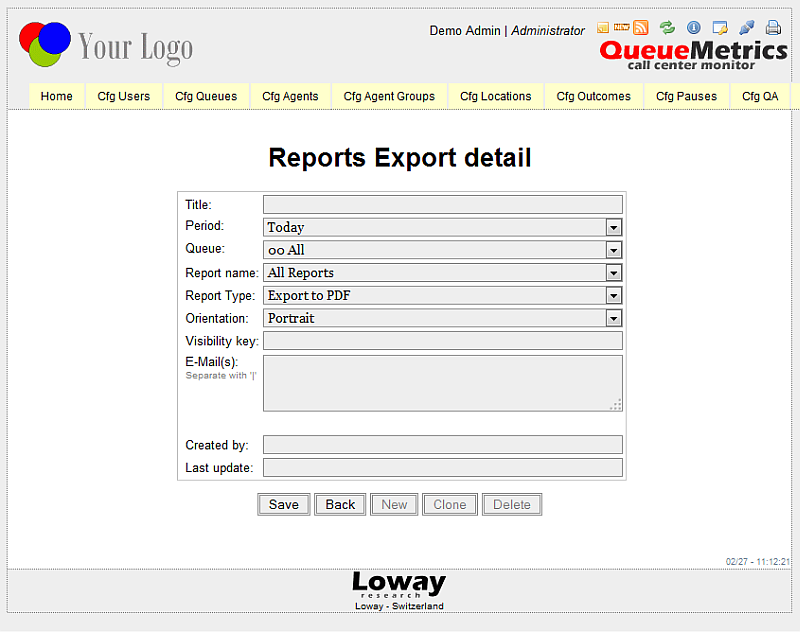
On this page the user is allowed to specify a title, needed to identify the job in the job list, and other relevant parameters like period, queue, report name (an already defined report set), report type (XLS or PDF) and the orientation (valid only for PDF documents). Each reports export job could be associated to optional visibility keys used to hide/show the job to a set of users. Finally, a list of e-mail recipients can be added - if present, on generation, the resulting report will be sent to them.
If an export job is included in a scheduled job, a clock icon will appear next to it in the export jobs list page. By clicking on the clock icon, the user will be taken to the scheduled jobs list where he can view the various scheduled jobs.
Scheduled Jobs Configuration page
Users holding the key USR_CRONJOBS_EDIT can edit the list of available scheduled jobs.
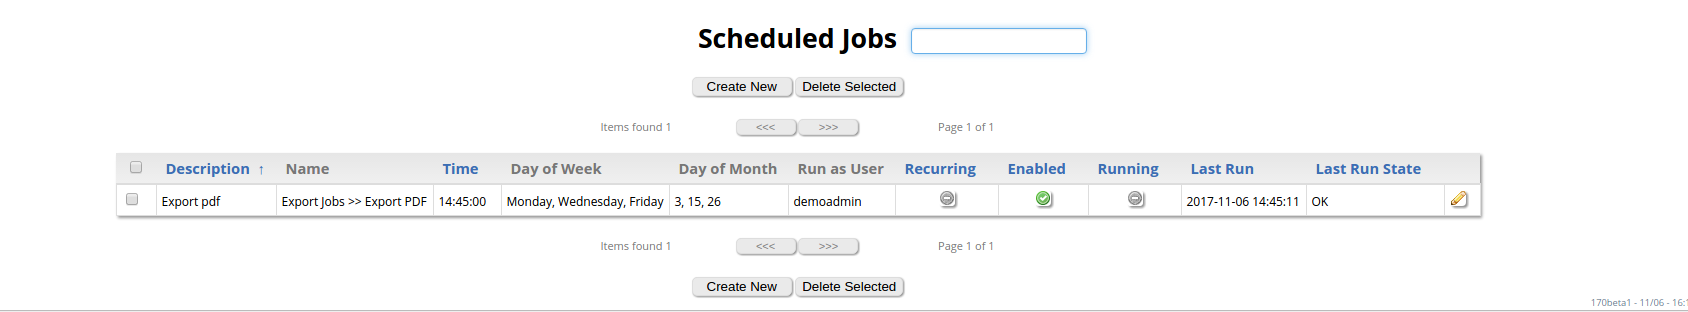
Each Job represents a specific task, chosen between those available, that will be executed automatically at a specific point in time, or regularly at set intervals of time. The user can also specify particular days of the week or days of the month as a requirement for executing the job.
The user can edit a specific job, by clicking on the pencil icon shown on the list.
Each time a user creates or edits a Scheduled Job, the next screen will be shown:
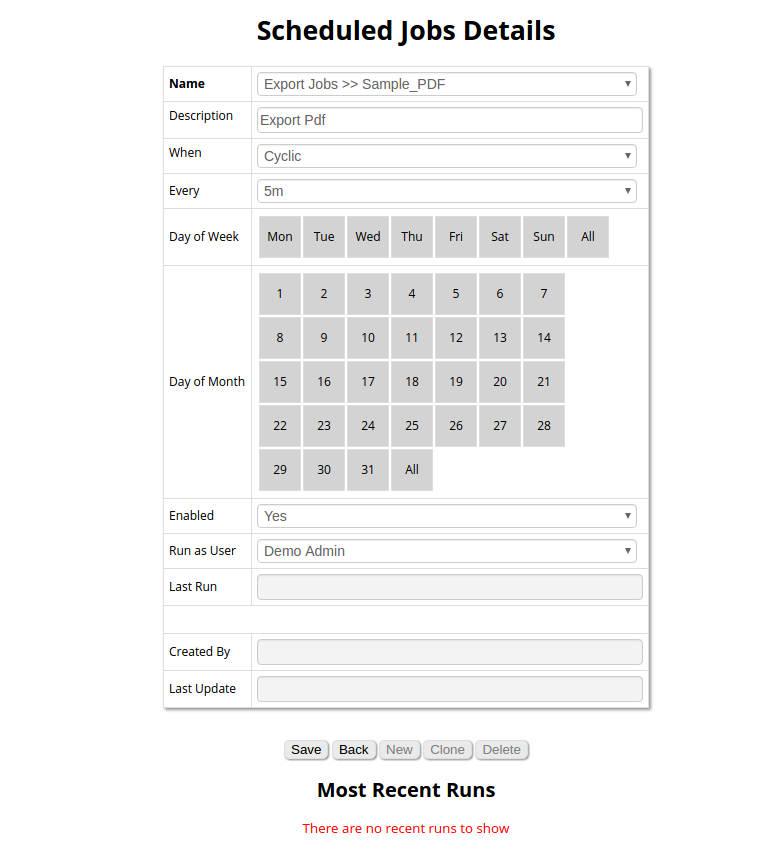
On this page the user is allowed to choose a job type, and other relevant parameters like the time, the day requirements, and if the job is enabled or not.
One relevant parameter here is the "When" parameter. If this parameter is set to "Cyclical", the selected "Every" value will be intended as the interval between different executions of the Job. If "When" is set to "Once a day" instead, the "Time" value is intended as the actual time of intended execution.
So for example,
-
If "When" is set to "Cyclical" and "Every" is set to "5m" the job will be executed every five minutes.
-
If "When" is set to "Once a Day" and "Time" is set to "00:05", the job will be executed at five minutes past midnight.
Another relevant parameter is the "Day of Week" parameter. If we select only "Monday" for example, the Job will be executed only on mondays.
The same goes for the "Day of Month" parameter. If we choose 2,5,13 for example, our Job will only be executed on the 2nd 5th and 13th day of the month.
The "Day of Week" and "Day of Month" conditions are mutually exclusive, so if we set "Monday" and then "5", our "Monday" choice will be deleted and the scheduled job will only consider the Month Day option "5".
The "As User" parameter indicates which user will be impersonated when the Job is executed automatically. The user can only set itself as the user or, if the user is editing a Scheduled Job created by another user, the creator of the Job.
Configuring IVR and DID/DNIS names
Users holding the keys USR_IVR and USR_DNIS can edit the list of known IVR and DNIS names.
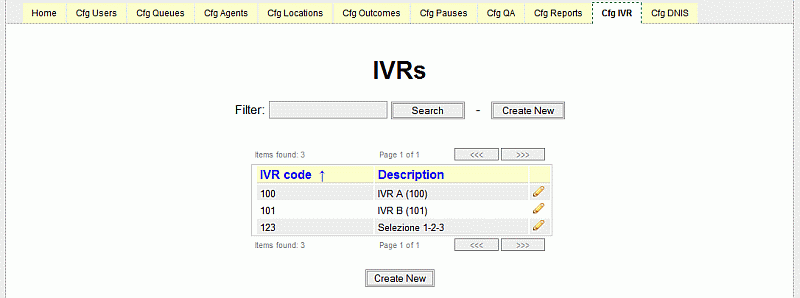
This list is used to decode the display of known IVR selections and DNIS numbers. Both configuartion pages behave the same way.
| If you know that your 'Support' IVR selection is 1-3-4, you could create an IVR entry of '134' that decodes to 'Support (1-3-4)'. This surely makes the display easier to read. |
Elements that are not listed in the editor are displayed with the string they are recorded with at the Asterisk level.
IVR entries are also used to decorate IVR menus in IVR path traversal analysis. You simply add the name of the IVR menu and the decoded value.
Configuring CBTs (Computer Based Training)
Users holding the key USR_CBTS can edit the list of known CBT URLs and names.
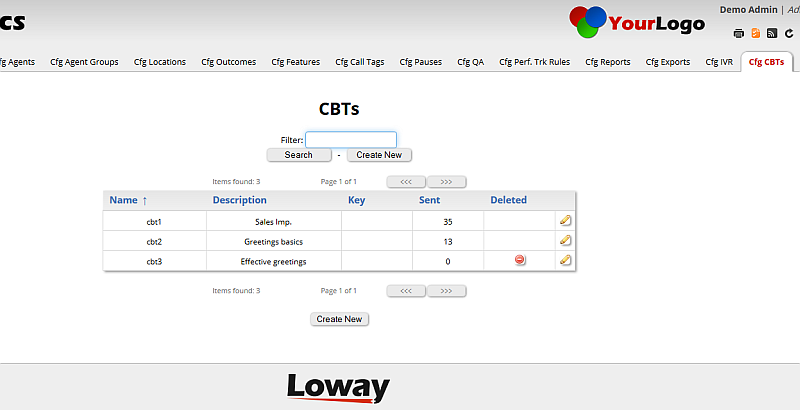
This list is used to populate the selection of available CBTs and to define the common URLs will be used in the task detail for each CBT sent. The URL can be used to point to any kind of material, as appropriate (e.g. PDFs, videos, interactive courses…). The URL may include a [U] token field that will be substituted with the login of the agent filling in the CBT, so that an external CBT system may keep track of why is filling it in or personalize the courseware.
| If you modify the URL of an existing CBT on the list, all CBT URLs matching the same URL on the tasks tables, for all tasks not completed, are updated as well. This means that you can create a post-hoc descriptive CBTs out of URLs that are already used on the system. |
Each CBT includes a read-only field that tracks the number of times the CBT was sent; this value is reported in the CBTs list. CBTs can be set active or not, so it’s possible to put CBTs off-line when they become obsolete.
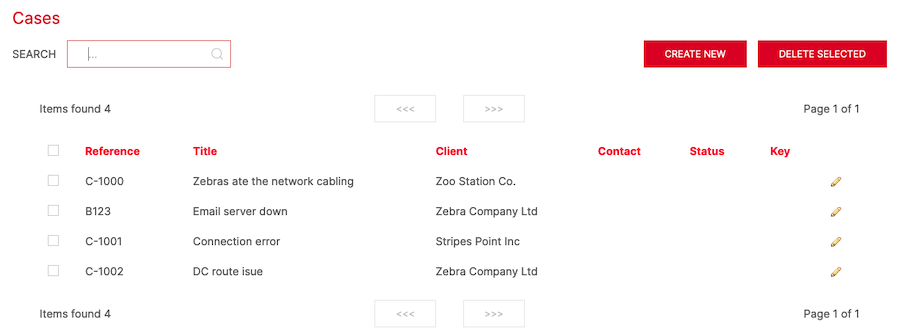
Configuring Cases and Clients
Clienst and Cases act as a kind of mini-CRM within QueueMetrics; they can be created by agents and supervisors, and can be easily added to calls through the Agent’s page - to see how it works from there, see Clients and Cases in the Agent’s page.
They share a set of common principles:
-
Both have:
-
A title - that is mandatory
-
An external reference, that is a client-id or a case-id as used in your company. If you provide none, then QueuMetrics will create one for you. But if you have a different identifier, you are free to use it instead. The external reference must be unique, though you can change it.
-
A status, that can be
OpenorClosed. Only items with an open status can be used to be linked to calls or, in the case of clients, to new cases. You are generally not allowed to delete elements that are in use. -
A security key that determines which agents can select it. If blank, all agents can see it.
-
A number of other fields, that you can use as you best see fit (email, notes, contacts etc).
-
-
You can use both Clients and Cases, or just Clients or Cases, depending on your preferred workflow.
-
A Case has an implied Client, though this can be overridden on a call-by-call basis
-
Both Cases and Clients are stored, though their external references, on the
queue_logfile along with other call data
Both Cases and Clients will appear in reports, under data block show in Historical reports - Cases and Clients.
Configuring Clients
To configure clients, you must hold the key USR_CLIENTS_EDIT.
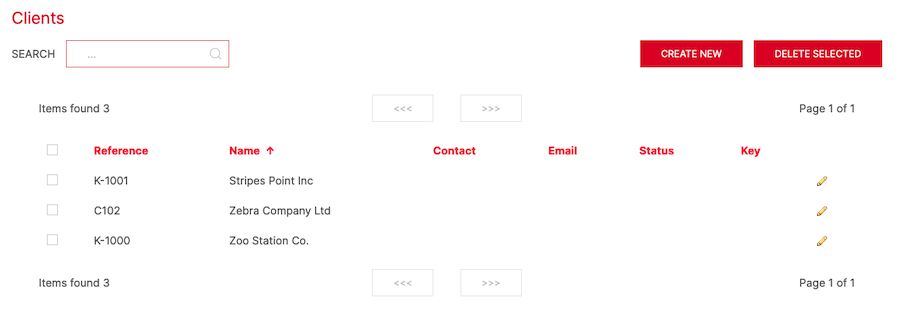
The editor works in a similar way to all other editors. If you leave the field Reference blank, a new reference will be created for you.
The default format for clients' external references that QueueMetrics generates for you is K-1234. But you are free to use your own, as long as they are at least three characters long.
Under the details of a client, there is a list of recent cases that this client is referenced to. For each case, you can see their reference, the title and whether it is open or closed.
Configuring Cases
To configure cases, you must hold the key USR_CASES_EDIT.
The editor works in a similar way to all other editors. If you leave the field Reference blank, a new reference will be created for you.
The default format for cases' external references that QueueMetrics generates for you is C-1234. But you are free to use your own, as long as they are at least three characters long.
When creating a case, you must link it to a client. Of course, a client may have multiple cases linked to it. In general, if there is only case information for a call, QM assumes that the referenced client is the case’s. But the agent can override this setting, so that a call may appear under a case and under a client that is not the case’s own client, by manually setting a client on a call where a case is set.
Under the details of a client, a list of all activity for the case is displayed. This consists of all agents linking the case to some call, or adding comments to it.
Configuring paged call lists
It is possible to view details of calls (answered, unanswered) in a paginated order, rather than as a long list of data on a single page, allowing better readability when running a large result set.
To set this up, from the Home page you select "Edit Reports" which leads to the Configure QueueMetrics reports" page (Cfg Reports tab). Click on the "All reports" link and you will be shown all current reports. At the bottom of the screen select "Create New".
Enter a Short Name such as "New" and a Title such as "New Blocks" - you can choose different Name/Title if necessary. Also, the Visible in All Reports field should be set to "Yes". Now Save it.
Go back and select "New Blocks" which leads to the "Report: All Reports >> New Blocks >> Items" screen. Select "Create New".
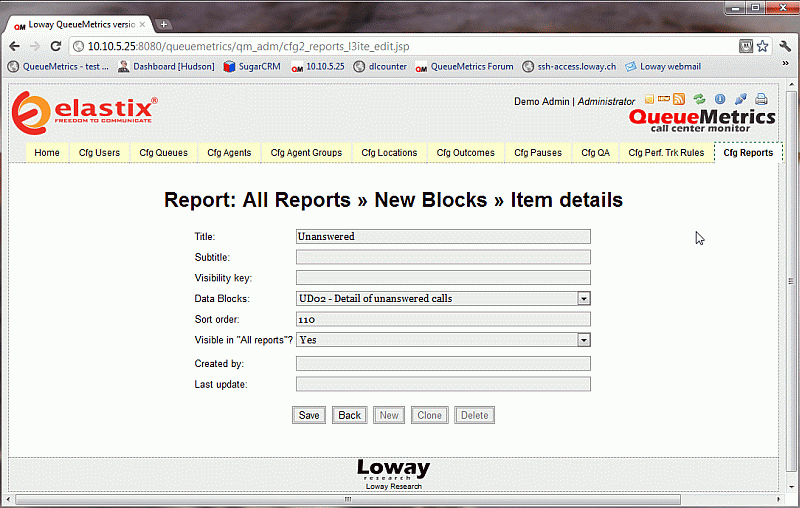
Save it and select "Back" - you will now see the newly-created item.
If we run a Report we will see a new tab called "New", as shown below, where the calls are showing in pages, rather than as a listing (note the buttons to go forward/back and that the page is 1 of 2 pages)
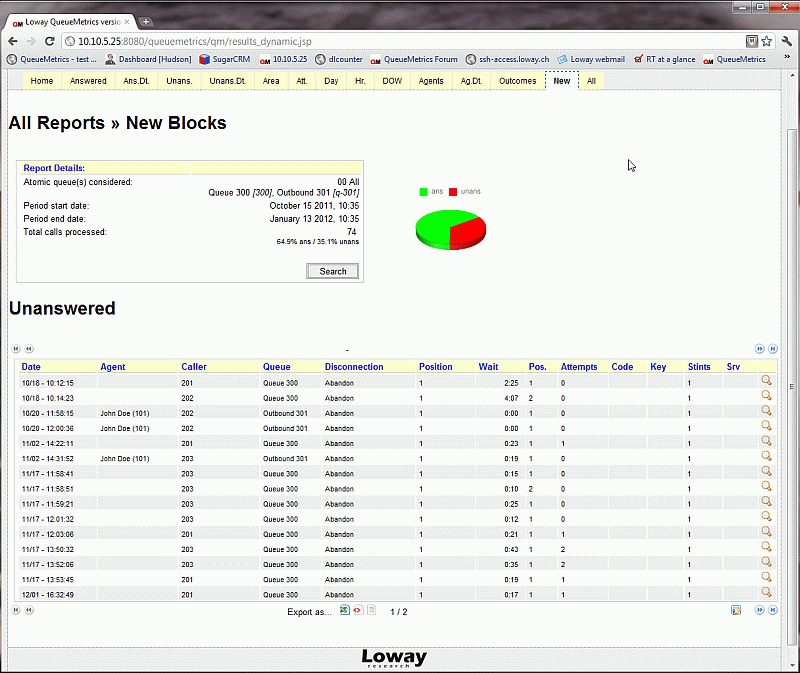
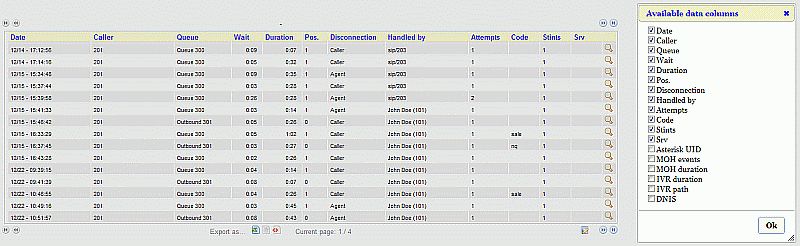
In the image above, on the bottom right of the paginated list we can see a small icon just before the "next page" buttons. this icon allows us to add or remove columns within the displayed paginated listing. It is now possible to add the Music on Hold (MOH) columns "MOH events" and "MOH duration" which display the number of events where a caller was put on Hold with music and the total duration of such events. You can also add the columns "IVR duration/IVR path" which displays the time the caller spent within the IVR selections and the choices the caller made while going through the process. Adding the "DNIS" column allows to display the number dialled to reach the queue.
Configuring the new Real-time Agents Page
Configuring the new realtime page involves to set some configuration keys that are inherited from the old agent realtime page and a new set of keys specifically designed to operate with the new realtime page. This chapter summarize the most relevant keys needed to properly configure the new realtime page and the integrated softphone. For more details on each key, please refer to the Appendix C: System preferences
Enable/Disable the hotdesking:
default.hotdesking=86400
A value different than zero enables the hotdesking.
Defines a custom CRM page that will be open on each new taken call:
# Asterisk Unique ID visibility and related callback URL associated to the icon
default.crmapp=http://server/app?agent=[A]&unique=[U]&server=[S]&queue=[Q]&tst=[T]&cid=[C]&dnis=[D]&ivr=[I]&outcome=[O]&position=[P]&attempts=[M]
default.crmlabel=CRM Page
default.showAstClid=true
realtime.agent_autoopenurl=true
Defines two other optional custom backgrounds:
# Custom web pages for the realtime agent page
realtime.agent_web1_url=http://www.queuemetrics.com/?agent=[A]
realtime.agent_web1_label=QueueMetrics
realtime.agent_web2_url=http://www.loway.ch/?agent=[a]
realtime.agent_web2_label=Loway
Optional backgrounds can be opened as popups by setting the property agent.openUrlInPopup to true in the Edit System Parameters page.
Custom background pages can also expand a set of placeholders that carry useful information.
| Placeholder | Meaning |
|---|---|
[A] |
The agent’s numeric code, e.g. 101 for Agent/101 |
[X] |
The agent’s extension, e.g. 300 |
[U] |
Unique |
[S] |
Server |
[Q] |
Queue |
[T] |
tst |
[C] |
cid |
[D] |
dnis |
[I] |
IVR |
[O] |
Outcome |
[P] |
Position |
[M] |
Attempts |
If CRM and/or custom backgrounds are not needed, it’s possible to override the default background changing the key:
realtime.agent_background_url=http://serverurl/backgroundpage.htm
In order to use the integrated softphone, the steps required are: 1. Configure the SIP server and the WebRTC URL 2. Add, for each agent, a SIP username, password and SIP Realm authentication.
Depending on our setup (normal or clustered mode), the SIP server and the WebRTC urls are set by changing the below configuration keys. For a not clustered QueueMetrics install:
# Default keys for the sofphone definition
default.sipaddress=10.10.5.49
default.websocketurl=ws://10.10.5.49:8088/ws
default.rtcWebBreaker=true
For a clustered QueueMetrics install, be sure you’re setting the following keys for each server in your setup:
cluster.serverX.sipaddress=10.10.5.49
cluster.serverX.websocketurl=ws://10.10.5.49:8088/ws
cluster.serverX.rtcWebBreaker=true

where serverX is the name of each server defined in the cluster configuration key.
Then, for each agent, set the SIP username, password and SIP Realm authentication through the Agent Configuration Pages, as explained in Configuring agents
The Logon Panel allows to pre-validate the agent code and the agent extension needed by the login/logout process. In order to validate these codes, a two set of keys have to be set:
# The regexp to validate agent codes
realtime.agentRegexp=1\\d\\d

#A regexp to validate extension codes
realtime.extensionRegexp=\\d\\d\\d
The Logon Panel allows to mark as read only the agent code field. This could be accomplished by setting the following key:
default.lockedAgentPopupCode=true
The list of available queues for each agent is defined by the following key:
realtime.dynamicLoginQueues=all
Relevant values for this key are:
-
assigned or registered: the list of available queues shows only the queues where the agent plays a defined role (i.e. is a main/spill/wrap for these queues)
-
all: the list of available queues shows all the defined queues, without taking care of the agent role (but filtered by visibility key)
Agents can insert pauses through the Pauses panel. Pauses without a specified pause codes can be rejected by setting the following key:
default.pausecoderequired=true
Agents can grade taken calls only if they hold the QA_TRACK key.
QueueMetrics configuration wizard
In order to save time and make sure that QM is always up-to-date with the underlying Asterisk configuration, it is possible to run a wizard that will load the following data straight from Asterisk configuration files:
-
Which queues are in use, and their configuration
-
Which agents are being referenced, their name and how they belong to the various queues
It is also possible to automatically create users out of the defined agents, so that they can log-on to QueueMetrics with the very same password they use to log-on to Asterisk.
In order for the wizard to be run, the user must hold the grants to administer users, edit queues, edit agents, and must hold the CONFIG key too.
If the user holds the required keys, the label "Setup wizard" will be shown on the front page:
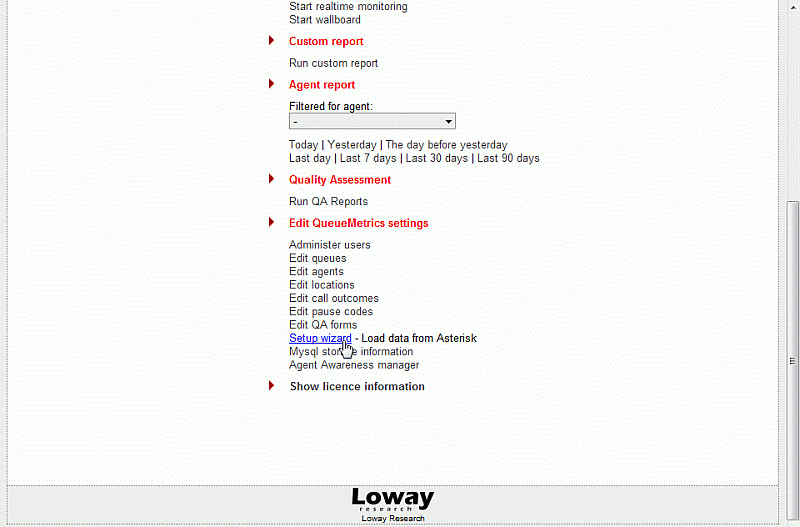
By clicking on it, the administrator will be lead to the first step of the wizard.
At the top of this page is a dropdown menu that defines where asterisk configuration could be found. Actually the wizard is able to read information from:
-
File
-
Single machine Asterisk Manager Interface
-
Clustered machines through Asterisk Manager Interface
-
Asterisk realtime database
-
Asterisk queue log file
By selecting the "File" source, the three edit boxes will let the administrator able to specify the local paths for the agents.conf, queues.conf and the users.conf file.
By selecting "Queue Log File" as source, the associated edit box will let the administrator able to specify the local path for the queue_log file.
| The users.conf file is optional and could integrate the information stored in the agents.conf file. The agents.conf file, instead, is not required only if the users.conf is present. |
| If you don’t have the users.conf or the agents.conf file, you can leave in the edit boxes their default values and the system will be able to skip it if not found. |
For sources different than "File", or "Queue Log File", the wizard will use some configuration options to know how to reach the required information. More details can be found in Configuring system preferences and in Appendix C: System preferences.
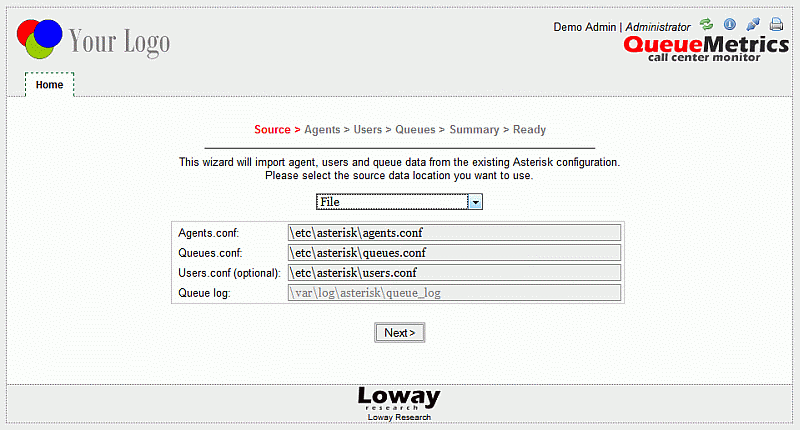
When you have selected the source you want to be read, click on Next button. You will be redirected on the validation page. This page will inform you if the provided sources were succesfully read or, in the worst case, it will show you a message reporting an explanation of the error found.
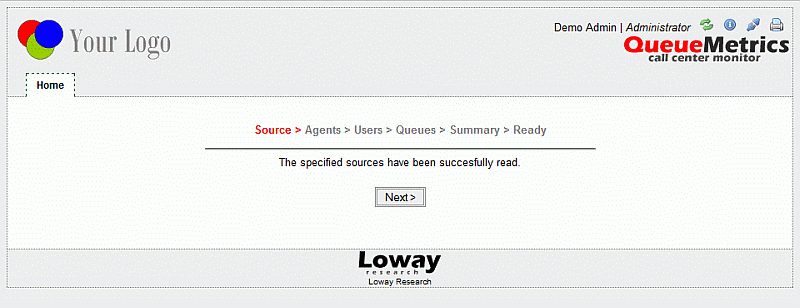
If the validation fails, clicking on Next button you’ll be forwarded back to the first step, otherwise, you’ll be redirected to the next step.
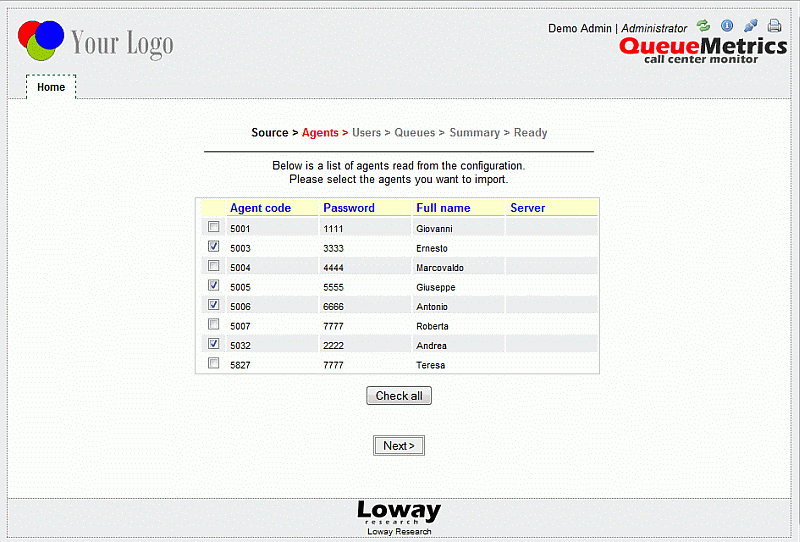
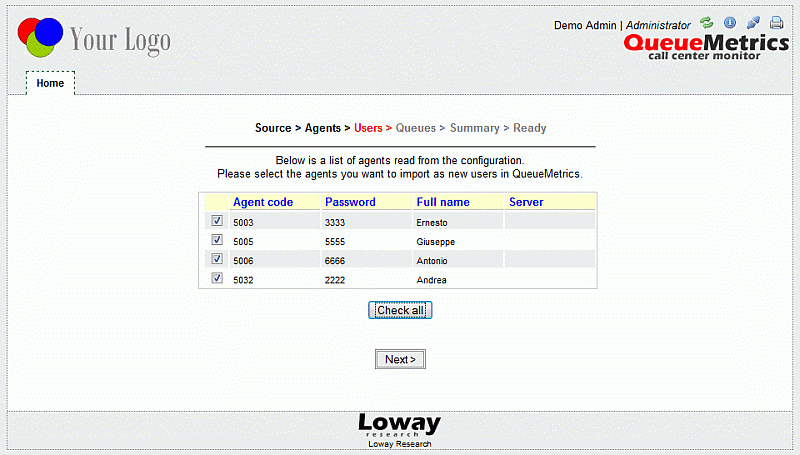
The wizard will scan the available agents and presents you a list of agents to be created or updated. By default, this wizard will try not to modify an agent or a queue that is already present in QM, that is the found data will be shown but unchecked. Check on the items to include/exclude them as needed.
If no agents will be selected, by clicking on Next button the wizard will skip the next step and will forward you directly to the queue selection step. If at least one agent was selected, instead, when you click on Next button you’ll be redirected to the window shown below.
If the corresponding QM users, for selected agents only, are not present, they are created automatically by this mask.
Please note that if the wizard is not able to read the password associated to a specific user (because the password is not specified in the configuration files or because the wizard is reading information from AMI or realtime, or the queue log file, where password for agents are not shown) it will use the following rules:
-
For each new user added, a default password will be forced to be equal to their agent code
-
For each user to be updated (i.e. already present in the QueueMetrics database) a default password will be shown in the mask but it will never used to overwrite the already present one.
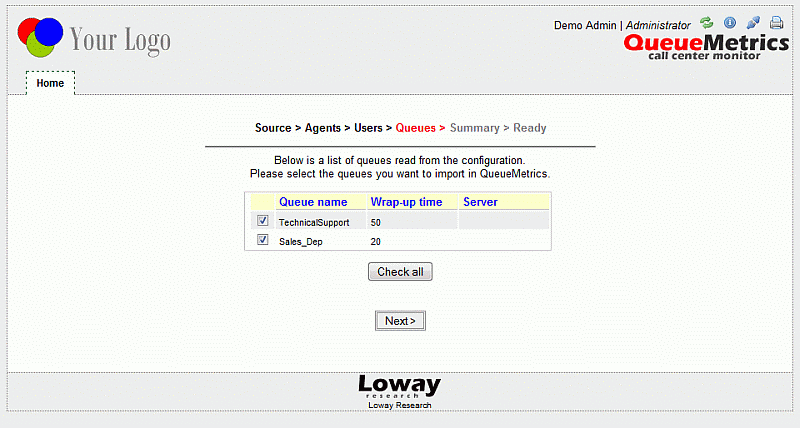
The queues will be created or updated as needed; existing queues will not usually be overwritten without explicit user permission.
| A queue will be automatically checked to be updated if at least one of its agent member was selected to be updated and/or added. |
| When updating a queue, the spilloff and queue members lists will be generated looking at the penalties associated to the agents read from the sources. If an agent is already present in a member or spilloff list, but it was not selected to be updated, he will not removed and/or moved from any list. |
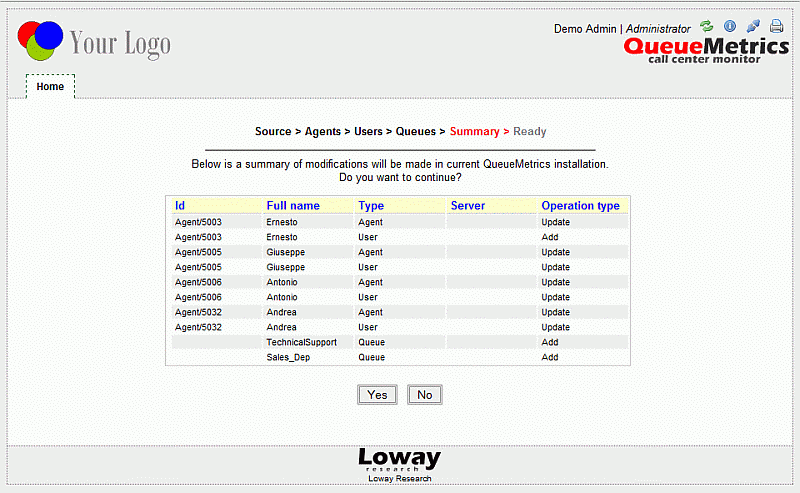
If you click to the Next button you’ll be redirected to the page above reported. This page will display a summary of the QueueMetrics database updates that have been scheduled to be performed. Clicking on the Yes button, the scheduled actions will be run and you will be redirected to the last page where a table listing the related operations results will be presented. Clicking on No button, instead, you’ll be forwarded back to the first wizard step.
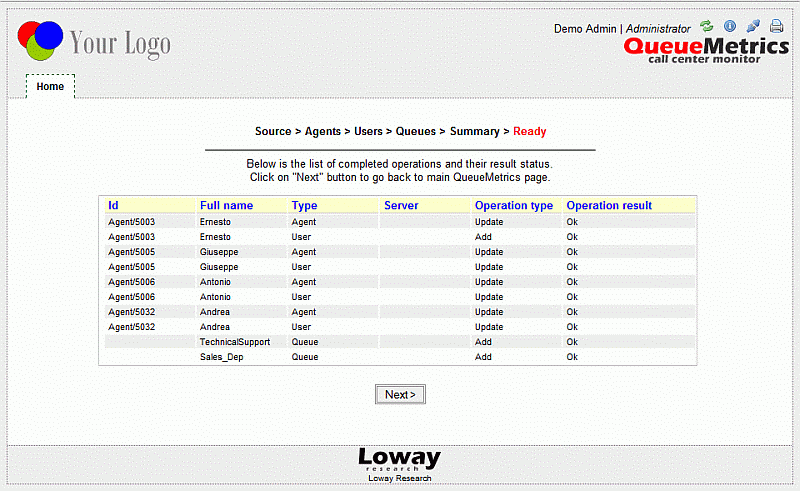
The QueueMetrics database is now updated with the information found in the selected sources. You can go back to the home page clicking on Next button.
Unattended QueueMetrics configuration and update
QueueMetrics could be updated and configured by means of external http queries made in a known format. This is really interesting for setting up a cron job to be completed sometimes during the day. When QueueMetrics receives external http queries, it will perform all the configuration wizard steps together (see QueueMetrics configuration wizard) assuming default answers. This will result in a background synchronization between your asterisk boxes and the QueueMetrics database. To be able to run periodic QueueMetrics update, you need:
-
A QueueMetrics user holding the CONFIG key
-
A command line script able to perform http queries
The URL to be used to start the unattended configuration system has to be formatted as follow:
http://qmaddress/queuemetrics/autoconf_Robot.do?user=demoadmin&pass=demo \
 &stype=0&agents=/etc/agenti.conf&queues=/etc/code.conf&users=/etc/users.conf
The meaning of specified parameters is below reported:
-
user: the username to be responsible for the update process
-
pass: the password associated to specified username
-
stype: defines what type of source you want to use and it could assume the following values:
-
0: File. If no other parameters were specified, the wizard will read the files defined in the default configuration.
-
1: Single Machine Asterisk Manager Interface. The wizard will read information from the machine specified in callfile.dir key.
-
2: Clustered Machines Asterisk Manager Interface. The wizard will read information from the machines specified in the standard cluster definition.
-
3: Asterisk realtime. The wizard will read information from the database specified in the configuration.
-
4: Asterisk queue log file. The wizard will read information from the provided queue log file.
The user, pass and stype are mandatory; the other parameters are optional and have no meaning when the requested source is different from "file".
The other parameters are:
-
agents: specifies the asterisk agents configuration file (and it’s read only when the "File" source is specified)
-
queues: specifies the asterisk queues configuration file (and it’s read only when the "File" source is specified)
-
users: specifies the asterisk users configuration file (and it’s read only when the "File" source is specified)
-
qlog: specifies the asterisk queue log file (and it’s read only when the "Asterisk Queue Log" source is specified)
When QueueMetrics terminates the procedure, it will answer with a result page where the term "SUCCESS", or "FAIL", will be present reflecting the operation success status. In this page will be also present a list of the performed operation (and their result status). An example page is reported below:
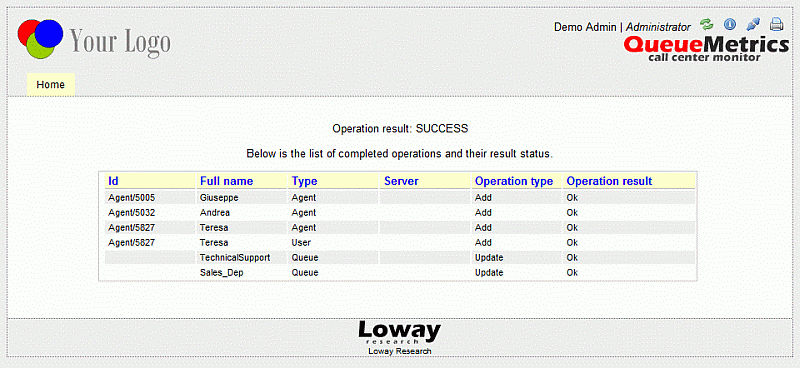
Configuring system preferences
System preferences can be edited by editing a text file called configuration.properties located in the WEB-INF directory of the QM webapp. The absolute path on your system can be found by looking at the System path property on the Licence page.
Since QueueMetrics 15.10 system preferences can be edited through the "Explore system parameters" page under the Administrative tools by users holding the EDIT_CFG security key.
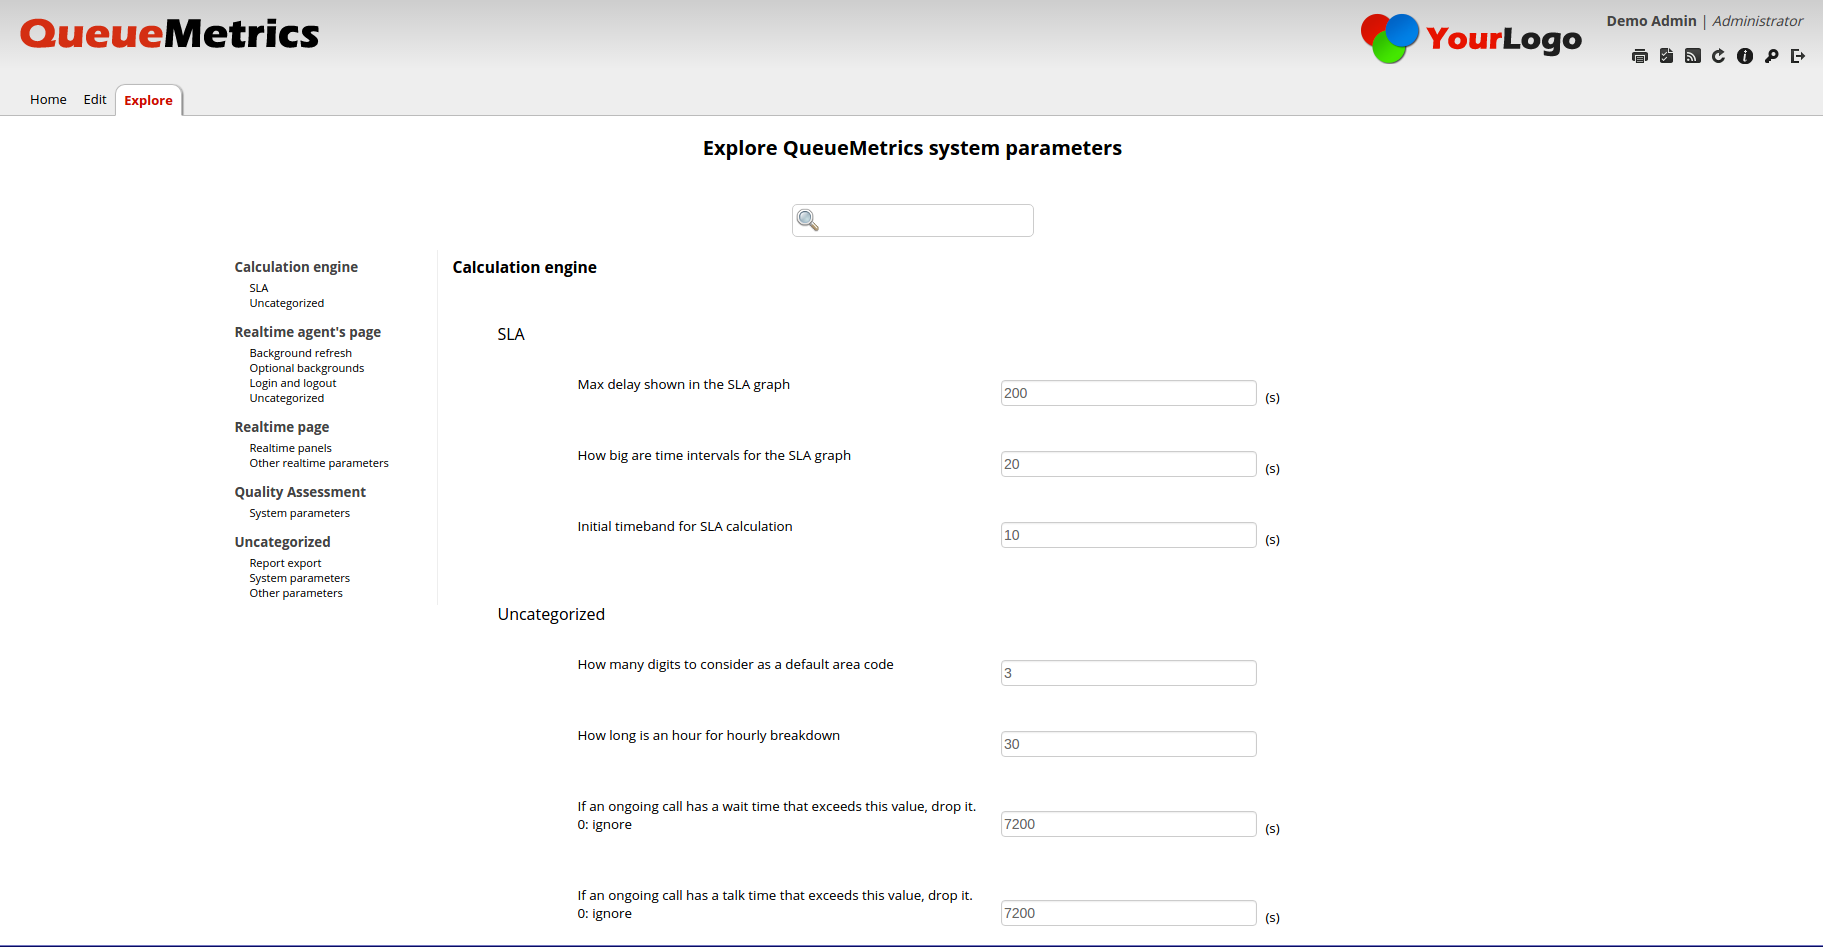
This page lists the most usefull configuration options and allows an administrator to change their values through a set of gui elements. Allowed values are already listed and default values are marked with an asterisk. Through the search box located on the top center side is possible to limit the number of shown options to easily focus on the wanted options.
The system Parameters can be filtered by value, by the parameter description or by the actual parameter name. When searching for a parameter, QueueMetrics will filter out all the non-matching parametrs, displaying only the ones relevant to the research.
The various settings are organized in a hierarchical fashion, with all the keys divided in categories and features. Categories are the most comprehensive groupings, they are written in bold and represent the different aspects of your QueueMetrics system. Each category is then divided in Features resembling the different functionalities that belong to a particular category
at the bottom of this hierarchy, we find the actual parameter keys and their linked current values.
There are three different types of Parameters:
-
Multiple Choice Values: this type of parameter key can only accept a specific list of values, these will be listed in a drop-down menu.
-
Numeric Values: this type of parameter key can only accept numerical values, sometimes even within a certain specific range.
-
Free-Text Values: this type of parameter key can accept any value.
On the left side of the screen there is the System Parameters Sidebar. This sidebar is an overview of all the Categories and Features in the page. To jump to a specific category one can simply click on one of the different category names.
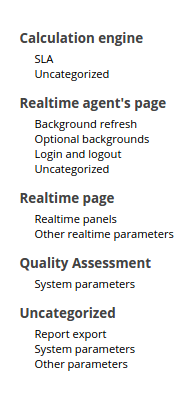
A complete list of preferences can be found in the chapter Appendix C: System preferences. Once a preferences value is changed, it is enough for the user to log off and log on again; restarting the servlet container is not needed.
| You can check the current set of system preferences from the Using the DbTest Diagnostic Tools page. |
Installing the AGAW runner
Once your copy of QueueMetrics is correctly installed, the Queue Runner can be run using a script that is available as WEB-INF/mysql-utils/agaw-runner/agaw-runner.sh under the QM directory.
This file must be edited to set its running parameters, that are:
JAVA=/usr/local/queuemetrics/java/bin/java
Path to the java virtual machine. Please point to a Java JDK version 8 or newer (OpenJDK is fine). The default path points to the default JDK that comes with the automatic QueueMetrics installation.
VMOPTS=-server -Xmx256M -Xms256M
The options for the Virtual Machine. Should be okay for most servers.
USER=demoadmin
PASS=demo
The username and password of a user the transactions will be run under. This should be a regular user or an administrator with visibility to all queues to be selected.
JDBC="jdbc:mariadb://127.0.0.1/qmueuemetrics?zeroDateTimeBehavior=convertToNull&\
  jdbcCompliantTruncation=false&user=queuemetrics&password=javadude"
The JDBC URL to connect to the same database as the main QueueMetrics instance (see your web.xml file).
QMPATH= /usr/local/queuemetrics/webapps/queuemetrics-1.5.0
The system path to the local QueueMetrics installation. You can find it on the local Licence page.
ITER=3
The number of iterations that will be run by the Java process before terminating and spawning a new Java process. This is done so that there is no problem with potential memory leaks, as the JVM is periodically rebuilt. A higher ITER count means more iterations using the same JVM and avoids the burden of reloading classes and libraries.
IDLE=2000
The idle time in milliseconds between one interaction and the other.
RUNLOG=false
RUNLOGDIR=/root/runlog
If RUNLOG is set to TRUE, a detailed run log will be created under the RUNLOGDIR. This directory must be writeable by the Java process and MUST be cleaned periodically - enabling this feature causes a lot of information to be written. See Debugging with Runlogs.
QMARCH=$JARLIB/loway-tpf-155p.jar
QMJAR=$JARLIB/QueueMetrics-1.5.0.jar
REDRPC=$JARLIB/redstone-xmlrpc-1.0.jar
These are the names of the Java classes bundles that contain the local version of QM and of its TPF architecture. These must match the ones under WEB-INF/lib or you will get "Class not found" errors on startup. In a standard QueueMetrics release, QMARCH and QMJAR items are correctly set by the build system to match the current JARs.
SERVLET=/usr/local/queuemetrics/tomcat/common/lib/servlet-api.jar
This points to the servlet API used by your Tomcat installation. The default path is okay for a standard QM installation.
Once you set everything up, you can simply set the script executable and start it to see its output.
chmod a+x agaw-runner.sh
./agaw.runner.sh
Please note that the script will loop indefinitely, so it must be stopped through a kill -9 command.
Installing the database clean-up jobs
The AGAW subsystem produces a great number of old / obsolete / informative log data that is meant to help diagnosing problems, but that can end up filling your disks pointlessly.
There are currently two ways to run database purging jobs:
-
There is a button from the main AGAW screen, and
-
Through a modular HTTP call, meant to be run through scheduled cron jobs
In order to specify parameters for this activity, you should add the following lines to your configuration.properties file:
# Oldest obsolete run to keep when running an optimization, in minutes
dbmaint.agaw_oldestRun=30

# Oldest obsolete log to keep when running an optimization, in minutes
dbmaint.agaw_oldestLog=30

# Oldest obsolete broadcast entries to keep when running an optimization, in minutes
dbmaint.agaw_oldestBroadcast=180
Once you set up the parameters above as preferred (maybe starting with a couple of hours and then see if it is too much / too few) you add the following call to an hourly cron job:
wget http://server/qm/qm_sys_optimize.do?O_L=user&O_P=pass&O_C=AGC
Where user and pass belong to one administrative user.
The O_C parameters takes one or more of the following parameters:
| Parameter | Meaning | Warnings |
|---|---|---|
AGC |
Purge AGAW tables |
Might block for a few seconds |
AQL |
Optimize queue_log table by reordering data |
Will block; run daily or weekly when system not in use |
OQL |
Optimize queue_log table |
Might block for a few seconds |
OAG |
Optimize AGAW tables |
Might block for a few seconds |
OTB |
Optimize other QM tables |
The calls to the qm_sys_optimize transaction are made to be human- and machine-readable, so you might want to run the first time in a browser.
You might want to run an hourly cleanup job plus a nightly/weekly general cleanup and optimization job. They all will likely block the tables they are optimizing for a perceivable time, so do not run them at peak time when users are actually running QM.
Installing the AGAW client facades
The client facades are installed with the main QueueMetrics app, so they will work if the main QM app is working. The only customization must be made in a file named agaw.properties that resides under WEB-INF/
client.refresh=7000
The timeout (in milliseconds) that will lead the client to refresh information on the page. 0 means no refreshing, or user-driven refreshes. The lower this value, the higher the load will be on the AGAW fa\E7ade server.
client.sparkurl=http://chat.myserver:9090/webchat/jivelive.jsp
This is an absolute link to the jivelive.jsp page (a part of Spark Fatspath) that should live on the same server for security reasons. If no URL is passed, there is no "Chat now" section in the clients. To avoid cross-site scripting problems, this works best when both QM and FastPath are installed on the same server.
client.sparkuser=supervisors@workgroup.chat
The virtual user that will be used for Spark Fastpath "Chat Now" button.
As of version 1.5, there is only one available fa\E7ade that "mimics" the behavior of the XUL fa\E7ade and it is called Plain HTML. You can access it at the address http://server:8080/queuemetrics/agaw/facades/plain_frame.jsp
Please note that accessing the fa\E7ade when logged in QueueMetrics is likely to cause unexpected session termination of the QM session - if you must access it with QM open, use a separate browser.
Setting up the AGAW activation key
The default version of the AGAW system comes with a default activation key that will let you test the system with two agents only. You can ask Loway for a time-limited, unlimited-agents demo activation key for the whole AGAW subsystem.
If you try to run the AGAW loader for more agents than the licensed ones, you get an error message on the system log.
The AGAW activation key can be installed in the agaw.properties file.
# License key for the Agaw Runner
runner.activation=............................
The AGAW activation key will be picked up immediately when the Runner restarts, and licensing information will be printed on the standard output.
Debugging with Runlogs
Runlogs are text files that contain the very details calculations for each run are based upon, so they make it possible to spot from where the figures displayed in the AGAW browser come from.
In order to run this, it is necessary to:
-
Enable this feature in the agaw-runner.sh script
-
Create a cron job to delete the generated files, e.g. nightly or weekly, as the result is extremely verbose
-
Make it possible for the administrative users to fetch the files remotely, e.g via a WinSCP client
When this feature is turned on, when administrative uses happen to find some incorrect data, they should:
-
Take a screenshot of the incorrect data
-
Write down the run-id
-
Fetch the text file called agawrun_XXXXX.txt that is under the RUNLOGDIR directory, where XXXXX is the run-id
The run-id can be found as shown here:
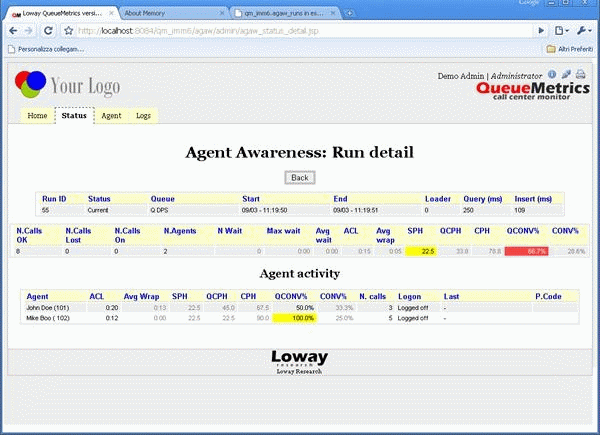
Using the DbTest Diagnostic Tools
The DbTest page, available at the address http://127.0.0.1:8080/queuemetrics/dbtest , will not only let you update the database, but also check a number of QueueMetrics subsystems. It is invaluable for debugging QueueMetrics installations where you suspect some problem may be.
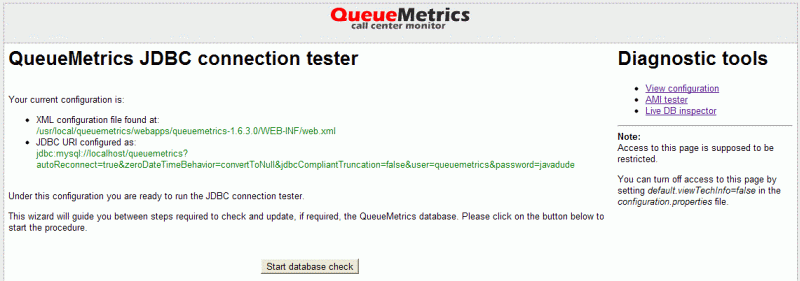
It is also possible to access this page directly from the QueueMetrics home page by selecting the 'System diagnostic tools' link, which can be found within the available Administrative tools.
| It is possible to completely turn off the DbTester page when not needed by toggling the default.viewTechInfo system property. You should do so if not needed by your users. |
Checking the current system configuration
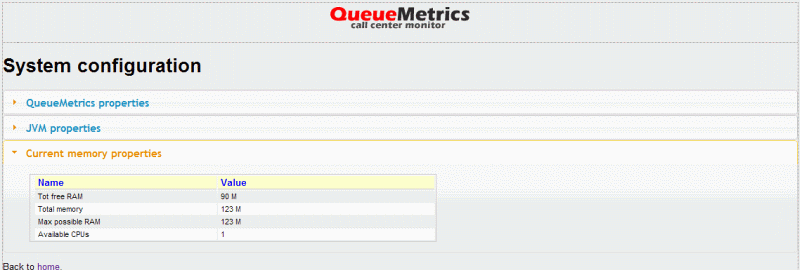
From this page, you can see:
-
The current settings for all system configuration properties, as written in the configuration.properties file
-
The current Java environment variables, usually defined at the JVM level
-
The current memory and CPU settings for QueueMetrics, and the current memory usage. Note that Java will usually try to use all memory availble before doing a cleanup, so seeing most memory in use does not necessarily mean that QM needs more.
-
The current HTTP/HTTPS environment and the HTTP headers passed to QueueMetrics. This is very useful to debug a QueueMetrics system that is behind one or more web proxies.
Checking an Asterisk Manager connection
It is possible to check an AMI connection to an Asterisk server.
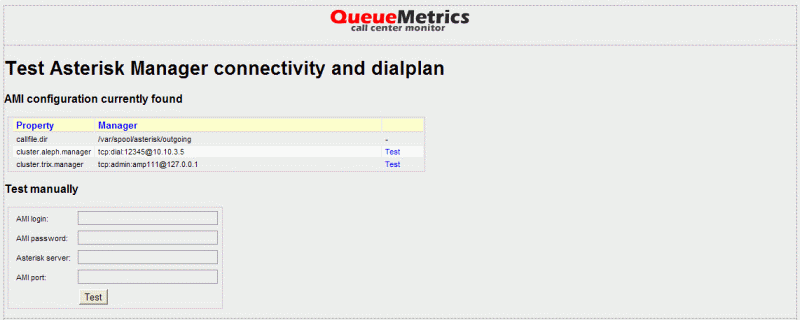
As you can see, the AMI connections in your configuration.properties file are automatically read and can be configured at the touch of a button. As an alternative, you can manually enter the configuration parameters and see what happens.
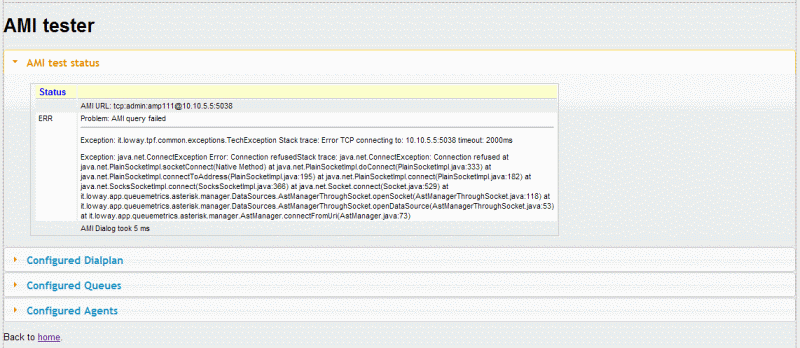
In case the connection (like in the example above) displays an error, the complete stack trace is easily available for inspection. In case everything goes OK, QM will try to originate a call in order to check that the privileges are correct.
If the connection is possible, QueueMetrics will try to:
-
Download and display the queuemetrics diaplan, as displayed under "Configured Dialplan"
-
Download and display the current queue configuration, as displayed under "Configured Queues". This shows the configuration as defined in queues. conf plus the current agent membership (static and dynamic).
-
Download and display the current agent configuration (this only applis to agents as defined in agents.conf)
For further information on the AMI connection, see Configuring the AMI connection .
Checking the AMI Queue
If you send commands to your PBX by proxying them through Uniloader, e.g. in platforms CLASSIC_LIVE, DIRECTAMI_LIVE
or FREESWITCH_LIVE, you can see the status of the command queue and the current platform being used.
-
'On': is the moment when the command was queued for execution
-
'Cmd' is the command
-
'Ext', 'Agent', 'Queue' are the parameters recorded
-
'State': can be
WAIT(command is queued but not yet processed),SENT(command was received by Uniloader and is being applied),OKif it was successfully applied orKOif command execution went bad. If any error was reported back by the PBX - as it usually happens - it is also shown. -
'Sent': is the time it took before the comamnd was received by Uniloader.
-
'Proc': is the time it took for Uniloader to apply the command and send back a status.
-
'Srv': is the server being used
-
The last columnn displays a button to read the actual dialog that was generated to be applied by the PBX. The details depend on the platform being used, and only appear after the call is in state SENT.
The command queue is kept for a limited time (usually one day or so) and then deleted.
It is normal to have a Sent time of a few seconds when running Uniloader over the web.
The most common issues scenarios are that either commands stay forever in WAIT state, or you get KO errors.
A long WAIT state means that either the Uniloader is not running, it cannot connect or it is waiting after a
long set of errors before attempting the next call. Either case can be fixed by restarting Uniloader.
If you get errors in the form of KO responses, there are usually two reasons: either the authentication
credentials are wrong - which you can verify by running uniloader test - or, more often, the channel format
for agents or calls is incorrect. If, say, a logged on agent appears on the PBX as "SIP/123", then a pause command
to "Agent/123" or "PJSIP/123" won’t work. By checking the actual dialog that was sent to the PBX and comparing
it to the actual queue on the PBX, it is easy to spot such mistakes.
|
Live inspector of the QueueMetrics database
This page displays the current contents of the queue_log table, to make
it easy to see data as it is appended by the PBX, and also allows to
inspect the size of database tables.
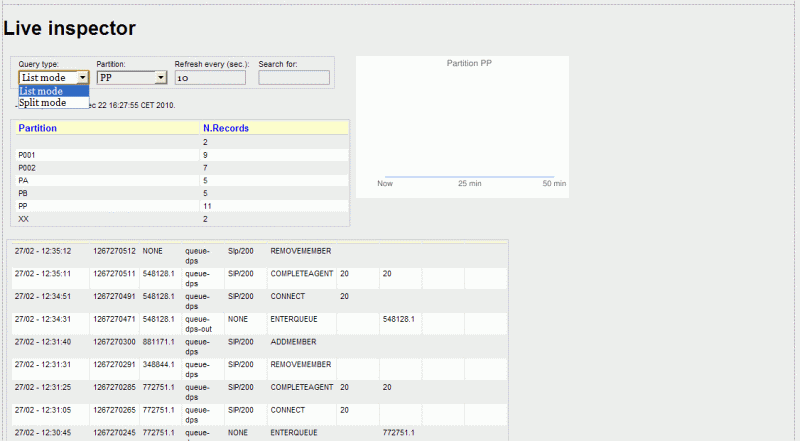
The last 20 lines of the queue_log table for the given partition are displayed.
In "Split mode" the last 10 lines of the queue_log table about calls and the
last 10 lines about agent status are displayed separately.
The display will reload automatically every 10 seconds.
If you see "Partition null" in the graph, this means the queue_log table is empty.
|
It is possible also to search for a substring within a given partition, e.g. a uniqueid code, this may be very slow, and it usually requires a complete table scan. Do not do this repeatedly on a busy production box!
The Partition graph displays the number of events per minute in the last hour or so.
Database size
The inspector also lets you see the current state and size for all tables in the QueueMetrics database.
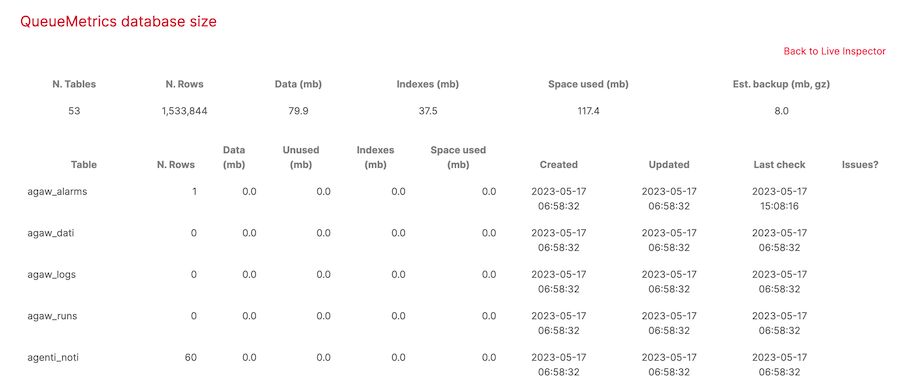
The top table displays the number of database tables that make up the database, the number of distinct rows present, the amount of data and indexes and the expected disk space necessary to create a gzipped database backup.
| The estimated backup size is meant as a rough estimate of the file size you could get by creating a compressed database backup as explained in Backing up. Make sure you have at least 2x the estimated disk space free before attempting a backup! Also, remember that for a complete backup, you need to save the configuration too. |
The bottom table display, for every database table:
-
The number of data rows, the data and indexes in use, and the total disk space used. Significant unused space may be reclaimed by optimizing the underlying table.
-
When the table was created, last updated and last checked
-
Whether the table is marked as crashed, in which case you will have to manually perform a check to allow QueueMetrics to use it.
The largest tables are, usually, arch_syslog (the audit log, as
described in The Audit log)
and queue_log containing call data.
You can have QueueMetrics take care of trimming the audit log for you
by setting up a Scheduled job.
|
RAM cache inspector
This page displays the current status of the different caching layers used within QueueMetrics.
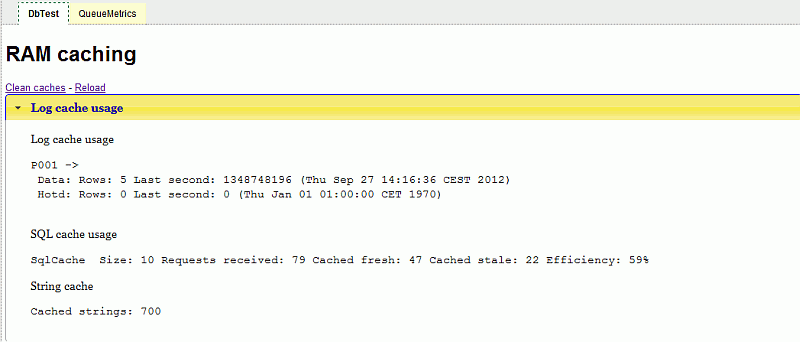
The log cache is an object cache that stores, for each partition, event objects already processsed. It must be turned on by setting 'realtime.useRowCache=true'. For each partition the number of cached objects it is displayed as "Rows". If you use hotdesking you should see a number of objects in the "Hotd" section as well. All of your partitions should appear here.
| the log cache will be used only if the storage type is SQL-based. |
The SQL cache caches SQL results to some common queries. Yo can see the current cache size (it is usually quite small), the total number of requests, how many of them were answered ("Cached fresh"), how many of them had the query repeated ("Cached stale") and the overall cache efficiency. In a busy call center this should be around 70-90%.
The String cache counts the number of string instances that are currently cached. Values in the 100,000 - 1 million element range are not uncommon.
All caches are designed to be emptied when working in order to reclaim memory, so you can safely click on "Clear caches" even while QM is running.
Testing email delivery
The DbTest contains a page where you can check the SMTP configuration by entering all parameters and trying to send an email. As this often requires some tweaking in the context of setting up a Scheduled job, it is better to start from a known working configuration.
The page prints the current configuration being used, and the dialog that happens with the SMTP server.
You have to enter an e-mail address to deliver to, and the page
will initially load with the parameters as defined in configuration.properties.
The page will leave the password field empty and won’t display passwords; if you leave the password field empty, it will use the default password or the one you last used.
Each and every email attempt, be it successful or unsuccessful and no matter who generated it, will be logged to the Audit Log for further inspection.
| The page is only meant to test parameters, and won’t change them. |
E-mail quotas
To avoid run-away processes sending thousands of emails per day, there is
a hard limit in QueueMetrics of the number of e-mails that can be sent in 24h,
both per-user and system-wide. See the properties
default.smtpDailyQuota and default.smtpDailyUserQuota for a complete description.
Any email sent
after these quotas are reached will fail "as if" the upstream provider had rejected them.
When a quota limit is reached, the Audit log will show an error message like "User quota exceeded for user John Doe - 27 emails sent successfully in the last day" so that you can tell the reason for the failure. Any jobs running that triggered such an error will be marked as failed.
| All e-mail sent, be it from manually triggered export jobs, from scheduled export jobs, or from the SMTP tester, are counted against quotas. |
System audit log inspector
QueueMetrics keeps track of a number of activities that happen on the system; for example, every time a user logs on or off, this fact and the related IP address is added to the audit log. The same happens when the configuration is modified or large reports are run.
Administrators who hold the key USR_SYSLOG can access the audit log from 'Home Page' → 'View Audit Log'.
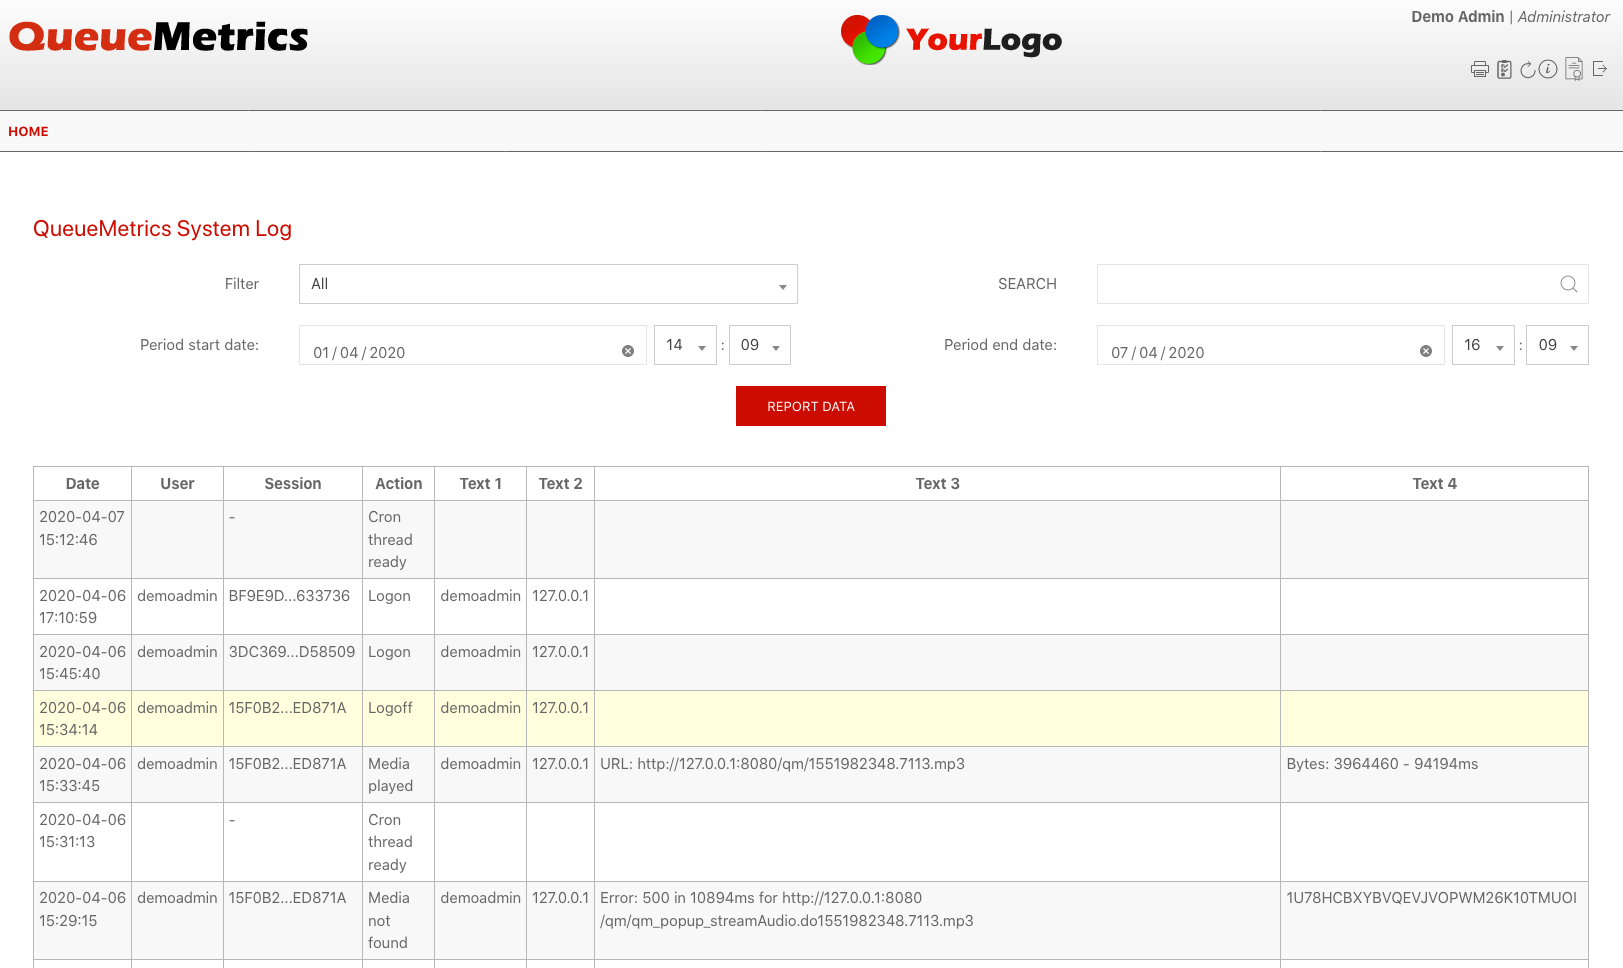
The page displayed is very simple; it allows searching in a given date range, by a substring of the values that appear on screen, and by "family" of events.
A number of different records are tracked throughout the system - see the Appendix for complete details.
| On a busy system with 50+ agents, this log may get large fast; as it does not get deleted automatically, you should set up a scheduled job to trim it periodically. See Scheduled jobs for more details. You can check the current database size from the Live Inspector page. |
Engine audits
It is possible to set default "size" limits, in terms of the time taken to run a report and the number of rows scanned to create it.
These limits apply to reports, webservices and real-time pages, and when exceeded will cause a log entry that details the user who was running that large report and the parameters used to create it.
You can control the duration through property audit.maxReportTime (defaults to 30 seconds) and
the size through audit.maxRowsFetched (defaults to one million rows). Be careful that
a low limit might affect each and every report run, so you may create a huge
number of lines on the audit log.
In any case, any license violation (that is, a report with more agents than are available in your current license) and any Out Of Memory errors will be logged.
QueueMetrics Configuration Synchronizer
The Configuration Synchronizer module can be used to quickly configure QueueMetrics' queues and agents.
What the module does is the following:
-
Shows the current QueueMetrics configuration, in terms of agents and queues.
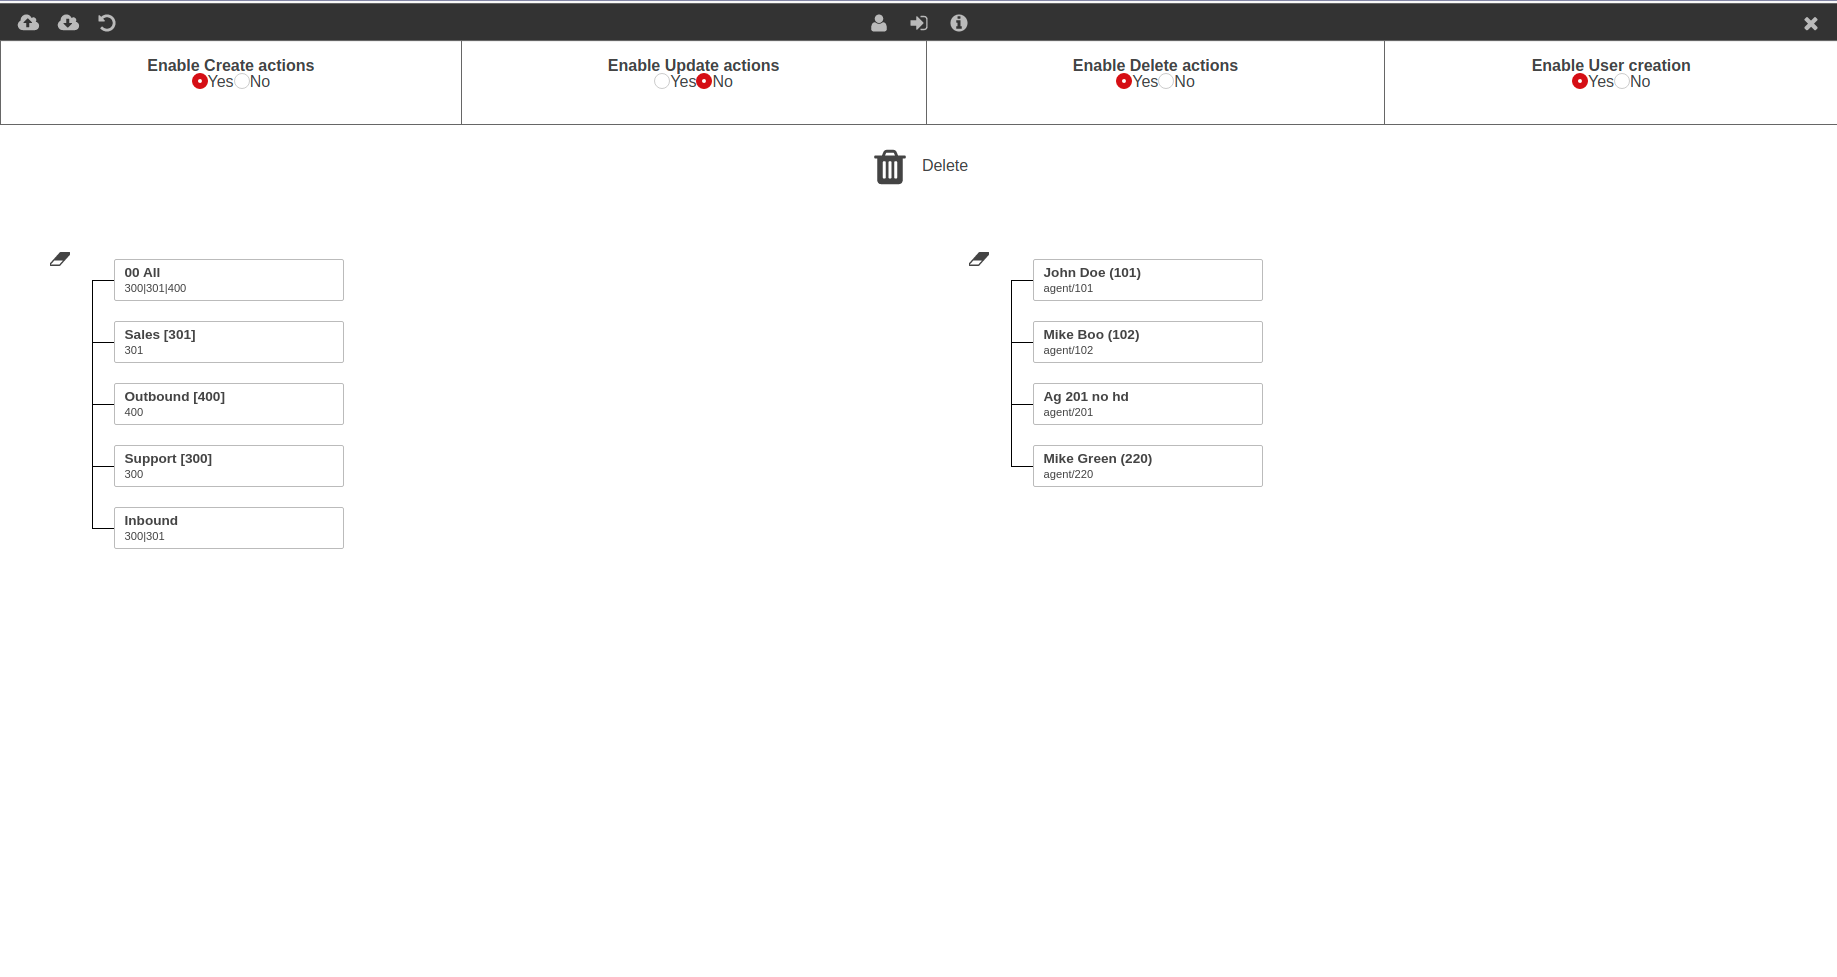
-
Allows the user to edit agents, queues, and the association between agents and queues, by dragging the agents on the releavant queue.
Note: if you cannot edit an object, and see a "lock" icon on the agent or queue, it means that the object is protected from update. To change this, you need to open the object in the queue or agent editor (in QueueMetrics HomePage), and disable update protection in the queue or agent settings.
Note: if you cannot drag an object, and are thus unable to delete it, make sure you have delete actions enabled, and that the object in question is not protected from deletion.
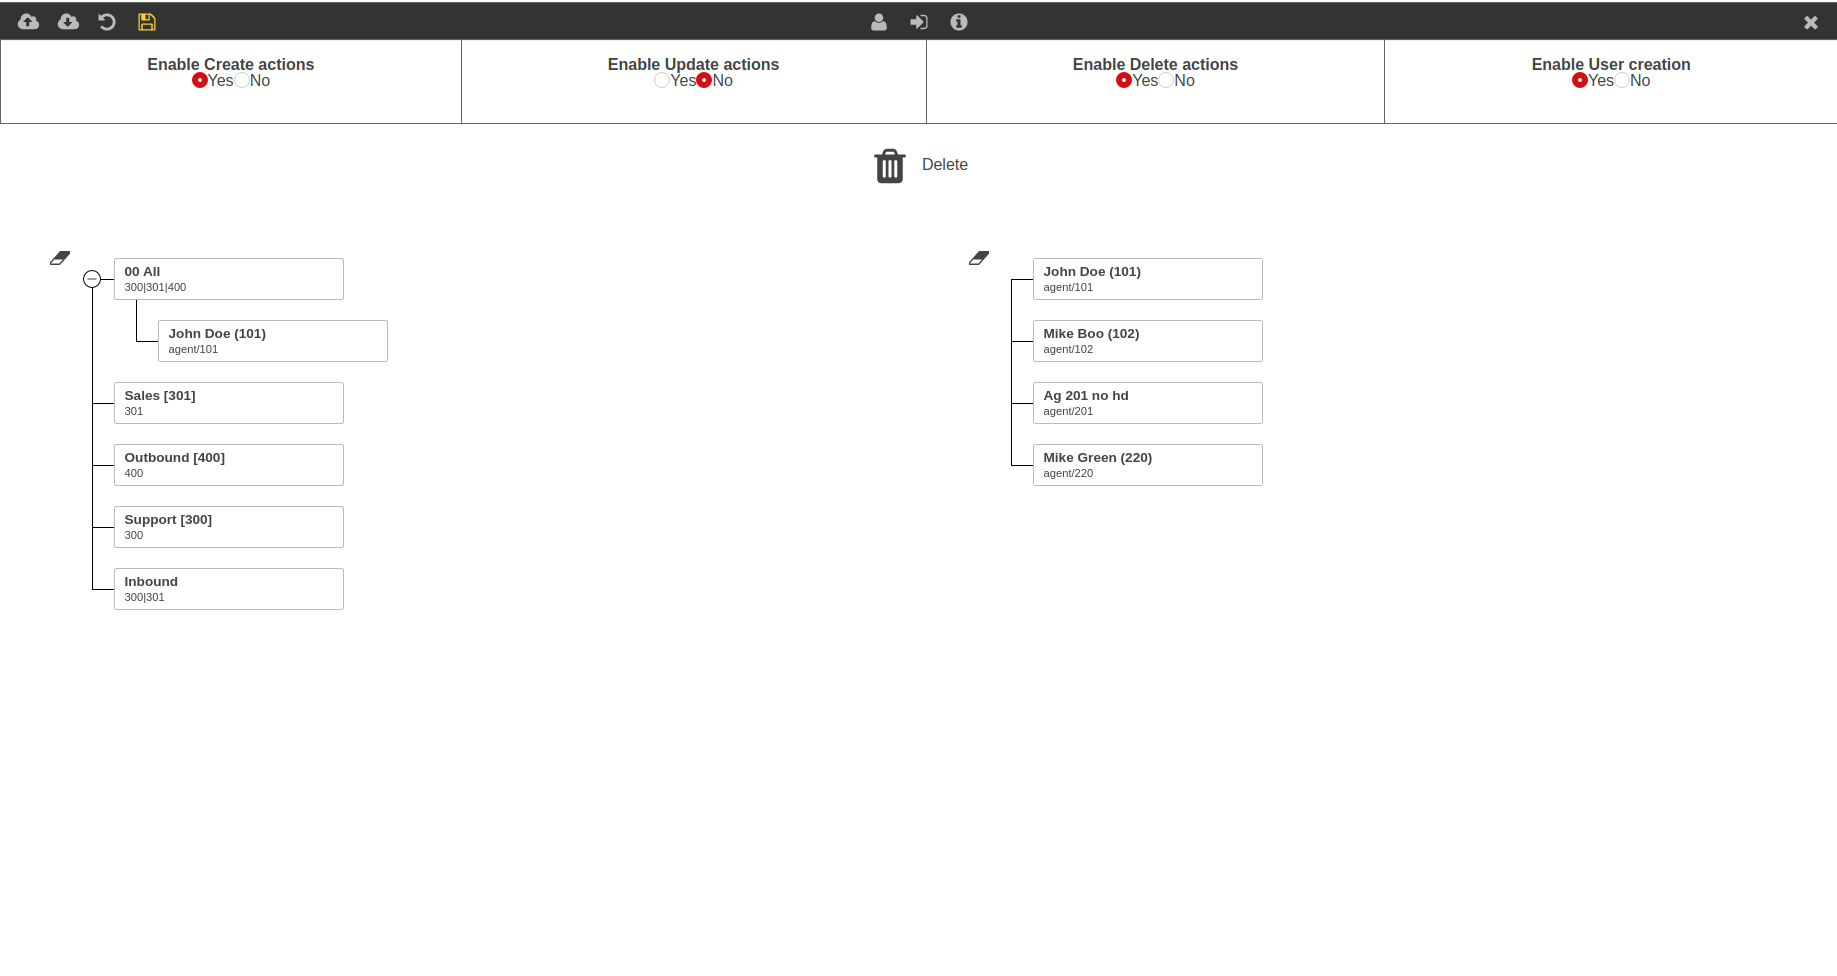 - Allows the user to create a queue.
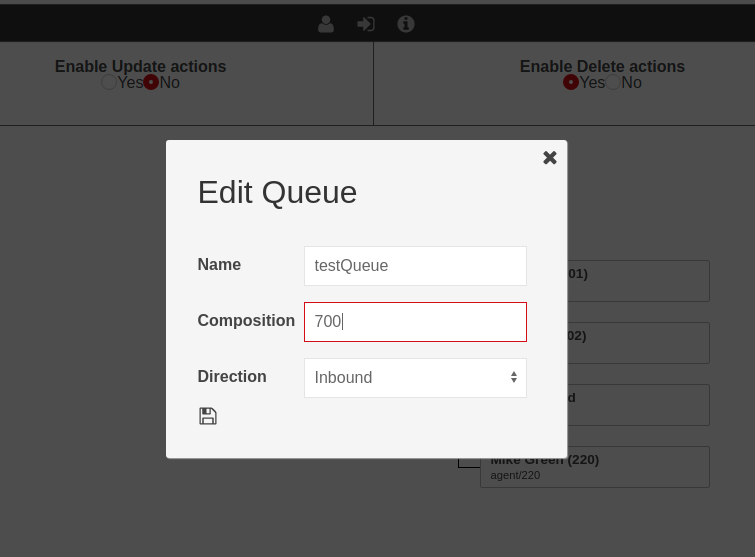 - Allows the user to create an agent.
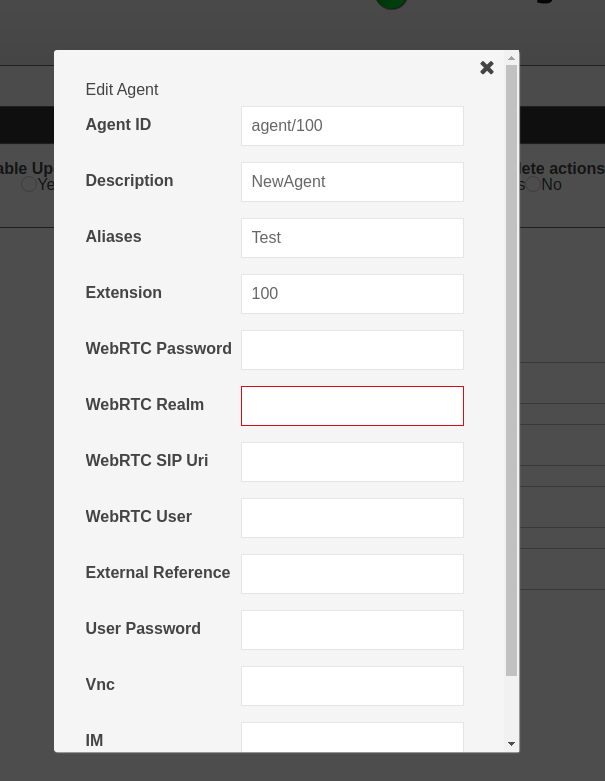 - Allows the user to import a configuration from an external source.
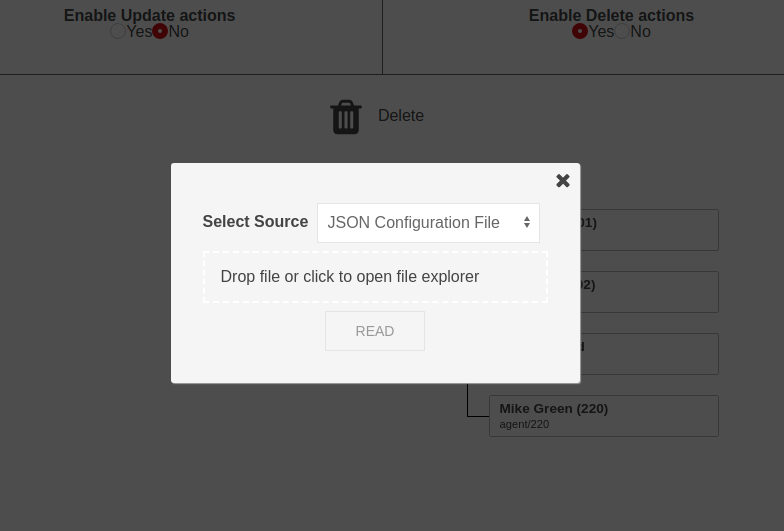 - Allows the user to export a configuration for backup purposes, or to copy on another machine.
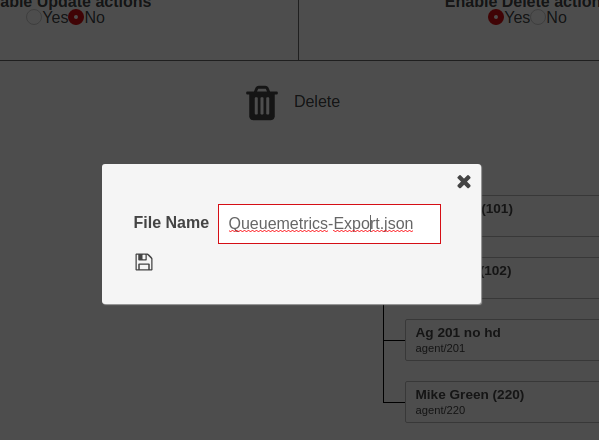 - Allows the user to save the new configuration, applying it to the system.
Sources
The Synchronizer module can read configurations from the following sources:
-
Queue log file.
-
QueueMetrics Database Queue Log table (the data imported from the PBX queue_log file).
-
JSON file
-
URL (that hosts a JSON configuration file)
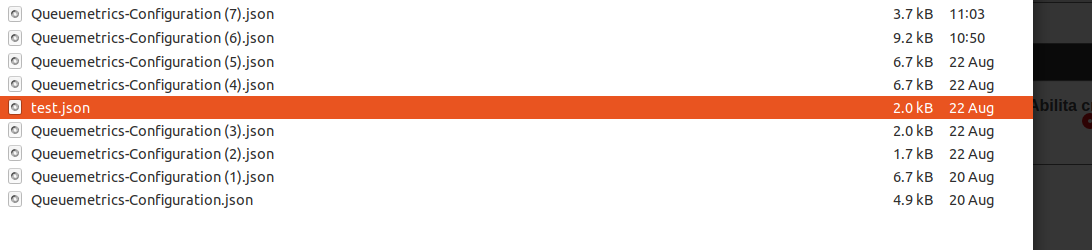
Actions
You can enable and disable different type of actions on the synchronizer page, to make sure that you don’t accidentally create, delete or update objects without meaning to.
You can also enable or disable user creation for new agents, which will create a user for a newly created agent, if missing.

Read Configuration
When a configuration is imported, it will be shown in the Synchronizer page, instead of the current system configuration. You are free to edit it further, before applying it to the system by using the save button on the top left.
Result
Finally, after clicking the save button, the Synchronizer should show the same configuration you have been working on, that is now the current configuration of the system.
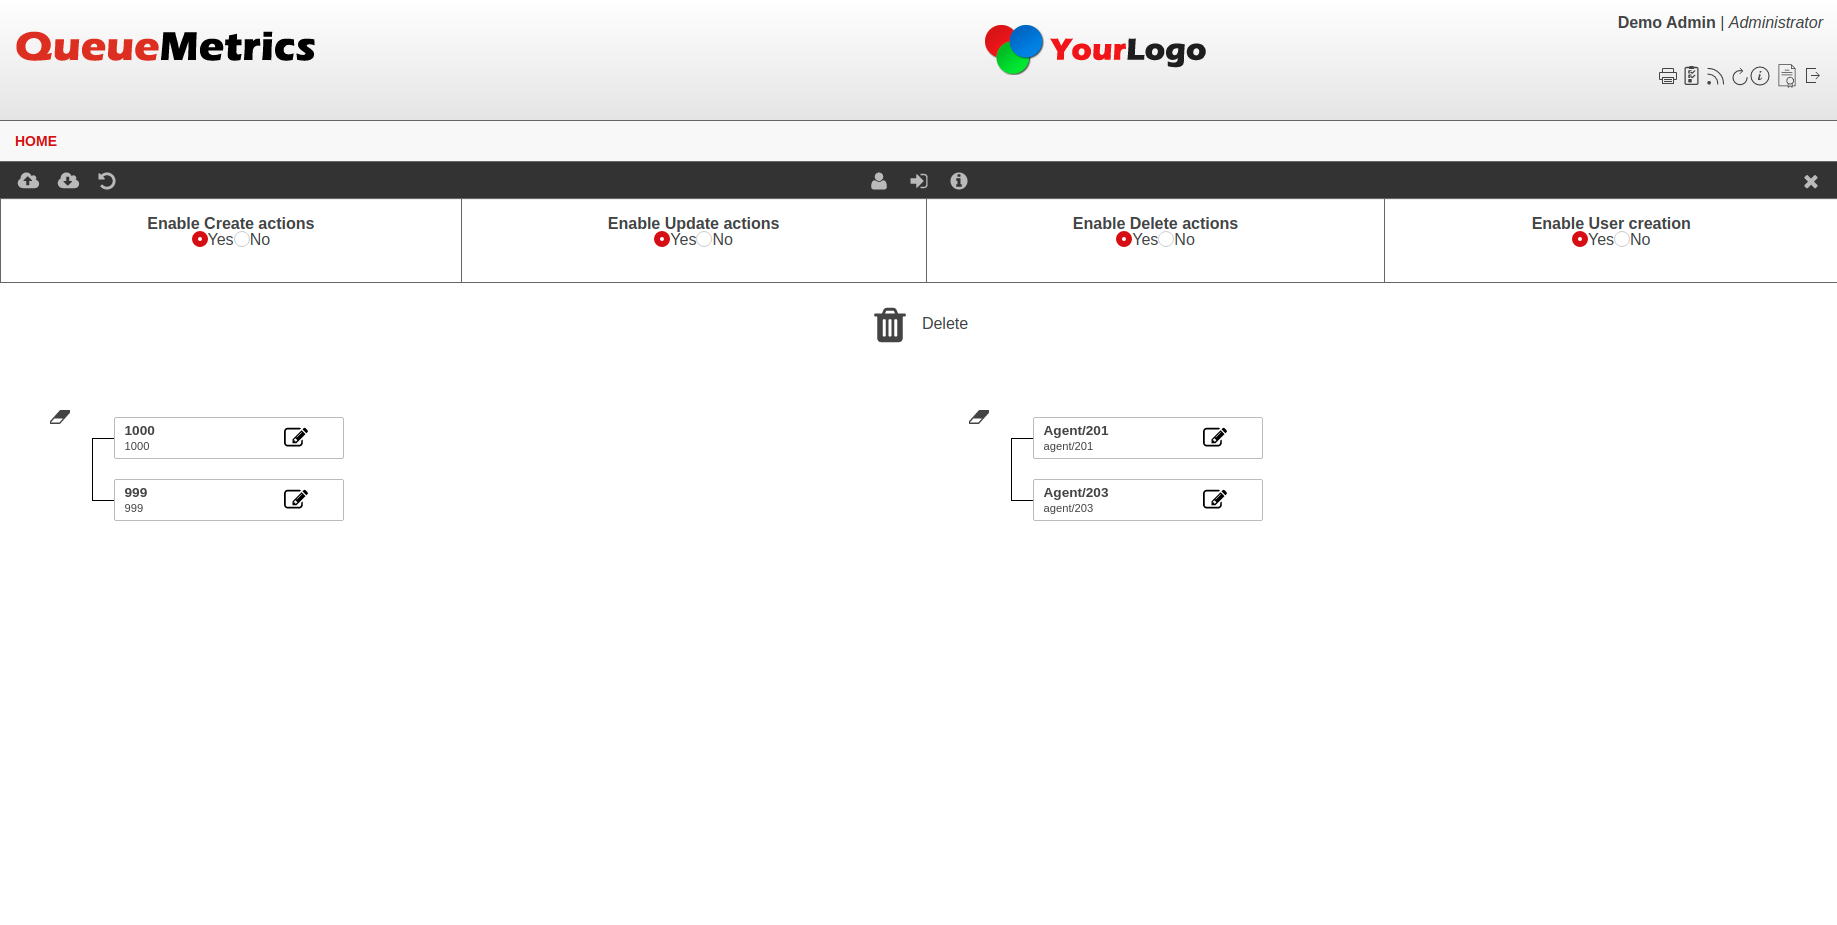
General Actions
From QueueMetrics 19.10.4, you can use the General Actions panel to execute various actions on a group of objects at the same time.
-
Add an alias to all the agents.
| you can use ${num} to add the agent code (eg 200 if the agent is agent/200) to your alias. You can use ${descr} to add the agent name to the alias. |
-
Link all agents to one queue
-
Unlink all agents from a queue
-
Link one agent to all queues
-
Unlink one agent from all queues
-
Link all agents to all queues
-
Unlink all agents from all queues
QueueMetrics Themes
Since QueueMetrics 20, the User Information page will allow each user to select his own theme, based on a selection of available themes.
System administrators are able to set a default theme for all users, by setting the following system property:
default.selectedTheme
This property decides the default theme for ALL users.
Example values for the property are:
default.selectedTheme=default
or
default.selectedTheme=dark
where default, dark are Theme IDs.
If the propery is empty for whatever reason, it will always revert back to the value "default".
If the theme name is not available to the user (For example the name is spelled wrong, the "default" theme does not exist, or the selected theme was removed), then a fallback theme will be provided (See Below).
Currently selected theme
The currently selected theme is stored in the cookie "theme", that is persisted indefinitely (99999 days). If the cookie is not present, the default theme specified in the system property default.selectedTheme will be returned.
If the theme specified in the default.selectedTheme property, is not present in the list of themes available to the user, a fallback theme will be determined, by taking the first theme in alphabetical order (of the description, not of the code) from the available themes list. This list is made up of all the themes that have a theme.properties file in the themes folder.
If for some reason, no theme is available, the fallback theme will be "default".
The fallback order is thus the following:
cookie ("theme") ⇒ default.selectedTheme (if available) ⇒ first available theme ⇒ "default"