Installing QueueMetrics
QueueMetrics is able to operate in various server configurations in order to meet all your needs.
Depending on how big is your system you might want to have a single-server solution (Asterisk and QueueMetrics on the same server), a separated-server solution (Asterisk and QueueMetrics reside on two different servers) and a cluster solution (one QueueMetrics server monitoring many Asterisk servers).
QueueMetrics is a web application, so it runs on a server and is accessed through a web browser. There is nothing to install on clients; you just need to share the main URL where QueueMetrics is available.
QueueMetrics targets current "evergreen" browsers, so it works with Chrome, Firefox, Edge and Opera; IE 11+ and Safari 9.1+. It works on desktop systems, tablets and mobile devices.
The QueueMetrics server needs outbound HTTP connections to the Internet in order to work. If needed, it can be set up to use a proxy where direct connectivity is not possible.
Understanding How QueueMetrics Works
All the data which QueueMetrics works on are stored in Asterisk’s queue_log file. In a single-server configuration, QueueMetrics is able to read directly from this file, though this is not an efficient approach.
The Uniloader provides an effective way to retrieve information from the queue_log file without overloading the Asterisk server(s) and it’s essential in a cluster-server configuration (also, it contains a wealth of tools for debugging/testing).
It reads the new data from the queue_log file and sends it to the
QueueMetrics database wherever it is.
We always suggest to use the Uniloader whatever configuration you
have.
Installing QueueMetrics with Espresso
If you are setting up a single-server solution on an Asterisk-ready Linux distribution (eg. FreePBX, but also many others) you can get a working QueueMetrics system in a few minutes.
| Check if the Espresso installer supports your distribution version in the Supported PBXs section at http://queuemetrics.com/manuals/QM_Espresso-chunked . |
Just add our repository and install the package:
wget https://yum.loway.ch/loway.repo -O /etc/yum.repos.d/loway.repo
yum install queuemetrics-espresso
It will detect your operating system and your Asterisk versions and
configure QueueMetrics to work with them.
It will also install and configure all the other software needed
(Tomcat, MySQL, Uniloader) and creates a working AMI connection to
Asterisk.
Now you can point your browser to http://hostname:8080/queuemetrics and
start working.
| The default username is `demoadmin' and the password is `demo'. |
Installing QueueMetrics manually
With this step we are going to install QueueMetrics on a server, though it still need to be configured in order to work.
On a RPM-based distribution
Just add our repository and install the package:
wget https://yum.loway.ch/loway.repo -O /etc/yum.repos.d/loway.repo
yum install queuemetrics
Now, install the Uniloader in each of your Asterisk boxes.
wget https://yum.loway.ch/loway.repo -O /etc/yum.repos.d/loway.repo
yum install uniloader
Installing QueueMetrics using Docker (for any distro and OS)
Docker is an infrastructure-management tool that lets you run software "as-if" it was running on a dedicated VM, without the administrative and technical overhead of running a separate VM.
Docker makes your life very easy if you need to manage multiple copies of QueueMetrics - you just run them. Docker makes it very easy to install QueueMetrics, no matter what the underlying OS is - the Docker image contains QueueMetrics with all its dependencies, a MySQL server and all the needed tooling.
And when you need to upgrade, you just terminate the old instance and start a new one pointing to the same data - it just works.
| Even if Docker makes your life easier, you need to familiarize yourself with it before you consider running a production service on it. |
Installing the official QueueMetrics Docker image
Create a data container
The first thing you have to do is to create a place to store persistent data - this might be a directory on your disk or what Docker calls a "persistent data-only volume".
The easist way to get started is to use a local directory. Let’s say you create a directory called '/opt/qm1data' for QM to store its data in.
Start the QueueMetrics image
You can easily start QueueMetrics with the syntax:
docker run --name=QM1 --volume=/opt/qm1data:/data -P -d loway/queuemetrics
If you do, Docker will download the current version of QueueMetrics from Docker Hub and will run it. The proces typically takes only a few seconds.
When done, you can issue a "docker ps" to see what is happening:
# docker ps
CONTAINER ID        IMAGE                COMMAND             CREATED             STATUS              PORTS                     NAMES
7c2920e8e28f        loway/queuemetrics   "/ww/run"           12 seconds ago      Up 10 seconds       0.0.0.0:32770->8080/tcp   QM1
This means that if you connect to your server as 'http://server:32770/queuemetrics' (as written under the PORTS column) you will access your new QueueMetrics instance. You can see that the MySQL database and QueueMetrics configuration and license are visible under '/opt/qm1data'.
If you want, you can run multiple instances of QueueMetrics on the same machine:
# docker ps
CONTAINER ID        IMAGE                COMMAND             CREATED             STATUS              PORTS                     NAMES
7c2920e8e28f        loway/queuemetrics   "/ww/run"           12 seconds ago      Up 10 seconds       0.0.0.0:32770->8080/tcp   QM1
c152da318fe2        loway/queuemetrics   "/ww/run"           17 seconds ago      Up 16 seconds       0.0.0.0:32769->8080/tcp   QM3
6fef35c26c6d        loway/queuemetrics   "/ww/run"           48 seconds ago      Up 46 seconds       0.0.0.0:32768->8080/tcp   QM2
as long as each of them points to a separate data volume and has a proper license key.
Accessing an instance using the shell
You can enter the QM1 instance by running:
docker exec -it QM1 bash
This will run a bash shell, and you can do whatever you want - install RPM packages, inspect the system, check error logs, make backups using mysqldump (see Backing up).
| Keep in mind that all data that is not stored under '/data' is stored in the main image, and the main image will be removed on restart/upgrades. |
Terminating an instance
To terminate one instance:
docker stop QM1
docker rm QM1
Everything will be removed, but the contents of your data folder.
Using a data-only volume
If you prefer, you can run QueueMetrics using a named data-only volume:
docker run --name=MYQM loway/data true
docker run --volumes-from MYQM -P -d loway/queuemetrics
This is very similar to using the local directory, though it makes your life harder to just check what is on the volume.
If you do not start QueueMetrics with a data container, it will create one within the current disk image - but when you throw away the image, all data created will be lost.
Installing in Secure Mode
QueueMetrics can be installed in "secure mode" by setting a configuration property layout.secureMode=true. This mode is meant for systems that are to be exposed to the internet or accessible to a wider audience, and implement a number of security mitigations.
Under this mode:
-
Security enumeration of users is disabled. All failed logins expose the same error message, as not to give away whether a user exists and the password is wrong, or the user is locked, or non existent.
-
HTTP session-ids appear on the system log viewer in an abridged format, e.g. session cookie"80EFB4F8317A80CBF59F17A2D1888407" will appear as "80EFB4…888407", as not to make it possible to retrieve usable session IDs.
-
Verbose error messages are disabled. The only message displayed is a
Reference-id: XA6T23Tthat can be used to find the actual error on system logs. -
The login page is de-branded. This forces the login page just to display the log-on form and the welcome message you set. No logos, product versions or external links will be shown. This will happen on all pages if the user is not logged on. (as per ISO 27001 section 11.5.1)
Upgrading QueueMetrics
In order to do an upgrade, you must have started the original instance using a data volume or a shared folder.
If you did, you first download the new QueueMetrics image, then you stop (and remove) the current version and then run the image again using the same data folder:
docker pull loway/queuemetrics:latest
docker stop QM1
docker rm QM1
docker run --name=QM1 --volume=/opt/qm1data:/data -P -d loway/queuemetrics
At this point, it will just work.
Please note that system logs, the compilation cache and everything else that is not in your persistent data folder will be deleted.
Tips and tricks
Defining a fixed QM port
If you want an instance to use a fixed port (e.g. because you have a proxy in front), you can easily do that using the syntax:
docker run --name=QM1 -p 12345:8080 -P -d loway/queuemetrics
This will use local port 12345 and redirect it to the instance’s port 8080.
Configuring memory and time zones
The default QueueuMetrics instance runs with just 128M of Java heap - not enough to run a large production server. You can tune the amount of memory the Java machine is to use by setting the "memory" parameter as shown below:
docker run -e CFG='{"memory":400,"timezone":"GMT"}' --name=QM5 -P -d loway/queuemetrics
As you can see, the same works to set the instance’s time zone, if it were to be different from the one your server is using.
Configuring QueueMetrics properties
You can configure a QueueMetrics instance in many ways:
-
Accessing it through your browser and configuring it
-
Editing the contents of the data directory
-
Using the QueueMetrics JSON services to create users and queues, and deploy a valid license
Though the third option is the most practical if you need to deploy a large number of instances, all three options are quite feasible.
Configuring QueueMetrics
Now that you have got QueueMetrics running you need to configure it in order to retrieve data from Asterisk.
Uniloader configuration
On the Asterisk system, edit the file /etc/sysconfig/uniloader; you
need to set the following values in order to tell Uniloader to work with
the local QueueMetrics database:
URI="mysql:tcp(127.0.0.1:3306)/queuemetrics?allowOldPasswords=1"
LOGIN=queuemetrics
PASS=javadude
TOKEN=P001
If you’re running an Asterisk server cluster you also have to modify the TOKEN value, giving to each of them a different partition name (usually P001, P002, P003, etc). This is fundamental to avoid any possible concurrent writing issue.
| Each Asterisk server’s Uniloader MUST use a different partition. |
Now restart Uniloader:
service uniloader restart
If Uniloader is on a different machine that QueueMetrics (and MySQL) you will need to create a new database user able to connect remotely.
Log in where MySQL is as root:
# mysql -uroot -p
One you’re in create a new remote user and give it all grants on the queuemetrics database:
mysql> CREATE USER 'queuemetrics'@'%' IDENTIFIED BY 'javadude';
mysql> GRANT ALL PRIVILEGES ON queuemetrics . * TO 'queuemetrics'@'%';
mysql> FLUSH PRIVILEGES;
and then set the correct database in the URI parameter of Uniloader.
| Uniloader is very flexible and has multiple data upload modes, plus it can perform many functions. See its manual at https://manuals.loway.ch/Uniloader-chunked/ |
QueueMetrics configuration
If you have a single Asterisk server and have not modified the TOKEN value in the Uniloader configuration add (or, if exists, modify), in the configuration.properties file, the following values:
default.queue_log_file=sql:P001
callfile.dir=tcp:admin:password@ip-address
        # user:pass are the credentials for the Asterisk's AMI interface.
        # You might have to configure a user in each of the
        # Asterisk servers' /etc/manager.conf file.
        # serverhost is the IP address of that server.
QueueMetrics is now already able to retrieve information from
Asterisk.
Instead, if you have a server cluster add or modify these values as
follows:
default.queue_log_file=cluster:*

# Put here the server names (A, B, C, etc could be a choice) separated
# by a pipe.
cluster.servers=A|B|C

# For each of them put these values, replacing 'servername' with
# the name chosen above
cluster.servername.manager=tcp:user:pass@serverhost
        # user:pass are the credentials for the Asterisk's AMI interface.
        # You might have to configure a user in each of the
        # Asterisk servers' /etc/manager.conf file.
        # serverhost is the IP address of that server.
cluster.servername.queuelog=sql:partition-name
        # partition-name is the value of PARTITION in the Uniloader's
        # configuration file in that server.
Include QueueMetrics dialplan in Asterisk
Now, to enable QueueMetrics to place calls and log the agents on and off the queues you need to include the QueueMetrics dialplan in Asterisk. If you installed QueueMetrics with yum, you can find it in /usr/local/queuemetrics/qm-current/WEB-INF/mysql-utils/extensions-examples/extensions_queuemetrics_18.conf.
Copy the file under /etc/asterisk/ then add the following line at the end of your extensions.conf, or extensions_custom.conf if your PBX has this file:
#include extensions_queuemetrics_18.conf
Then open the Asterisk CLI and reload the dialplan:
Asterisk CLI> dialplan reload
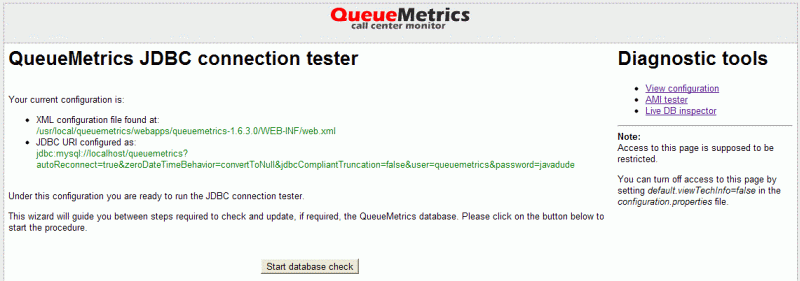
Does it work?
QueueMetrics has some test tools to check if all is running the right
way and for troubleshooting.
The System Diagnostic Tools page offers a number of tools that check
database and AMI connections and more (see Troubleshooting).
To check that everything works you can open your browser and point
it to http://hostname:8080/queuemetrics, the first time you run it you
might get an error, it will disappear in a few seconds and QueueMetrics
will guide you through the database configuration; probably you’ll just
need to confirm without make any change.
After that you will be able to log in with the default username
demoadmin and password demo.
Obviously, at the the moment, no data is shown.
Applying a License
If you have a QueueMetrics license key you can apply it from the license
page by clicking on Install new license key. You have to be logged as an
administrator user.
Alternatively you can modify the LICENZA_ARCHITETTURA parameter in the
/usr/local/queuemetrics/tomcat/webapps/queuemetrics/WEB-INF/tpf.properties
file.
Troubleshooting
QueueMetrics is not available
Often this is a firewall problem. First of all, check if QueueMetrics is running:
lsof -i -P | grep 8080
If it returns something then QueueMetrics is running; if so, do try temporarily stopping the firewall:
service iptables stop
Now retry pointing your browser to http://hostname:8080/queuemetrics.
If it works now, you should setup your firewall in order to accept incoming connections to port 8080.
Editing the configuration.properties file
The configuration.properties file is located in the system path but you
can edit it from QueueMetrics interface clicking on Edit system
parameters.
When you modify this file, always remember to log out and log again in
QueueMetrics to reload the configuration.
The System Diagnostic Tools
QueueMetrics has some tools that help you to solve most of the possible
issues.
You can find them clicking on System Diagnostic Tools or pointing your
browser to http://hostname:8080/queuemetrics/dbtest/.
-
View configuration: this page lets you know what configuration properties are used by Queuemetrics and the JVM.
-
AMI tester: it’s useful to test to have a working AMI connection with the Asterisk server(s).
-
Live DB Inspector: use it if you want to check QueueMetrics is receiving the correct data from the Asterisk server(s).
-
RAM caching: it allows you to look at the QueueMetrics caching stats and to clean the cache when necessary.
You can have a full description in chapter Using the DbTest Diagnostic Tools.
Using an HTTP/S proxy
QueueMetrics needs to establish direct HTTP outbound connections:
-
to validate the current license.
-
to access external services (e.g. JSON audio searching, external user auth, OAuth authentication)
If such connections are unavailable, then QM will not even start up (the Java process will start, but the GUI won’t become available).
As in some corporate environment, direct outbound connections are not possible, so you need to use an intermediate proxy.
The JVM has a standard way to set up HTTP proxies, by setting the JVM properties:
-Dhttp.proxyHost=10.10.1.1 -Dhttp.proxyPort=8888
-Dhttps.proxyHost=10.10.1.1 -Dhttps.proxyPort=8888
In the example above, you tell QM to use a proxy located at address 10.10.1.1 on port 8888
that handles both HTTP and HTTPS traffic.
Or, to set up a SOCKS proxy:
-DsocksProxyHost=1.2.3.4 -DsocksProxyPort=63080
You will need both HTTP and HTTPS proxy access, as license validation happens over HTTPS.
If you installed through the RPM, the right place to set those properties
is in the file /etc/sysconfig/qm-tomcat6 - add them to the end of JAVA_OPTS and restart QM.
|
To check whether connectivity is working correctly, and to test the different
Java parameters that you can set in JAVA_OPTS, you can use a script called
checkLicenseConnectivity.sh that can be found under WEB-INF/README/.
For example, to check connectivity with no proxy, you would simply run:
# ./checkLicenseConnectivity.sh
============================================================
  Attempting connection to the Loway licensing servers
============================================================

No proxy configuration settings
============================================================
   All went well.
============================================================
While to attempt using a SOCKS proxy, you could for example try:
# ./checkLicenseConnectivity.sh -DsocksProxyHost=127.0.0.1 -DsocksProxyPort=63080
============================================================
  Attempting connection to the Loway licensing servers
============================================================

Proxy configuration:

 |Property      |Value    |
-+--------------+---------|
0|socksProxyHost|127.0.0.1|
1|socksProxyPort|63080    |


Feb 04, 2022 9:21:44 AM it.loway.tpf.web.LowayHttpClient connect
SEVERE: Error accessing license server
java.net.SocketException: Connection refused (Connection refused)
    at java.net.SocksSocketImpl.connect(SocksSocketImpl.java:435)

============================================================
  Connection failed:
Error accessing HTTP URL
============================================================
Version numbering scheme
Since January 2012, QueueMetrics uses a numbering system that is based on when a major release is built. The version is then year plus the month of the release. So 12.01.1 is the first in the family that was released in January 2012. See how easy that is? It is also nice because then you know exactly how old or new the version you are dealing with is.
Older versions of QueueMetrics had a "classical" numbering scheme, as per 1.2.3. There is no change on the licensing keys or anything else from the old to the new numbering scheme.
Backing up QueueMetrics
The current state of a working QueueMetrics system is held in two places:
-
its configuration files, containing:
-
the current license and database connection (stored in file
WEB-INF/tpf.properties) -
the general system configuration (stored in file
WEB-INF/configuration.propertiesandWEB-INF/agaw.properties)
-
-
its database (usually named
queuemetrics), containing everything else, including call data and audit logs.
Therefore, in order to back up a running system, you need to:
-
back up the original install file (e.g. RPM file, TGZ, Docker image or whatever you used to install). Recent versions of QueueMetrics are always available from Loway, but older versions are removed. You may also simply back up the whole webapp, that will contain all of QueueMetrics plus its configurations.
-
back up the configuration files, and
-
back up the database
In order to back up the database, you may simply run:
mysqldump queuemetrics | gzip > queuemetrics.sql.gzto create a compressed database dump, and:
gunzip --to-stdout queuemetrics.sql.gz | mysql queuemetricsto reinstall it.
As the database might be very large, before you attempt a backup, you must be sure that you have enough disk space to store it in full. The Live Inspector page allows you to see how large the database is on disk, and estimates how large its compressed data might be.
If space is at premium on the QueueMetrics server, you may perform a full backup from a different server
by telling mysqldump to connect remotely, and using scp (or a similar tool) to copy files.
|
Resolving damaged indexes
Sometimes, the database will refuse to use an existing index. This may happen is the index file is broken (e.g. full disk, unclean shutdown, crashed tables) - though sometimes this happens for no apparent reason.
You will notice that operations take a lot more to complete - a report that took a second or two starts taking a few minutes to run - and that all the load in on MySQL/MariaDB and/or disk access.
The easiest way to solve the issue, if you are not a MySQL/MariaDB expert, is to:
-
Stop QueueMetrics and Uniloader
-
Make a database backup
-
Drop and create the database (existing permissions will be kept, so you don’t have to create them again)
-
Import the backup - data will be inserted from scratch, and all indexes will be rebuit
-
Restart QueueMetrics and Uniloader
E.g.
service uniloader stop
service queuemetrics stop

mysqldump queuemetrics | gzip  > queuemetrics.sql.gz
echo "drop database queuemetrics; create database queuemetrics;" | mysql
gunzip --to-stdout queuemetrics.sql.gz | mysql queuemetrics

service queuemetrics start
service uniloader start
Make sure that you have enough disk space for the backup to complete successfully, and run this off-hours, as a very large database might take hours to backup and rebuild.
Updating from a previous version of QueueMetrics
If you choose to update from a previous working version of QueueMetrics:
-
Make a full system backup, as explained in Backing up.
-
Unpack the new version of QueueMetrics
-
Copy the old files tpf.properties, agaw.properties and configuration.properties so your licence and preferences are preserved
-
Restart the servlet container
-
Run the DB tester
-
From the DB tester, run the database update utility
-
Once the database update utility reports a success, you’re ready to log-in to QueueMetrics
Automatic update using yum
If you originally installed QueueMetrics using yum, you can upgrade your system using yum as well.
-
Make a full system backup, as explained in Backing up.
-
Type the following command:
yum update queuemetrics
and follow the update process. Yum will check if a newer version is available and will install it.
-
Restart QueueMetrics by entering:
/etc/init.d/queuemetrics restart
-
Point your browser to
http://127.0.0.1:8080/queumetrics/dbtestand check if the database is consistent. If there are changes that need to be made to the old database schema, the database update utility (see below) will handle them automatically. -
If some configuration is missing , manualy copy the files tpf.properties, agaw.properties and configuration.properties as needed.
The database update utility
QueueMetrics ships with an utility that makes it very easy to check and upgrade an existing database to the latest version used by newer versions QueueMetrics.
| Before running the update utility, make sure you have a backup of the QM database, as explained in Backing up! |
You can access it directly pointing your browser to http://127.0.0.1:8080/queuemetrics/dbtest/
Once you access the DB updater, it will check and update the database and then optimize it for maximum access performance. This may take a while if you have a lot of queue_log data loaded into it.
From this very page, you can also check a number of system properties through the so-called DbTest Diagnostic Tools:
-
The current QueueMetrics configuration.properties settings
-
The Java environment used
-
The Java memory and CPU settings
-
Whether the AMI connection to the Asterisk is working
-
The current Asterisk configuration
-
The current MySQL storage data (with search ability)
For further details, see the complete description of the DBTEST module.
| As this page lets you acces the inner configuration of QueueMetrics, it should be turned off on publicly accessed systems. This can be obtained by setting a configuration parameter as detailed on the DBTEST page itself. |
Installing a licence key
QueueMetrics ships with a limited evaluation key that lets you use the system freely with up to two agents. If you need to evaluate with a larger call center, you will be sent a temporary key that will process as many agents as needed. The same happens when you decide to buy the product.
The key is a single long hexadecimal sequence with minuses in the middle and looks like the following string:
012345678-0987564D-3C082EF8-012345678-0987564D-3C082EF8
The length of the key may vary according to the features needed.
Once Loway sends you the temporary or official key, you can install it either through the graphical interface or manually through a shell.
What about licenses?
QueueMetrics is licensed based on:
-
the number of agents it needs to track
-
the number of PBX servers you want to monitor
-
a specific duration
You need an agent for each separate agent entity you want to keep track of - so if you have two shifts of 20 persons each, you need 40 agents total, no matter how many of them are logged in at once. If your agents change over time and you want to keep track of both present and past ones each using a different code for each, you will have to factor that in as well. So, for most call centers, you will need something that matches the number of paychecks you write every month for call-center agents.
QueueMetrics natively tracks only calls on queues, so any entity that is not answering a queue (or taking part in an outbound campaigns) is not counted. If you use automated outbound tracking, all phones will be tracked and so every one of them will be counted as one agent.
You will need a cluster license if you want to track multiple PBXs at once - whether this happens because you want to view multiple PBXs from the same GUI (e.g. different branches, or different countries) or because you have a high-availability system where calls may be processed in multiple locations. Vanilla QM licenses let you track only one PBX, but it’s possible to have more when ordering the license. See Monitoring clusters with QueueMetrics for further information on clusters.
Each license has a specified expiry date, that is set at creation and cannot be altered. After a license is expired, the system displays an error message and becomes unavailable. Before this happens, it displays a message to remind you when the license is almost expired.
If you need to install multiple QM systems, you will need to order a separate key for each system. For the common case where you have a stand-by system for high availability, you may order it together with its master key and it has a special price.
| If you use a key on more than one system at once, the key may be blocked, the systems will refuse to start and you may incur in a reactivation fee. So don’t do it. QueueMetrics systems need to access the Internet for key validation and will not start if the network is unreachable. |
The AGAW subsystem has its own separate key, that may or may not be included in your order. See The Agent Awareness subsystem (AGAW) for more details.
Installing a new key
Log on to QueueMetrics as "demoadmin" and click on the License page, if you have the correct grants you should see a label called "Install new license key"; click on it.
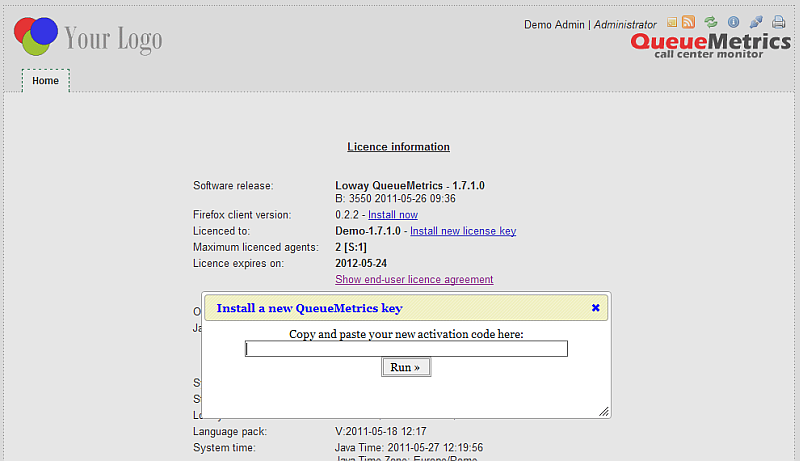
Copy the activation code you received by e-mail into the license box and press "Install". The system will restart in a few seconds (you may see a blank page - if you do, just try and reload). Log off an on again. On the License page you should see the new key.
If you see any errors, follow the manual installation procedure detailed below.
Manual installation of a license key
-
Locate the file WEB-INF/tpf.properties within the QM webapp
-
Edit the file with a text editor
-
Locate the LICENZA_ARCHITETTURA variable and uncomment it if needed
-
Insert your license key as value of the LICENZA_ARCHITETTURA variable.
-
Save the modified file
-
Restart your servlet container
-
Login to QM as usual using your browser
-
Click on the "Licence" label to see your current licence.
When installing using yum, the 'tpf.properties' file is automaticaly copied from the current version to the new one, without the need to do this manually. We anyway suggest that you make a backup of your existing configuration and database before upgrading, just to be on the safe side.
Monitoring clusters with QueueMetrics
QueueMetrics is able to monitor clusters of Asterisk servers, in order to monitor large call centres that are spread over a number of physical machines. This setting is often used for large deployments, as it leads to a number of advantages:
-
The overall call center is safer, as the failure of one single Asterisk box leads to a down of only part of the call center an not its entirety
-
The call center can easily grow to hundreds of seats simply by adding more Asterisk servers, without special optimizations or weird configurations
-
There is less risk of a deadlock on one single Asterisk instance, as the load on each box is kept low enough not to be a problem
In order to implement this, QueueMetrics has been extended to support the notion of cluster, that is a set of Asterisk servers working together as if they were one single box. The cluster can be set up as is better fit, for example:
-
Different queues for each Asterisk box, or
-
The same queues on more than one Asterisk box
-
Some boxes are used for inbound and some for outbound
When QueueMetrics runs in cluster mode, the whole call center is monitored as if it were a big single Asterisk box, and the basic unit for reporting remains the set of selected queues. QueueMetrics will internally query the different servers or queue_log files as needed, and will automatically dispatch events to the correct Asterisk box.
Setting up a cluster
To set up a cluster, you should define the following configuration variables in configuration.properties:
cluster.servers=aleph|trix
This statement tells QM that the current cluster has two members, that are called "aleph" and "trix". We suggest using a short name for each server, as it will appear in many different screenshots. One option would be using the capital letters, like ""A", "B", "C" etc for different members of the cluster.
The name you assign for the each machine is called token when uploading data.
|
For each server (in our case "aleph", but we’ll have to repeat it for all members of the cluster), we will define the following properties:
cluster.aleph.manager=tcp:user:pass@10.10.3.5
This tells QueueMetrics that the manager interface for aleph can be found at 10.10.3.5, logging in as "user" with password "pass". The manager interface is needed to run Live monitoring and can be used to run commands to Asterisk (like logging agents on and off, starting chanspy sessions, etc).
cluster.aleph.queuelog=sql:P001
This tells QM that the queue_log file (or its contents) can be downloaded from partition P001 of the QM database. You must use MySQL storage in order for clustering to work at all.
cluster.aleph.monitored_calls=/share/aleph/calls/
This tells QM where to look for recorded calls on each Asterisk server. This is used by QueueMetrics in order to click-and-listen to recorded calls. A NFS or SMB share is usually a good starting point. As an alternative, you can enter the URL of an XML-RPC server that will return information about the recorded call (for more information on this topic, see Enabling XML-RPC call listening and streaming).
cluster.aleph.callfilesdir=/share/aleph/callfiles/
If you do not want to connect to your Asterisk servers using the manager interface, you still need a way to send it commands (e.g. to start a chanspy session). In order to do this, you should give QM a directory to write callfiles to. If you use the manager interface, leave this entry blank. (We strongly suggest doing so and using the manager interface instead).
cluster.aleph.audioRpcServer=http://myserver/xmlRpcServer
If you use an XML-RPC "broker" in order to used live calls listening using a third-party software like Orecx, you should enter its URL here. This must be activated at once for all servers by not leaving blank in the property default.audioRpcServer. In all other cases, just leave this property blank. (for more information on this topic, see Enabling XML-RPC call listening and streaming).
Actually, all "default" parameters that pertain to audio playback (Pluggable Listeners) are automatically transformed from the form "default" to "cluster.SERVER": for example, in cluster mode, the parameter default.monitored_calls will be automatically read from the property cluster.SERVER.monitored_calls.
|
cluster.aleph.agentSecurityKey=AAA
When using the agent’s page in cluster mode, you must make sure that each agent "points" to the correct server, as this server will be used for both pulling agent’s data and sending logon/logoff commands. This is obtained on the agent’s page through a pull-down menu where the agent must select the correct server he’s logged on to. In order to avoid mistakes, it is possible to protect a server by adding a security key, so that only agents having that security key will see that server. If an agent has only one possible server, that server will be automatically selected. In practice, this means that you could create two agent classes, we call them AGENT_A and AGENT_B. They have the same keys, but in class AGENT_A there is the key SERVER_A, and in the other SERVER_B. We protect each server entry with SERVER_A for the first and SERVER_B for the other. Then we assign users to classes AGENT_A (for agents working on the first server) and AGENT_B (for agents working on the second server). If you want agents to manually switch servers, or your cluster is made up of only one machine, leave this blank.
Setting up your PBXs as members of the cluster
On each box that is a member of the cluster, you should set up the following items:
-
Call recording: if calls are recorded to be played back through QueueMetrics, you should store them all in a directory that is accessible through the QueueMetrics server, or set up an external XML-RPC call broker.
-
Commands: if commands are to be sent to each Asterisk box, you should set up the [queuemetrics] context in the dial plan, and make sure the manager interface is set up or the /vars/spool/asterisk/callfiles directory is shared and accessible to the QueueMetrics server. A sample [queuemetrics] context can be found under WEB-INF/mysql-utils in the directory extensions-examples.
-
Logs: you should use uniloader to upload data to a partition on the main QueueMetrics database. Make sure that each server uploads data to a different partition in the same database, that is, uses a different token. We suggest using the HTTP upload mode, as it is more resilient to errors and just requires HTTP access from the PBX to your QueueMetrics instance. While not recommended, it is possible to override the
tokensettings for a specific user by setting thetokenfor.usersystem property. -
Clock: make sure the clocks on all members of the cluster is synchronized, and the same goes for the clock used on the QueueMetrics box and on the MySQL database. An utility that sync your machine’s clock to an external timing source like ntpdate will take care of this problem if run periodically through cron.
Setting up QueueMetrics to access the cluster
First thing, you should make sure that you have a clustered license for QueueMetrics and that your license is big enough in terms of agents to support all agents that are present in the call-center. Older licenses are valid for one Asterisk server only and QueueMetrics will complain they are not correct.
To report on all members of a cluster, you should set the property:
default.queue_log_file=cluster:*
This means that all boxes defined as members of this cluster will be used a s a data source.
To report on a subset of the members of the cluster, you will use a syntax like:
default.queue_log_file=cluster:A|B|C
This way you will be reporting on boxes A, B and C.
If you want to report only on a single box, the syntax:
default.queue_log_file=cluster:C
Will be appropriate.
You can then change this property on-the-fly by going to the "Custom reports" page and editing as needed under the "File" text box.
If you have agents using QueueMetrics’s Agent’s pages, you should set them up so that each agents points to its correct server.
Using the Agent’s page with a clustered environment
The agent’s page on QueueMetrics acts as a kind of portal for an agent; she can use it to log on, log off, go to pause, enter pause codes, launch external apps linked to a call (e.g. CRM apps) and enter call codes (see The real-time agent page).
As the number of agents can be very high if compared to the number of supervisors who run reports or monitor the call center, QM uses a "minimal impact" policy: the page must be refreshed manually by each agent in order to avoid hammering the server with repeated page hits and the analysis run is a stripped-down, low-fat version of the full analysis QueueMetrics is able to perform. When coming to clusters, this means that to avoid useless load, calls for an agent will be searched only on the server the agent is working on and not on the entire cluster.
Also, we have the problem of defining where an agent is supposed to work: as QM can issue commands to Asterisk on behalf of an agent, it needs to know to which Asterisk server those commands must go. This is obtained by using the Server selection that will appear on the agent’s page if QueueMetrics is running in clustered mode. If more than one server is selectable, the combo box will let the agent switch server as she best sees fit (if only one server is selectable, QueueMetrics will use that server immediately and will make the combo locked).
As a QM installer, you can control which servers are selectable to which agents by setting the properties cluster.---.agentSecurityKey correctly for each Asterisk server in the cluster.
Logging into a server from the Icon Agent’s Page
When working on a clustered environment, an agent is allowed to access only one server at a time. The server selection is usually done through the Agent Logon Panel, where you choose the queues to log on to, the server to use and the agent extension.
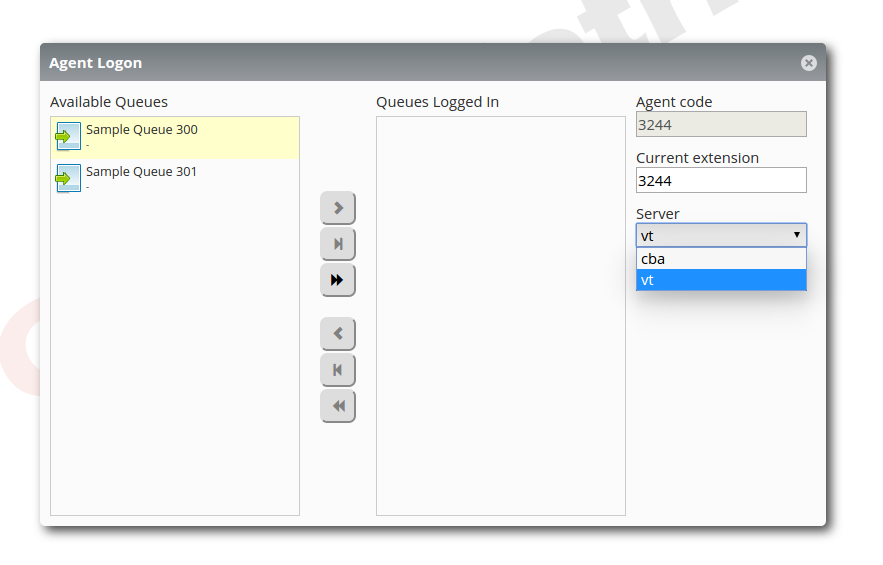
the first time an agent logs into the Icon Agent’s Page though, a special panel will appear that will ask the agent for the preferred server. This can be changed later on from the Agent Logon Panel.
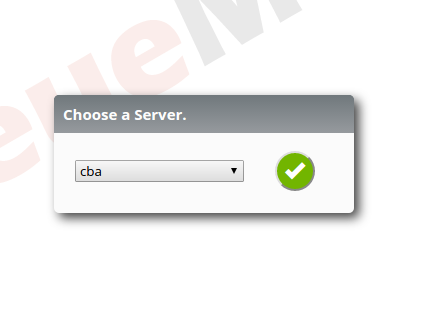
There are some rules that QueueMetrics enforces, that must be understood:
-
An agent can log onto only one server at a time.
-
When the agent is logged onto a queue of a particular server, the server selection will be disabled.
-
If a default server is set for the agent, QueueMetrics will disable the server selection for the agent, therefore the agent will not be able to use a server different from the default server.
To sum it up, an agent will be able to choose a server only if three conditions are met:
-
QueueMetrics is working in Cluster Mode.
-
The agent is not logged onto any queue in any server.
-
Theres is no specified default server for the Agent.
Understanding QueueMetrics memory requirements
To understand QueueMetrics' memory needs, you must consider that the memory requirements are roughly proportional to the width of the analysis and to the number of required events to track. You may think of it as the number of calls plus the number of agent events, i.e. agents logging on and off and setting pauses on and off.
Calls can be restricted by the queue filter, but all agent events in the required time window are tracked. This gives you an idea of the memory usage.
Though the actual memory requirements depend considerably on the actual content of your analysis and the exact brand and version of Java virtual machine that you are running, you should expect to be possible to track about 80,000 calls and 40,000 agent events with a standard 64 megabyte Java VM and Tomcat running.
You can of course start your servlet container with more memory in order to allow more room for larger analyses. The standard way in Tomcat is to pass additional Java parameters is to store them in the environment variable JAVA_OPTS before starting Tomcat.
Typing:
JAVA_OPTS="-Xms256M -Xmx512M -server"
export JAVA_OPTS
And then starting Tomcat will start up a Java virtual machine that has 256 megabytes of available memory and can use up to 512 megabytes, and runs in server mode. Consider that this memory is shared between all QueueMetrics users and all Java web-apps, so the more the better. Those opts are stored in a file called /etc/sysconfing/qm-tomcat when QueueMetrics is installed using yum .
Consider also that Java will never return this memory to the system free memory pool, even when it stops using it. The only way to have this memory returned to the system memory pool is to stop the Java VM and restart it. Therefore, it’s a good idea to perform a scheduled restart of the servlet container, to avoid possible memory leaks and to reclaim now-unused memory to the main pool.
As a last note, the memory footprint of a Java VM may be quite larger than the memory you give it as Java heap space, as it will need RAM space for the VM itself and all its required libraries. Overheads of 50-100 megabytes are not unheard of, depending on the Java Virtual Machine in use.
A more in-depth discussion of QueueMetrics memory usage and live monitoring can be found on the "Advanced Configuration Manual", chapter "Tuning QueueMetrics memory settings".
A real-life example for a large call-center with about 400 agents logged on and running on a dedicated server may be like:
-Xms4096M -Xmx4096M -server -XX:+UseParallelGC -XX:PermSize=512M -XX:MaxPermSize=512M
But the actual optimal configuration on a large system should be determined by running the system for a while under the required workload and monitoring the actual resource consumption.
Understanding basic security mechanisms
Each user accessing QM should have his own user and password. The administrator can easily setup multiple accounts from the administrative interface. All user activity is tagged to the user performing it, so it’s a good idea to give an account to each person accessing the system. Accounts can be created, blocked and revoked in a matter of minutes.
Each feature that QM offers is enabled by a special key, as if there was a padlock protecting it from unauthorized access. The administrator gives each user a key ring that specifies which locks the user can open, and therefore what the user can do. A list of keys used in QM is available in Appendix A: Security keys.
To ease the burden of administering multiple users, keys can be grouped into classes. Each class offers the additional advantage of giving the key ring a label, so that it’s easier to see whether an user is an Administrator, a User or an Agent by looking at the label and not at the very keys s/he holds.
Individual keys can be granted or revoked individually to handle special cases, in addition to the ones anyway present in the user’s class. For more information, see Editing QueueMetrics settings.
A list of default users provided with the standard QM installation and their default passwords can be found in Default users.
Just to be on the safe side, QueueMetrics keeps an 'Audit Log' of all activities that may have security implications; see The Audit log for more details.