Report Details
Reports can be fully configured by deciding which of the following blocks shall be included in each.
QueueMetrics ships with some default reports - feel free to copy or change them to create your own.
-
All reports is a collection of (most) reports that QM can generate. It is meant as a showcase that you will customize.
-
Overview provides a 360-degree view of all call activities on the call center queues. It covers metrics on all calls, answered and unanswered calls by queue, service level agreements, disconnection causes, and detailed session insights for agents. With comprehensive data on call distribution by day and hour, this report serves as an essential tool for evaluating overall performance and identifying areas for improvement in customer service and operational efficiency.
-
Quick Agent Report is a simpèlified view of agent activity during the previous month
-
Quick reports is a very short daily recap meant to be sent by email by setting up a Scheduled Job for automatic export by e-mail.
-
SLA Overview provides a comprehensive overview of service level agreement (SLA) compliance across all queues. It highlights key performance metrics such as response times and percentage of calls answered within a customizable threshold.
-
Recap offers a comprehensive look at the call dynamics within your call center over a selected timeframe. It breaks down the overview of queue calls, provides an hourly summary of answered and lost calls, and details call attempts by each agent, whether taken or lost. This report is ideal for understanding traffic flow and agent activity, aiding in operational adjustments and resource allocation.
-
Recall details focuses on the specifics of customer recalls, providing essential data for follow-up strategies. It includes a recall summary, lists numbers that need to be recalled, and tracks numbers that have already been recalled within the selected timeframe. Additionally, it analyses first call resolution effectiveness and identifies frequently contacted numbers, making it invaluable for improving customer satisfaction and resolution efficiency.
-
Weekly Agent Performance assesses the effectiveness of each agent over a week, detailing call attempts, session activities, pause durations, and availability by hour. It also examines agent productivity through metrics such as queue talk time and answered call distribution across the week. Designed to support performance management, this report helps supervisors recognize achievements and target areas for agent development, aligning efforts with overall call center goals.
A set of more pre-defined reports is available at https://github.com/Loway/Templates/ - and you are welcome to contribuite your own if you create interesting reports or wallboards.
| The GitHub repo also contains the "pristine" version of the reports QM ships with - so if you delete or change one of the example reports, you can restore it from there. |
Historical reports - Answered calls
OK01 - All calls
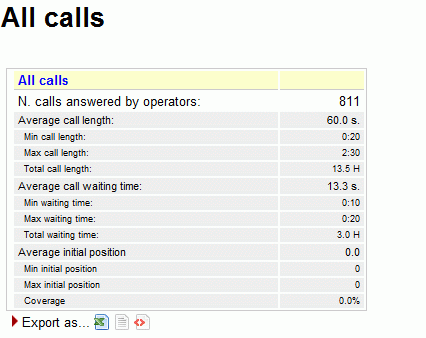
The answered calls section deals with calls that were correctly handled by agents.
The top panel shows:
-
How many calls were handled;
-
The average call length (i.e. time the caller spends talking to an operator);
-
The maximum and minimum call lengths recorded for the given time period;
-
The total call length (for all calls on all operators);
-
The average call waiting time (i.e. the time a caller was waiting on a queue before being connected to an operator).
-
The minimum and maximum call waiting times on record
-
The total waiting time for all handled calls.
-
The average initial position of the call in the queue
-
The minimum and maximum initial queue positions that have been detected
-
The queue position coverage: as this information is not tracked for all calls, this ratio shows the average number of calls that had queue position record.
Available since |
1.6.0 |
Default page |
Answered calls |
Shortcut code |
OK01 |
API block name |
OkDO.RiassAllCalls |
Parameters |
- |
See also |
OK02 - Calls fully within the given time interval
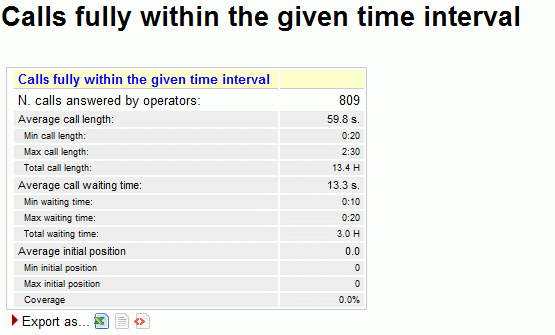
The answered completed calls section deals with calls that were correctly handled by agents. This is similar to what’s reported on previous panel but may exclude calls that were started before or terminated after the given time frame.
Available since |
1.6.0 |
Default page |
Answered calls |
Shortcut code |
OK02 |
API block name |
OkDO.RiassFullyWithin |
Parameters |
- |
See also |
OK01 - All calls |
OK03 - Agents on queue
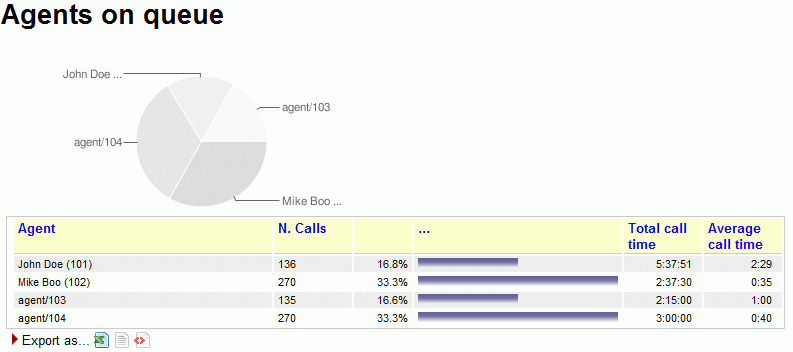
This report shows which agents have been available for the given queue, how many calls each one handled and the percentage of all calls that each one handled.
If calls are connected directly to a phone terminal, QM tries its best to show the corresponding terminal, usually in the format used by Asterisk, like "SIP/303" to signify a SIP phone whose number is 303.
If you connect to H.323 telephones via the OH323 module, the recorded channel names have no meaning and do not refer to a specific terminal; that’s why all OH323 calls are grouped together under the label "OH323/-".
The pie graph shows which agents have been available for the given queue representing the percentage of all calls that each one handled.
Available since |
1.6.0 |
Default page |
Answered calls |
Shortcut code |
OK03 |
API block name |
OkDO.AgentsOnQueue |
Parameters |
- |
See also |
OK04 - Service level agreement
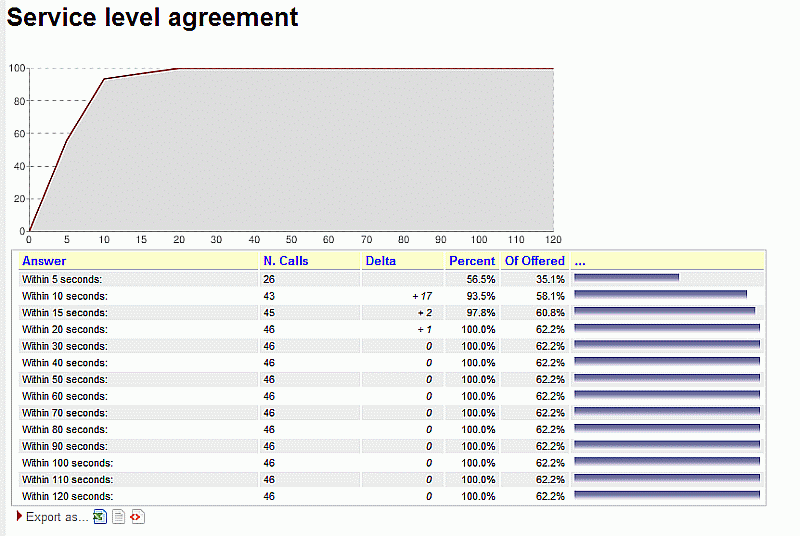
This report shows the distribution of call waiting times. It shows how many calls were answered within a given time frame, usually 120 seconds in 10 second increments (the time frame and increment can be modified by the administrator, if needed - see below).
You get a percentage of how many calls were answered within X seconds; the percentage includes calls answered in a shorter time frame and therefore grows with time.
The "delta" value you see is the absolute increment, expressed in number of calls, between each time frame, while the "Offered" column displays the result of the taken calls divided by the total taken plus the total lost.
This metric is computed only on answered calls, i.e. ignoring lost calls . If your SLA is defined in terms of taken and lost calls, see the corresponding metrics "Inclusive SLA" on Inclusive Service Level Agreement.
The graph reports the percentage of how many calls were answered within X seconds, as reported in the table.
Since 1.6.2, it is possible to configure the time frame and increment separately for an initial period and the rest of the interesting period; in this way it is possible to have different breakdowns, e.g. every 5 seconds up to 20 seconds and every 10 seconds up to 120 seconds. See Configuring system preferences.
For example, by setting:
-
initial_interval=5 and max_initial_interval=20
-
interval=10 and max_monitored_delay=60
You get the following cutoff points: 5, 10, 15, 20, 30, 40, 50, 60 seconds
By setting:
-
initial_interval=3 and max_initial_interval=3
-
interval=5 and max_monitored_delay=60
You get the following cutoff points: 3, 5, 10, 15, 20, 25,… seconds
By setting
-
initial_interval=0 and max_initial_interval=0
-
interval=10 and max_monitored_delay=120
You get the default cutoff points: 10, 20, 30, 40, 50 , 60, 70, 80, 90, 100, 110 and 120 seconds
Available since |
1.6.0 |
Default page |
Answered calls |
Shortcut code |
OK04 |
API block name |
OkDO.ServiceLevelAgreement |
Parameters |
- |
See also |
UN18 UN07 UN06 |
OK05 - Disconnection causes
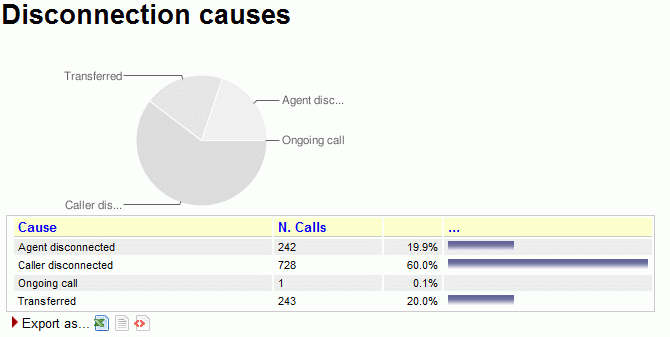
This report shows the reason why calls were terminated; this means that:
-
The agent hung up, or
-
The caller hung up, or
-
The call was transferred outside the queue and the agent was freed again, or
-
The call was ongoing at the time the report was run.
The graph reports the percentage values associated to the reason of why calls were terminated, as calculated in the table.
Available since |
1.6.0 |
Default page |
Answered calls |
Shortcut code |
OK05 |
API block name |
OkDO.DisconnectionCauses |
Parameters |
- |
See also |
OK06 - Transfers
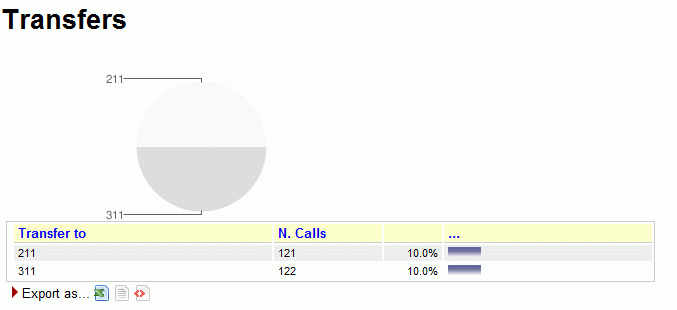
This graph shows how many calls were transferred to each extension in the given time frame. This lets you know who is handling exception calls.
| when a call is transferred outside the queue system, its length is no more recorded by the queue subsystem; therefore you only get to see the length of the call while the agent was on line. |
Available since |
1.6.0 |
Default page |
Answered calls |
Shortcut code |
OK06 |
API block name |
OkDO.Transfers |
Parameters |
- |
See also |
OK07 - Answered calls, by queue
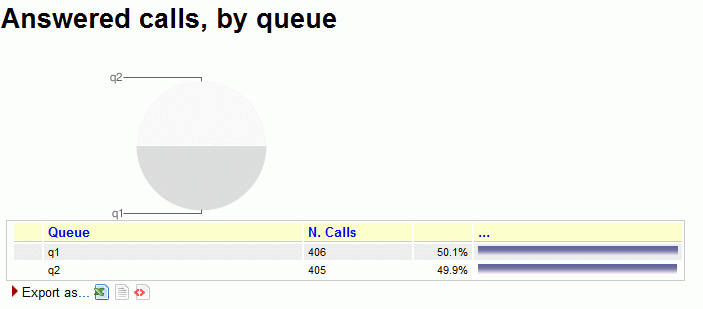
If more than one queue is in use for the report, this table shows the relative magnitude of each queue.
The graph reports the percentage associated to each queue in the table.
Available since |
1.6.0 |
Default page |
Answered calls |
Shortcut code |
OK07 |
API block name |
OkDO.AnsweredcallsByQueue |
Parameters |
- |
See also |
OK08 - Answered calls, by direction
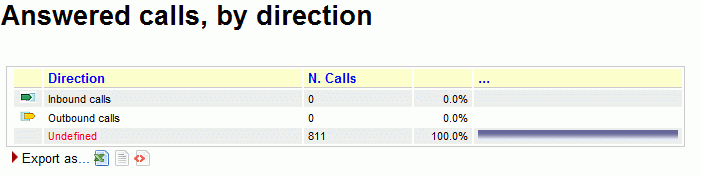
If more than one queue is in use for the report, this table shows the relative magnitude of each queue.
Inbound queues are marked with the symbol
 while outbound queues use the symbol
 .
.
The graph reports the percentage associated to each queue in the table.
Available since |
1.6.0 |
Default page |
Answered calls |
Shortcut code |
OK08 |
API block name |
OkDO.AnsweredcallsByDirection |
Parameters |
- |
See also |
OK09 - Answered calls, by stints
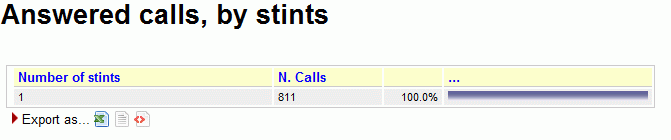
This graph counts the distribution of multi-stint calls on selected queues. If multi-stint mode is not enable, all calls will have only one stint.
Available since |
1.6.0 |
Default page |
Answered calls |
Shortcut code |
OK09 |
API block name |
OkDO.StintsOk |
Parameters |
- |
See also |
OK10 - Queue position
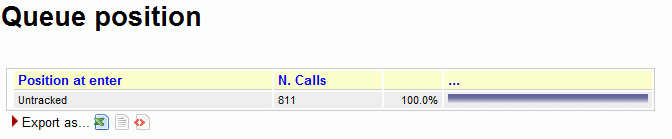
This graph shows the initial queue position that the calls had when they joined the queue. For example, a queue position of 1 means that a call was first in line, of 5 means that a call had four other calls in line before being answered. As the logging of queue positions is a bit inconsistent, some calls might be missing it ("Untracked")
Available since |
1.6.0 |
Default page |
Answered calls |
Shortcut code |
OK10 |
API block name |
OkDO.QPosOk |
Parameters |
- |
See also |
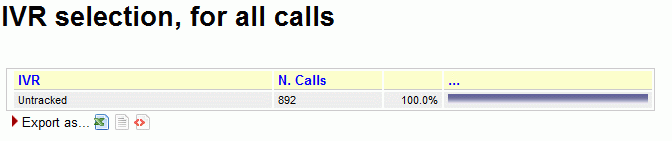
OK11 - IVR selection
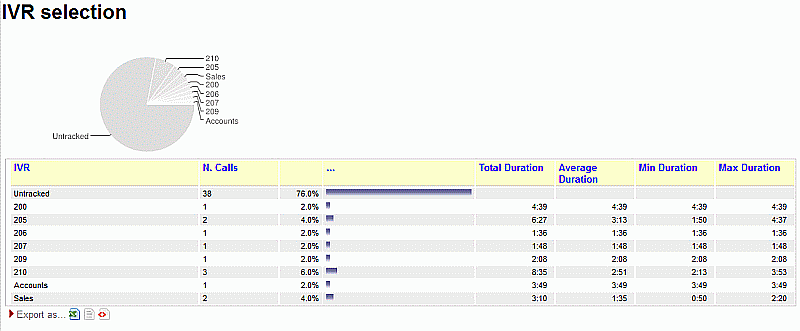
This graph shows the distribution of IVR selections available in the calls processed. We can also see the IVR duration values, which is related to the time that the call was within the IVR before entering the queue.
This must be tracked manually in Asterisk - See "Configuring Asterisk for QueueMetrics" below.
Available since |
1.6.0 |
Default page |
Answered calls |
Shortcut code |
OK11 |
API block name |
OkDO.IvrOk |
Parameters |
- |
See also |
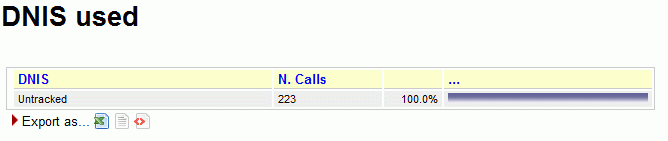
OK12 - DNIS used
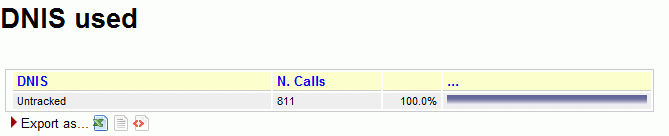
This graph shows the distribution of DNIS lines available in the calls processed.
This must be tracked manually in Asterisk - See "Configuring Asterisk for QueueMetrics" below.
Available since |
1.6.0 |
Default page |
Answered calls |
Shortcut code |
OK12 |
API block name |
OkDO.DnisOk |
Parameters |
- |
See also |
OK13 - Music On Hold by Agent
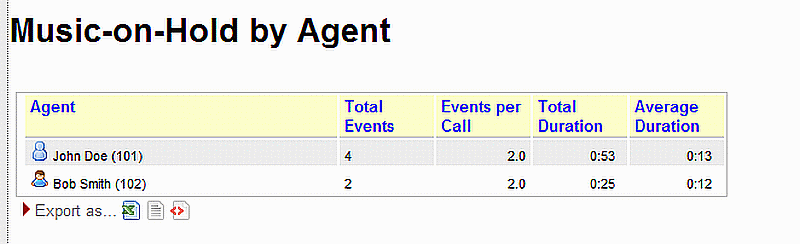
This allows to see the total number of Music on Hold (MOH) events per agent, how many MOH instances took place throughout a call, the average and total duration of MOH events.
This must be tracked manually in Asterisk - See "Configuring Asterisk for QueueMetrics" below.
Available since |
12.2.0 |
Default page |
Answered calls |
Shortcut code |
OK13 |
API block name |
OkDO.MOHOk |
Parameters |
- |
See also |
OK14 - Report Header
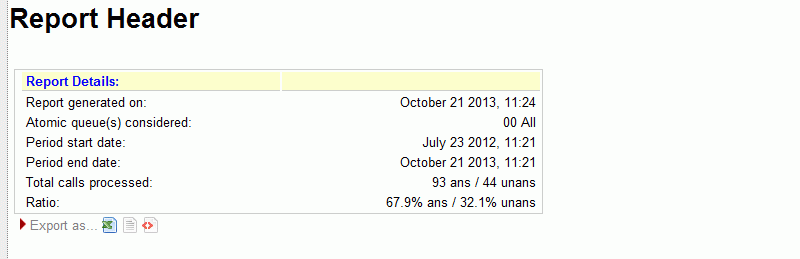
This is the report header and will be added automatically on each tab on the screen and at the beginning of each session in the PDF and Excel report export.
Available since |
13.04.9 |
Default page |
Beginning of each page |
Shortcut code |
OK14 |
API block name |
OkDO.HDRRpt |
Parameters |
- |
See also |
HDRRpt |
OK15 - Required Skills for Taken Calls
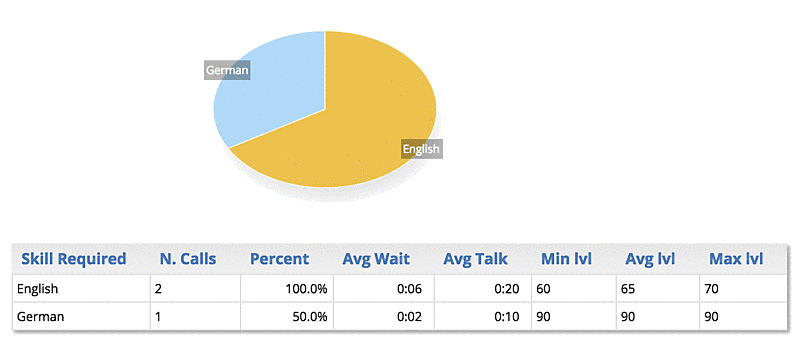
This data block displays the skills that were required for taken calls in the current reports.
As multiple skills may be required for the same call, or some calls may have no required skill, the sum of all skills may be significantly different from the number of calls.
For each skill, the average wait and talk duration of all calls having that specific skill is computed. Plus, the minimum, average and maximum level at which this skill was requested for the specific set of calls is displayed.
Available since |
15.10 |
Default page |
Answered calls |
Shortcut code |
OK15 |
API block name |
OkDO.SkillsOk |
Parameters |
- |
See also |
UN19, UN20 |
Historical reports - Details of answered calls
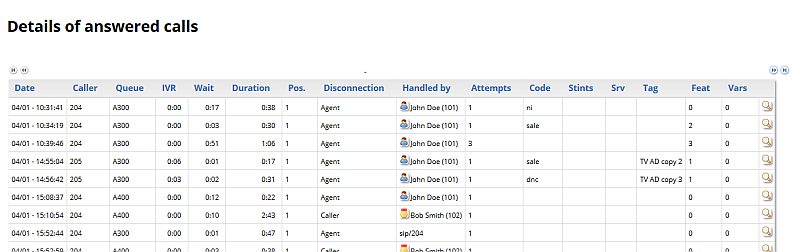
OD01 - Queue details
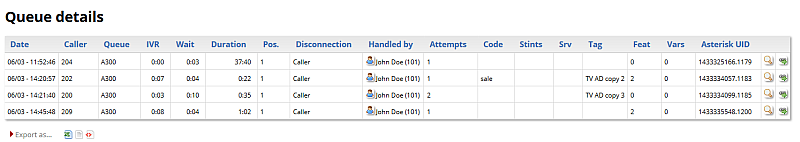
This page shows the detail of answered calls. See Showing call details.
Available since |
1.6.0 |
Default page |
Details of answered calls |
Shortcut code |
OD01 |
API block name |
DetailsDO.CallsOK |
Parameters |
- |
See also |
OD02 - Add to export job
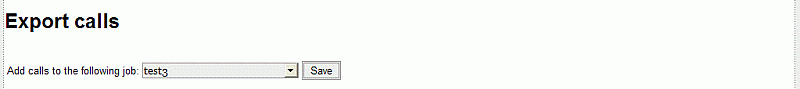
This is a pseudo-block that is used to display a button for call export. The button may not be displayed if the user does not have the correct grants. As it does not actually contain data, it cannot be queried over XML-RPC.
Available since |
1.7.0 - Removed in 20.11 |
Default page |
Details of answered calls |
Shortcut code |
OD02 |
API block name |
- |
Parameters |
- |
See also |
OD03 - Queue details (paged)
This page shows the paged detail of answered calls. See Showing call details.
The details of calls are paged - so you can move back and forth - and you can control which columns will appear on screen. The paged mode uses way less memory and is quicker to use than the full list as in OD01 - Queue details.
When accessing the data source though XML-RPC or printing a report, it is mandatory to use the OD01 block, as this block is interactive and will not render correctly.
Available since |
13.03 - Removed in 20.11 |
Default page |
Details of answered calls |
Shortcut code |
OD03 |
API block name |
- |
Parameters |
- |
See also |
OD04 - IVR details (paged)
This block shows the paged detail of IVR calls. These are calls that did not hit a queue in the current report and thererfore are reported as neither answered nor unanswered.
The details of calls are paged - so you can move back and forth - and you can control which columns will appear on screen. The paged mode uses way less memory and is quicker to use than the full list as in OD05 - IVR details (full list).
When accessing the data source though XML-RPC or printing a report, it is mandatory to use the OD05 block, as this block is interactive and will not render correctly.
Available since |
13.03 - Removed in 20.11 |
Default page |
Details of answered calls |
Shortcut code |
OD04 |
API block name |
- |
Parameters |
- |
See also |
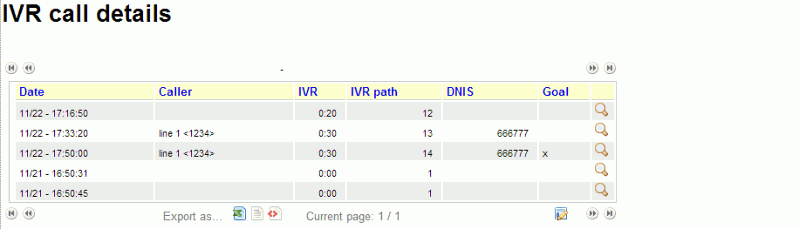
OD05 - IVR details (full list)
This block shows the paged detail of IVR calls. These are calls that did not hit a queue in the current report and thererfore are reported as neither answered nor unanswered.
This block prints a complete list and should be used only for printing and XML-RPC querying.
Available since |
13.03 |
Default page |
Details of answered calls |
Shortcut code |
OD05 |
API block name |
DetailsDO.CallsIVR |
Parameters |
- |
See also |
OD06 - Executive Summary
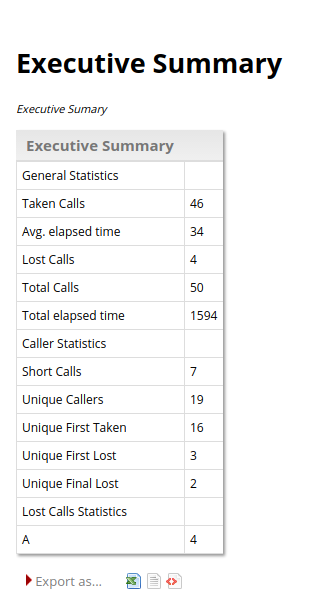
This report provides a wealth of information regarding the situation in general. With a final focus on lost calls and disconnection reasons. The information is the following:
General Statistics
-
Taken Calls
-
Avg. Elapsed Time
-
Lost Calls
-
Total Calls
-
Total Elapsed Time
Caller Statistics
-
Short Calls
-
Unique Callers
-
Unique First Taken
-
Unique First Lost
-
Unique Final Lost
Lost Calls Statistics A list of disconnection reasons and the number of lost calls with each disconnection reason
Notes:
-
the number of seconds needed for a call to be classified as long is dictated by the following configuration property: default.shortcall_treshold = 30 If the property is not specified, it will deafault at 30.
Available since |
17.06.16 |
Default page |
Executive Summary |
Shortcut code |
OD06 |
API block name |
DetailsDO.ExecutiveSummary |
Parameters |
- |
See also |
Historical reports - Unanswered calls
Unanswered calls are calls that were lost, i.e. the caller could not connect to an agent. This usually means that either the caller hung up, fed up with waiting, or the queue system decided to discharge the caller, maybe sending him to voicemail or another queue.
| if you run a report with an agent filter, or a supervisor filter, or a location filter, the number of lost calls in the report is usually zero, showing just outgoing calls, if any. This is because the agent is specified only for taken calls and not lost ones, so not deleting them all would show, e.g., the taken call data for one single agent and the lost calls for all of the queue. You can override this behaviour through a configuration switch if you feel this is not correct for you. |
UN01 - All calls
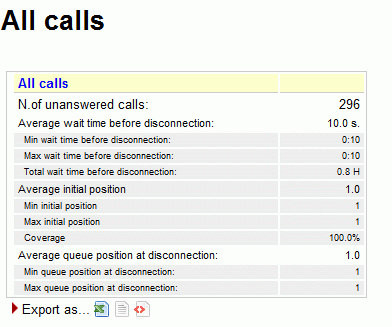
The report shows:
-
How many calls were lost;
-
The average waiting time before disconnection;
-
The average queue position at disconnection (i.e. how many calls the queue had to dispatch before connecting the caller to an operator).
-
The minimum and maximum wait times
-
The minimum and maximum queue position at disconnect.
-
The average, minimum and maximum initial queue position, and the coverage given for this computation
Available since |
1.6.0 |
Default page |
Unans. |
Shortcut code |
UN01 |
API block name |
KoDO.ReportKoAll |
Parameters |
- |
See also |
UN02 - Calls fully within the given time interval
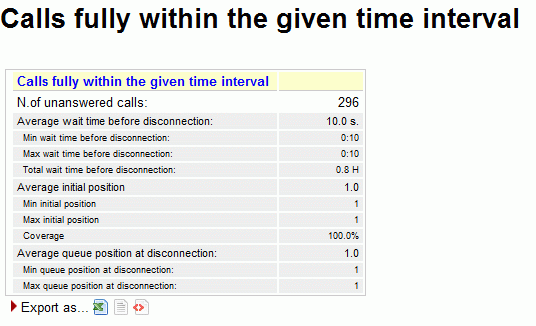
The unanswered completed calls section deals with calls that were lost. This is similar to what’s reported on previous panel but may exclude calls that were started before or terminated after the given time frame.
Available since |
1.6.0 |
Default page |
Unans. |
Shortcut code |
UN02 |
API block name |
KoDO.ReportKoFully |
Parameters |
- |
See also |
UN03 - Disconnection causes
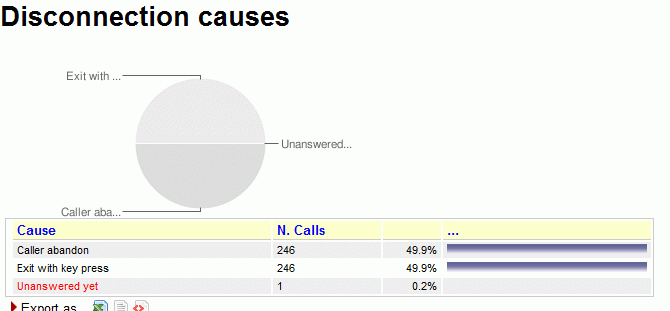
This report shows the relative magnitude of disconnection causes, that are:
-
The caller hung up, or
-
The queue timed out and discharged the caller (if this feature is enabled by the queue configuration - see Configuring Asterisk for QueueMetrics), or
-
The caller exited the queue by pressing a key (if this feature is enabled by the queue configuration).
Available since |
1.6.0 |
Default page |
Unans. |
Shortcut code |
UN03 |
API block name |
KoDO.DiscCauses |
Parameters |
- |
See also |
UN04 - Unanswered calls, by queue
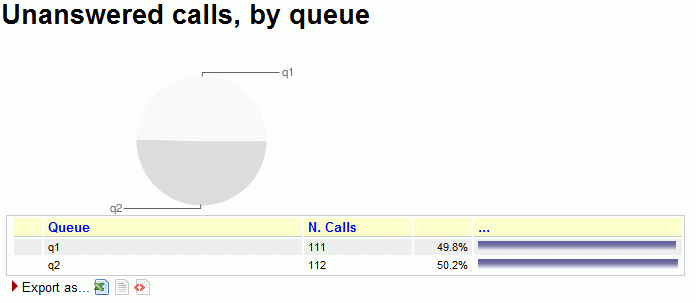
If more than one queue is in use for the report, this graph shows the relative magnitude of each queue, either in a numerical than in a graphical form.
Available since |
1.6.0 |
Default page |
Unans. |
Shortcut code |
UN04 |
API block name |
KoDO.UnansByQueue |
Parameters |
- |
See also |
UN05 - Unanswered outbound calls, by agent
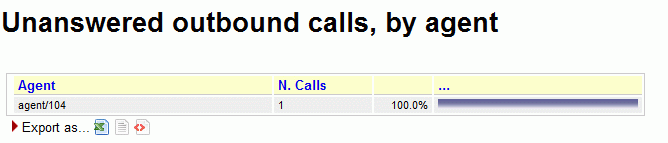
This graph shows the relative magnitude of unanswered outbound calls, grouped by agent.
Available since |
1.6.0 |
Default page |
Unans. |
Shortcut code |
UN05 |
API block name |
KoDO.OutboundKo |
Parameters |
- |
See also |
UN06 - Unanswered calls - distribution by length
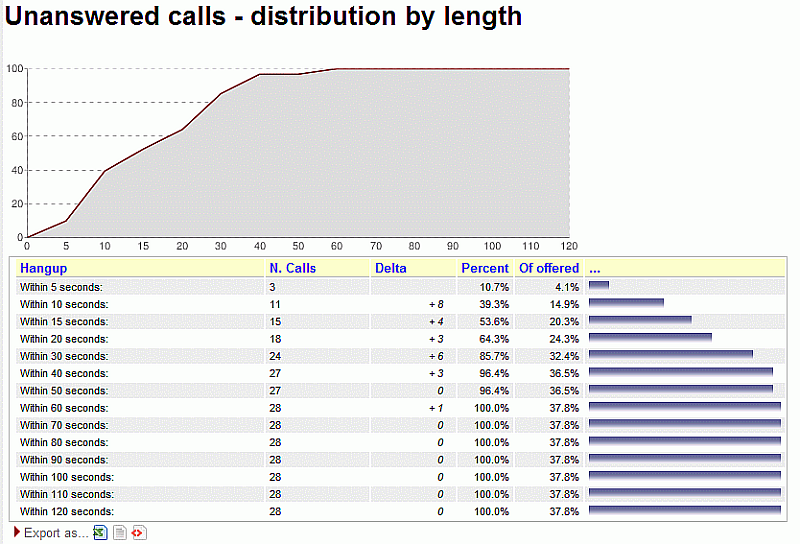
This report is functionally equivalent to "Service level agreement" in the Answered calls section (see Service level agreement), but is computed on lost calls. It shows how many calls were hung up within a given time frame, usually 120 seconds in 10 second increments (the time frame and increment can be modified by the administrator, if needed - see OK04 - Service level agreement).
You get a percentage of how many calls were lost within X seconds; the percentage includes calls lost in a shorter time frame and therefore grows with time.
The "delta" value you see is the absolute increment, expressed in number of calls, between each time frame, while the "Offered" column displays the result of the taken calls divided by the total taken plus the total lost.
The graph reports the percentage of how many calls were not answered within X seconds, as reported in the table.
Available since |
1.6.0 |
Default page |
Unans. |
Shortcut code |
UN06 |
API block name |
KoDO.UnansByLen |
Parameters |
- |
See also |
UN07 UN18 OK04 |
UN07 - Inclusive SLA (computed on both answered and unanswered calls)
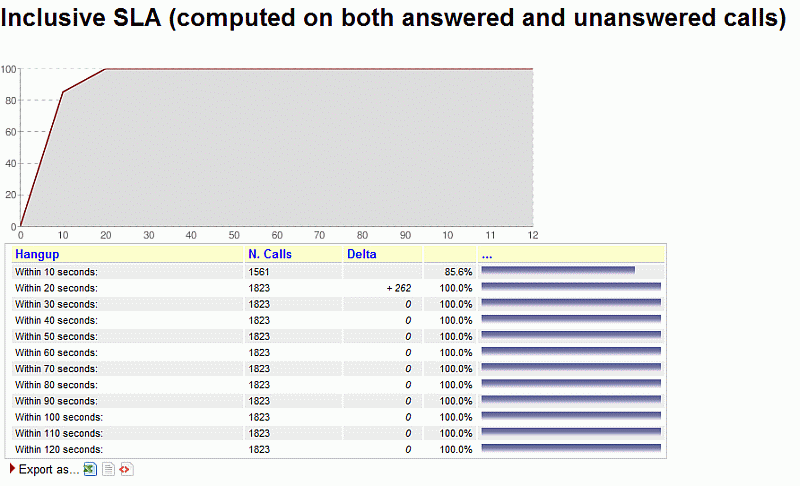
The inclusive SLA corresponds to the Service Level Agreement metrics shown on Service level agreement, with the difference that it is computed taking into consideration both answered and unanswered calls.
The difference between UN07 and UN18 is that the number of calls in UN18 is only the number of taken calls within the given answer period, while in UN07 it is the total number of taken and lost calls within the time period.
The graph reports the same information found in the table, but in a graphical way.
The time frame and increment can be modified by the administrator, if needed - see OK04 - Service level agreement.
Available since |
1.6.0 |
Default page |
Unans. |
Shortcut code |
UN07 |
API block name |
KoDO.InclusiveSLA |
Parameters |
- |
See also |
OK04 UN06 UN18 (Inclusive Answered SLA) |
UN08 - Unanswered calls by key press
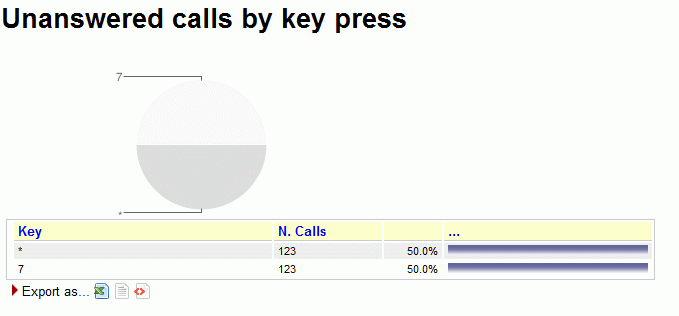
If there are any calls that are were set unanswered because the caller pressed a key to exit the queue, this graph shows which keys were pressed and how many calls were terminated for that reason.
Available since |
1.6.0 |
Default page |
Unans. |
Shortcut code |
UN08 |
API block name |
KoDO.ReportKoKeyPress |
Parameters |
- |
See also |
UN09 - Unanswered calls, by stints
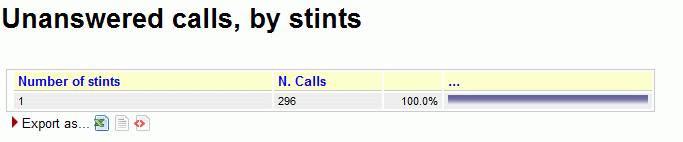
This graph tells the stint distribution of unanswered calls. It corresponds to the graph called "Answered calls, by stints".
Available since |
1.6.0 |
Default page |
Unans. |
Shortcut code |
UN09 |
API block name |
KoDO.StintsKo |
Parameters |
- |
See also |
UN10 - All calls, by stints
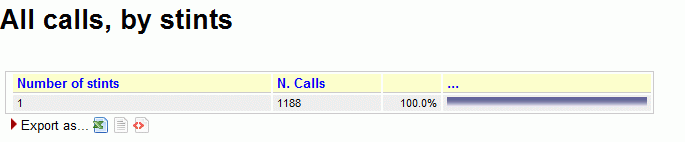
This graph tells the stint distribution of all processed calls. It corresponds to the sum of the graphs called "Answered calls, by stints" and "Unanswered calls, by stints"
Available since |
1.6.0 |
Default page |
Unans. |
Shortcut code |
UN10 |
API block name |
KoDO.StintsOkKo |
Parameters |
- |
See also |
UN11 - Enter queue position
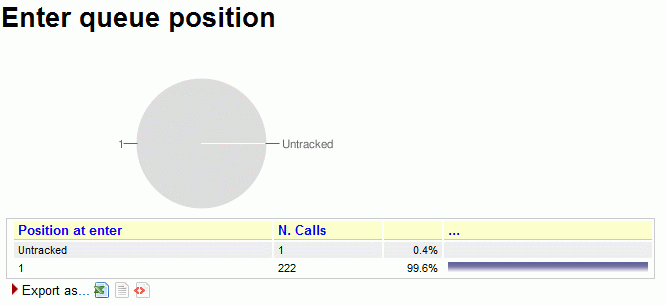
This graph shows the initial queue position that the calls had when they joined the queue. For example, a queue position of 1 means that a call was first in line, of 5 means that a call had four other calls in line before being answered. As the logging of queue positions is a bit inconsistent, some calls might be missing it ("Untracked")
Available since |
1.6.0 |
Default page |
Unans. |
Shortcut code |
UN11 |
API block name |
KoDO.QPosKo |
Parameters |
- |
See also |
UN12 - Enter queue position for all calls
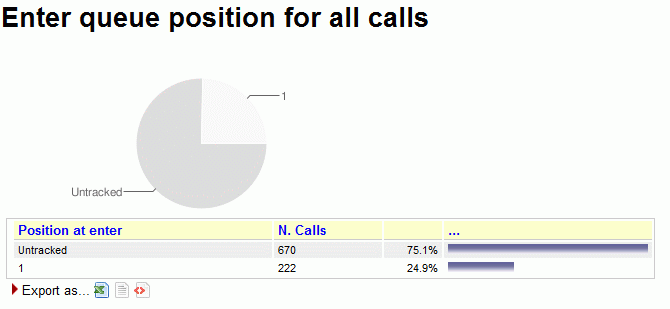
This graph shows the initial queue positions for both answered and unanswered calls.
Available since |
1.6.0 |
Default page |
Unans. |
Shortcut code |
UN12 |
API block name |
KoDO.QPosOkKo |
Parameters |
- |
See also |
UN13 - IVR selection
This graph shows the distribution of IVR selections available for lost calls.
We can also see the IVR duration values, which is related to the time that the call was within the IVR before entering the queue.
This must be tracked manually in Asterisk - See "Configuring Asterisk for QueueMetrics" below.
Available since |
1.6.0 |
Default page |
Unans. |
Shortcut code |
UN13 |
API block name |
KoDO.IvrKo |
Parameters |
- |
See also |
UN14 - IVR selection, for all calls
This graph shows the distribution of IVR selections for all calls (taken and lost) available in the report.
Available since |
1.6.0 |
Default page |
Unans. |
Shortcut code |
UN14 |
API block name |
KoDO.IvrOkKo |
Parameters |
- |
See also |
UN15 - DNIS used
This graph shows the distribution of DNIS lines that lead to lost calls.
This must be tracked manually in Asterisk - See "Configuring Asterisk for QueueMetrics" below.
Available since |
1.6.0 |
Default page |
Unans. |
Shortcut code |
UN15 |
API block name |
KoDO.DnisKo |
Parameters |
- |
See also |
UN16 - DNIS used, for all calls
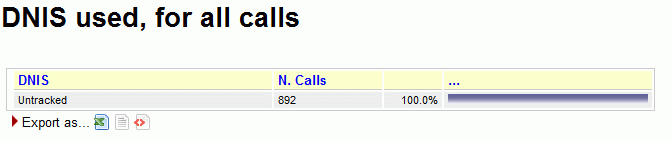
This graph shows the distribution of DNIS lines for all calls (taken and lost) available in the report.
Available since |
1.6.0 |
Default page |
Unans. |
Shortcut code |
UN16 |
API block name |
KoDO.DnisOkKo |
Parameters |
- |
See also |
UN17 - Call Overview
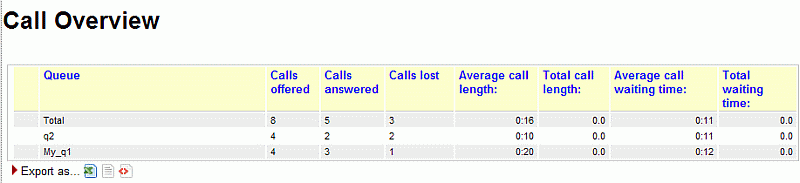
The answered calls section deals with calls that were correctly handled by agents.
For each queue included in the report, the following data will be shown:
-
Calls offered: total number of calls in the period to hit that queue
-
Calls answered: total number of answered calls
-
Lost calls: total number of calls that have not been answered
-
Average call length: it computed only on the talk time of answered calls, expressed as MM:SS
-
Total call length: the total cumulate speak time for each queue, expressed as decimalized hours
-
Average wait Q: the average wait time for both answered and lost calls
-
Total wait Q: total cumulate wait time for answered and unanswered calls, expressed as decimalized hours
In the first line, there is a "Total" line, that sums up the values shown in previous lines.
The following lines are sorted according to the number of offered calls.
Available since |
1.6.1.1 |
Default page |
Unanswered calls |
Shortcut code |
UN17 |
API block name |
KoDO.OverviewOkKo |
Parameters |
- |
See also |
UN18 - Inclusive Answered SLA
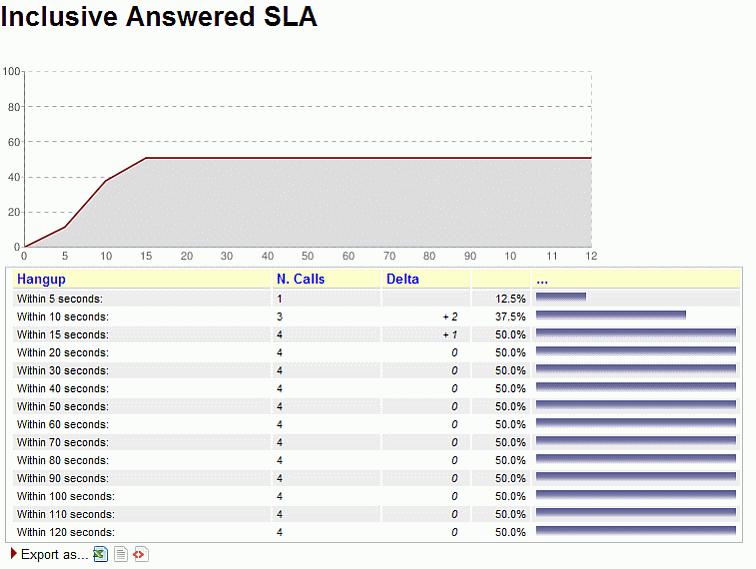
The inclusive SLA corresponds to the Service Level Agreement metrics shown on Service level agreement, with the difference that it is computed taking into consideration both answered and unanswered calls.
The difference between UN07 and UN18 is that the number of calls in UN18 is only the number of taken calls within the given answer period, while in UN07 it is the total number of taken and lost calls within the time period.
The graph reports the same information found in the table, but in a way that is easier to read.
The time frame and increment can be modified by the administrator, if needed - see OK04 - Service level agreement.
Available since |
1.6.1.2 |
Default page |
Unans. |
Shortcut code |
UN18 |
API block name |
KoDO.InclusiveAnswSLA |
Parameters |
- |
See also |
UN07 (Inclusive SLA) UN06 OK04 |
UN19 - Required Skills for Lost Calls
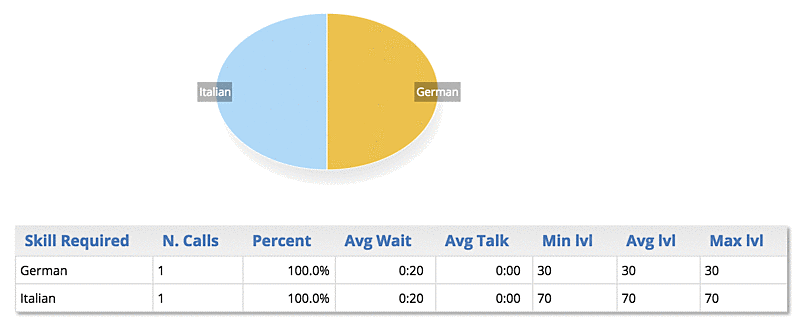
This data block displays the skills that were required for lost calls in the current reports.
As multiple skills may be required for the same call, or some calls may have no required skill, the sum of all skills may be significantly different from the number of calls.
For each skill, the average wait duration of all calls having that specific skill is computed. As lost calls never have any talk time, it always appears as 0:00 and is displayed for symmetry with blocks OK15 and UN20.
The minimum, average and maximum level at which this skill was requested for the specific set of calls is displayed.
Available since |
15.10 |
Default page |
Unans. |
Shortcut code |
UN19 |
API block name |
KoDO.SkillsKo |
Parameters |
- |
See also |
UN20, OK15 |
UN20 - Required Skills for All Calls
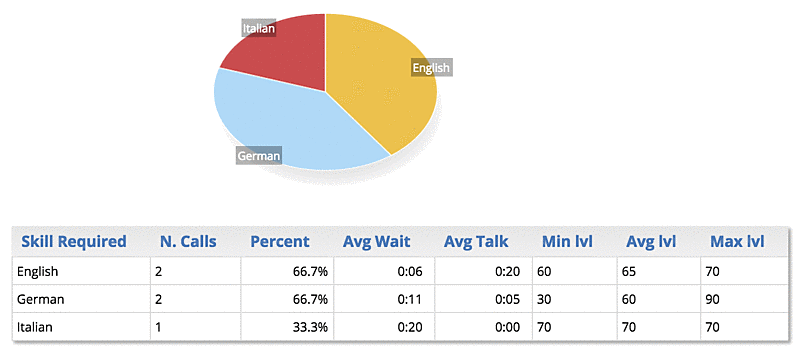
This data block displays the skills that were required for all calls in the current reports.
As multiple skills may be required for the same call, or some calls may have no required skill, the sum of all skills may be significantly different from the number of calls.
For each skill, the average wait and talk duration of all calls having that specific skill is computed. Plus, the minimum, average and maximum level at which this skill was requested for the specific set of calls is displayed.
Available since |
15.10 |
Default page |
Unans. |
Shortcut code |
UN20 |
API block name |
KoDO.SkillsOkKo |
Parameters |
- |
See also |
UN19, OK15 |
UN21 - Numbers to be recalled
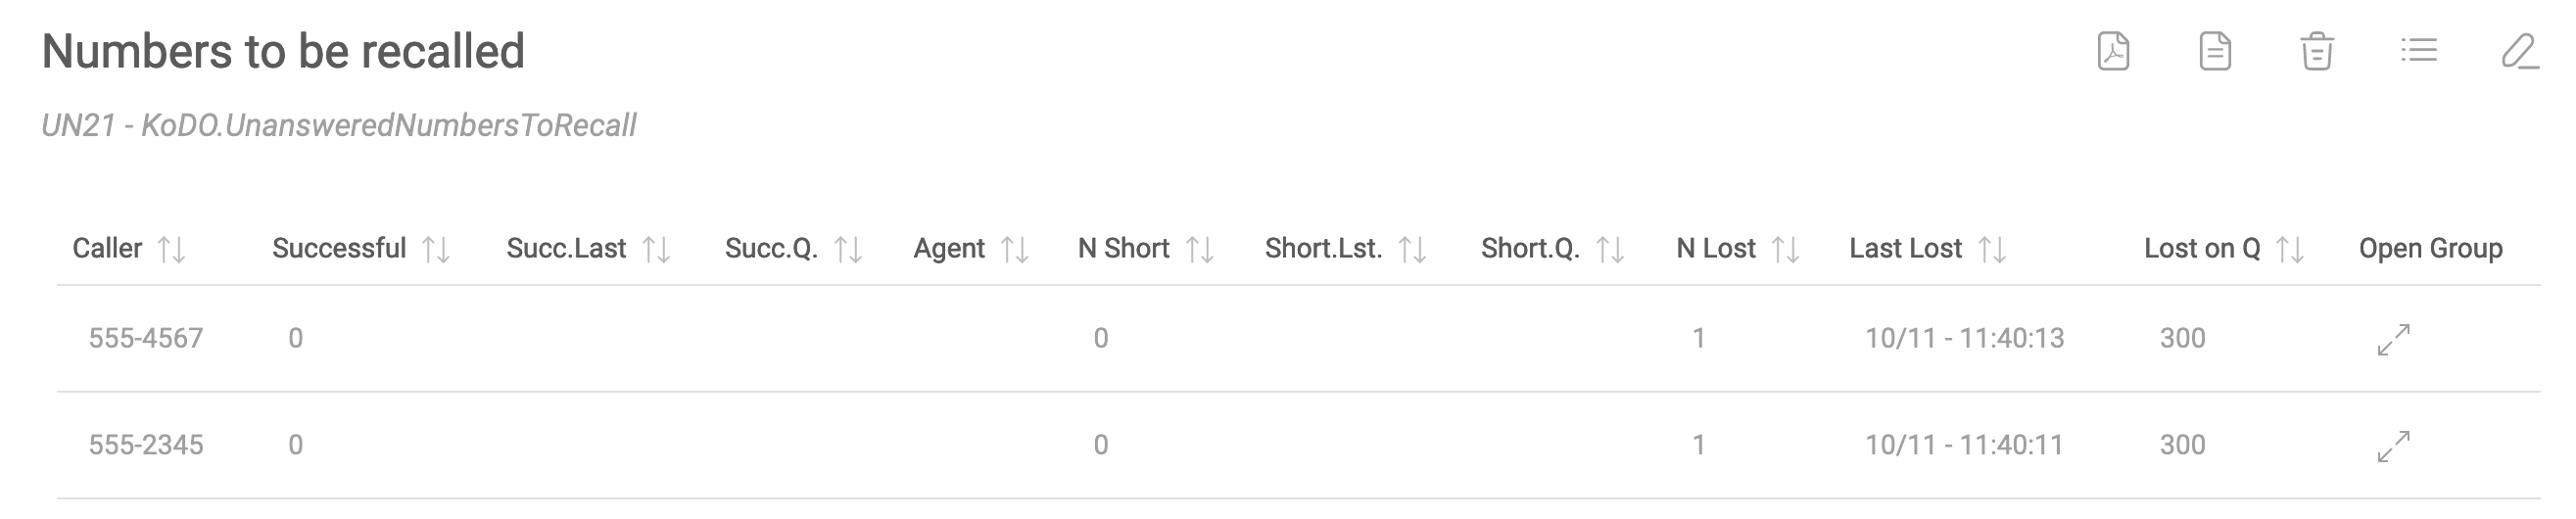
This data block displays the calling numbers that are to be recalled. A number is considered to be recalled if it matches the following criteria:
-
it has at least one lost call within the period, on any queue, or it has at least one connected short call, and
-
there is no connected call for the same number following the most recent lost/short call (whether it’s outbound or inbound)
So we can say that a number is to be recalled if the last call from that number was unsuccessful. In this data block we display a list of calls, by default sorted with the most recent attempt on top, where such calls are in states Not yet recalled (when there is no succesful call at all) or Needs further recall (when there is a lost call after a succesful call).
Available columns:
-
Caller: the caller-id
-
Successful: the number of successful calls made to the caller
-
Successful Last: when the last successful call was made
-
Successful Queue: the inbound queue or outbound campaign that the succesful call was on
-
Agent: The agent who was involved in the succesful call
-
N Short: the number of short calls
-
Short Last: when the last short call was made
-
Short Queue: the queue where the last short call happened
-
N Lost: The number of lost calls by this caller
-
Last Lost: When the last lost call was
-
Lost on Queue: The queue where the last lost call was processed
-
Open group: A group of all the calls involved (check the different tabs for Taken/Lost calls!)
When embedded in a wallboard, this block displays the current recall activity to be implemented and is a simple but effective way of keeping tab of missed contacts.
Available since |
22.10 |
Default page |
Unans. |
Shortcut code |
UN21 |
API block name |
KoDO.UnansweredNumbersToRecall |
Parameters |
- |
See also |
UN22, UN23 |
UN22 - Numbers recalled
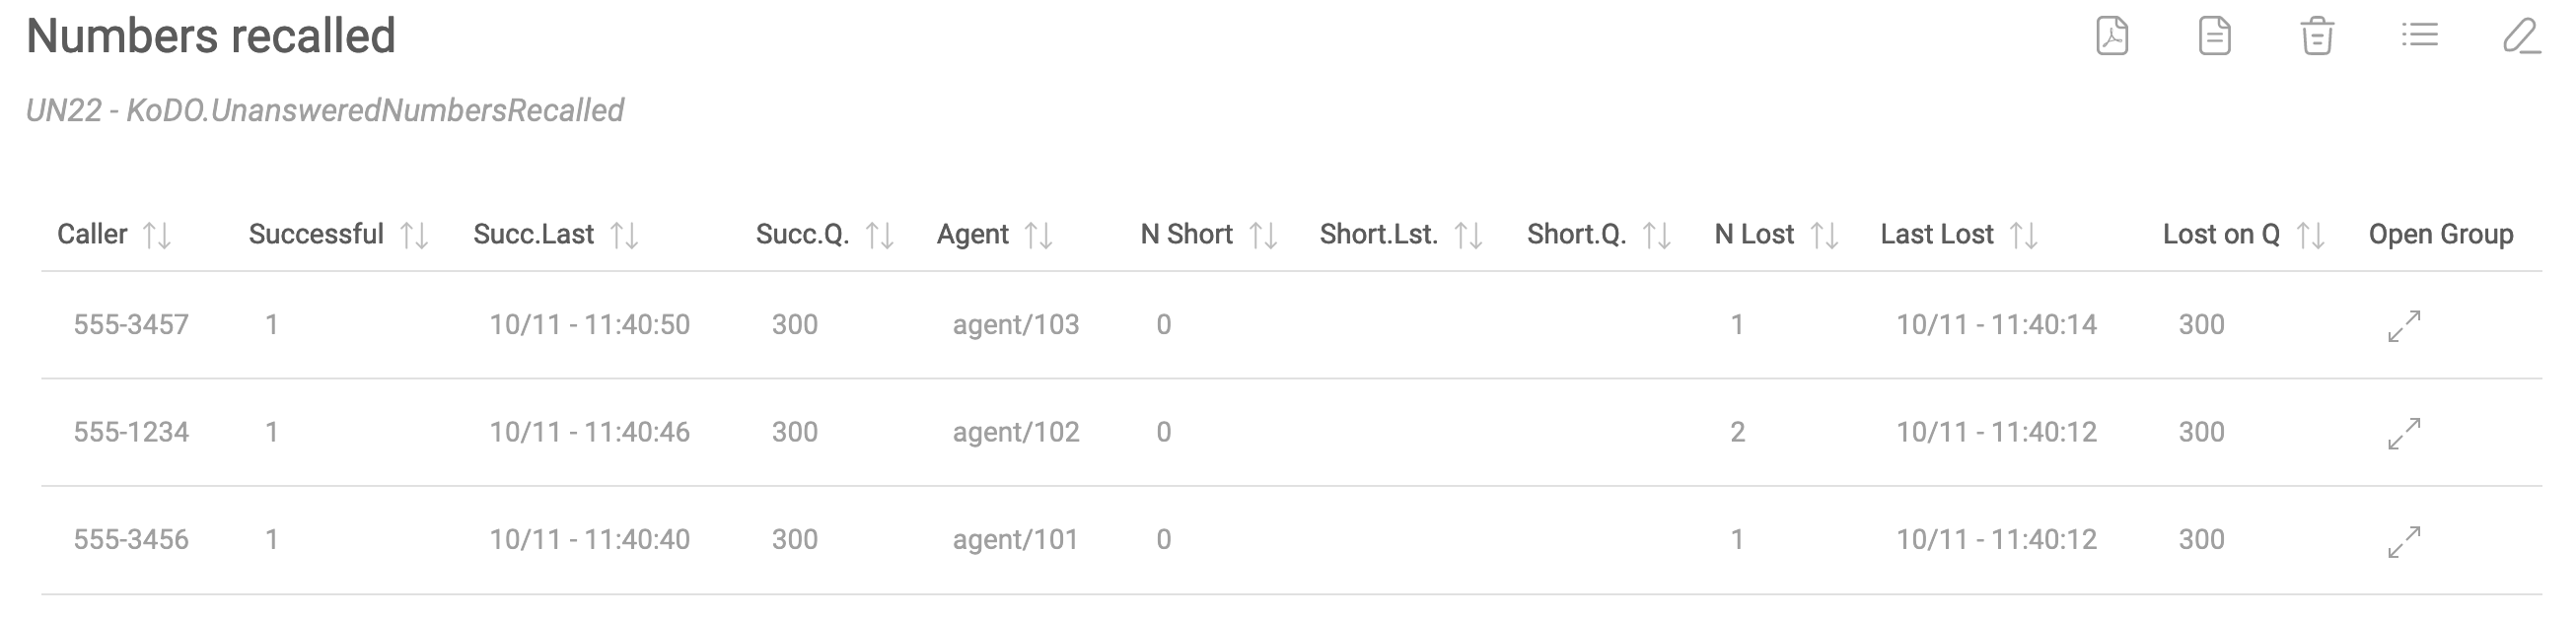
This data block displays callers that were recalled, that is, that had short or lost calls, but also had a subsequent complete call. SO the number of Successful calls will always be at least one.
Columns and the way they are computed are the same as block UN21.
Available since |
22.10 |
Default page |
Unans. |
Shortcut code |
UN21 |
API block name |
KoDO.UnansweredNumbersRecalled |
Parameters |
- |
See also |
UN21, UN23 |
UN23 - Recap of all recalls
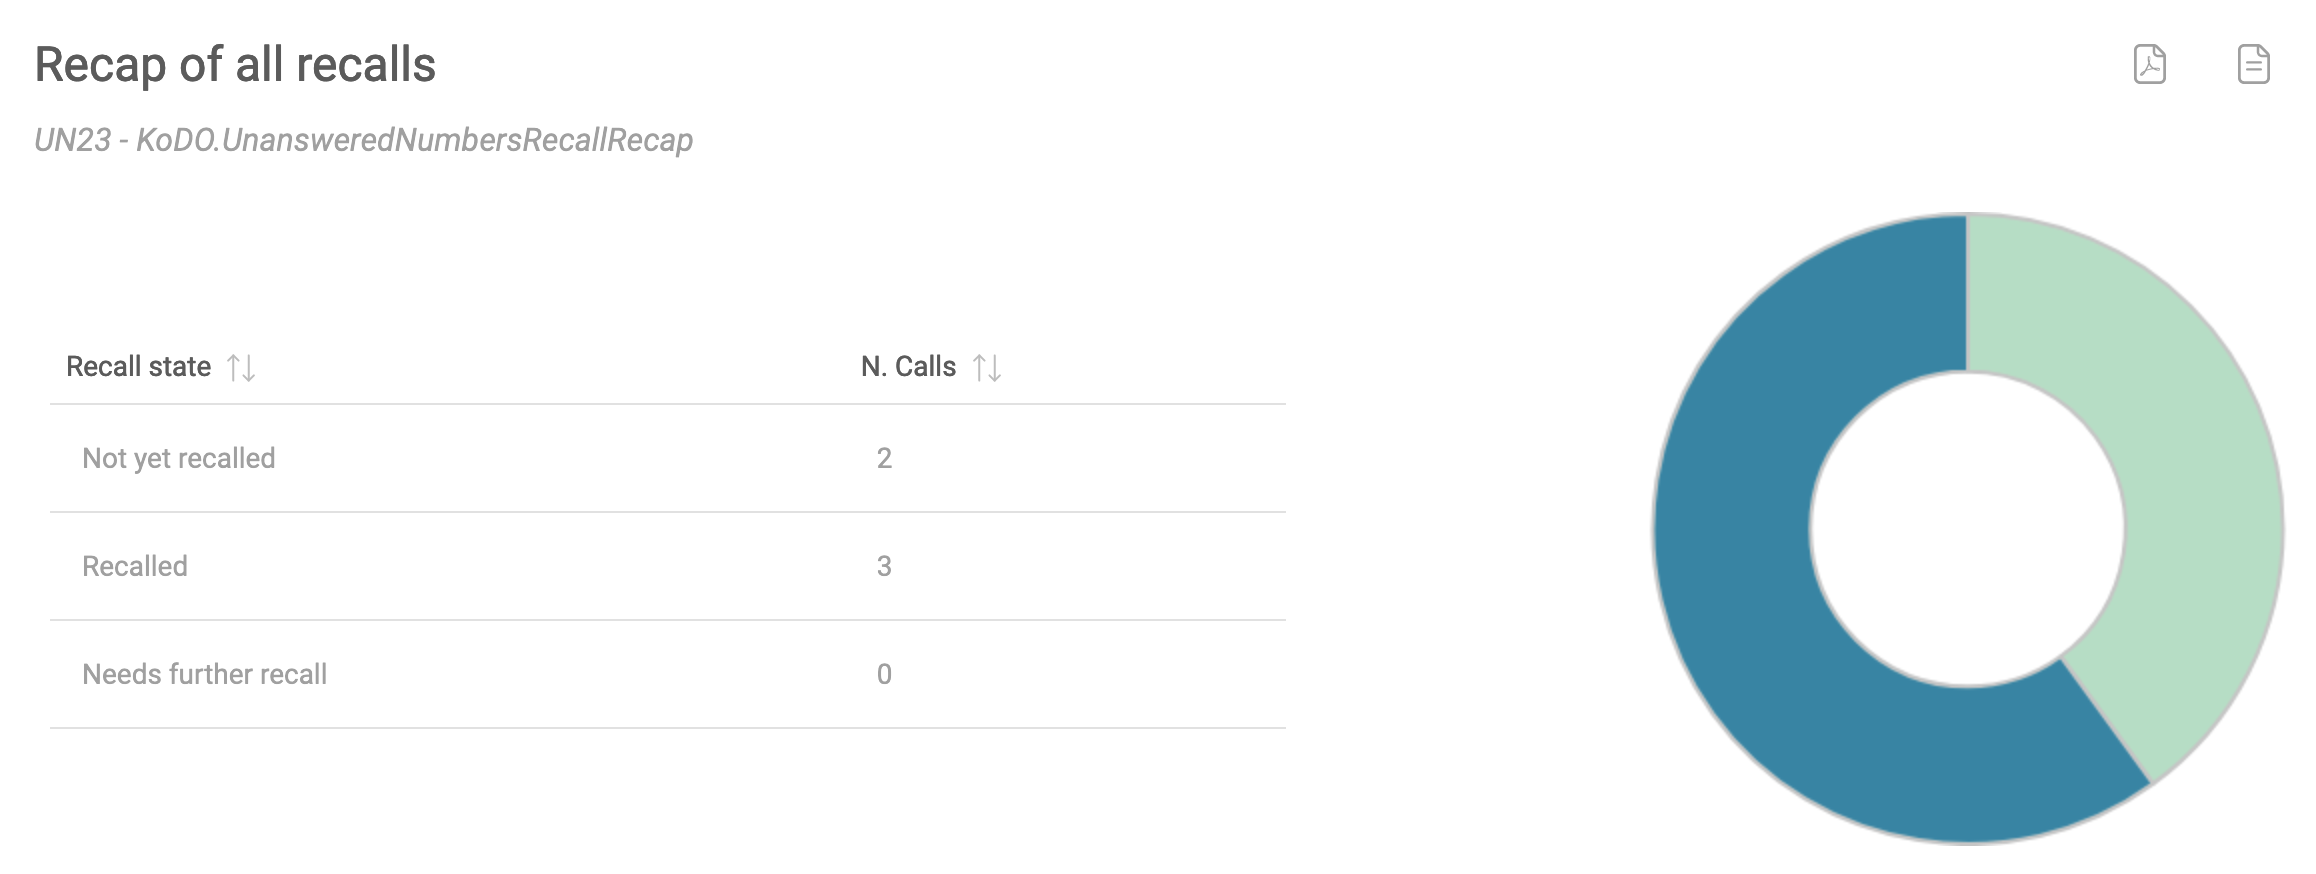
This block displays a quick at-a-glance state of how many calls were:
-
Not yet recalled (as in UN21)
-
Recalled (as in UN22)
-
Need further recall (as in UN21)
Available since |
22.10 |
Default page |
Unans. |
Shortcut code |
UN21 |
API block name |
KoDO.UnansweredNumbersRecallRecap |
Parameters |
- |
See also |
UN21, UN22 |
Historical reports - Details of unanswered calls
UD01 - Detail of unanswered calls
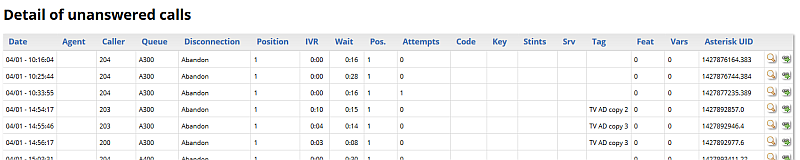
This page shows full details of unanswered calls Detail of unanswered calls.
Available since |
1.6.0 |
Default page |
Details of unanswered calls |
Shortcut code |
UD01 |
API block name |
DetailsDO.CallsKO |
Parameters |
- |
See also |
UD02 - Lost calls (paged)
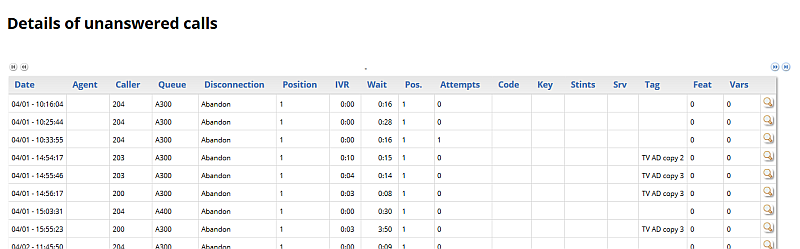
This page shows the paged detail of unanswered calls. See Showing call details.
The details of calls are paged - so you can move back and forth - and you can control which columns will appear on screen. The paged mode uses way less memory and is quicker to use than the full list as in UD01 - Detail of unanswered calls.
When accessing the data source though XML-RPC or printing a report, it is mandatory to use the UD01 block, as this block is interactive and will not render correctly.
Available since |
13.03 - Removed in 20.11 |
Default page |
Details of unanswered calls |
Shortcut code |
UD02 |
API block name |
- |
Parameters |
- |
See also |
UD01 - Detail of unanswered calls and Configuring paged call lists |
Historical reports - Area code analysis
AC01 - Area code report
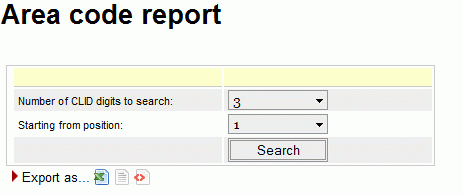
If the Caller*ID is present, it is possible to break down both answered and unanswered calls to specific area codes by clicking on the "Area code analysis" button.
By selecting a number of caller id digits to search upon and a starting digit position, you get a number of statistics grouped by area codes.
This report gives an immediate check of the geographical origin of calls handled by your call center.
Available since |
1.6.0 - Removed in 20.11 |
Default page |
Area code analysis |
Shortcut code |
AC01 |
API block name |
AreaAnDO.Setup |
Parameters |
- |
See also |
AC02 - Detail for answered calls
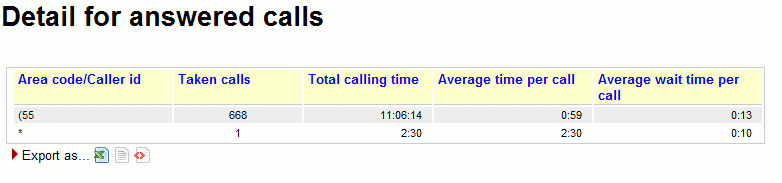
This report shows the answered calls grouped following the rules defined in AC01 - Area code report.
Available since |
1.6.0 |
Default page |
Area code analysis |
Shortcut code |
AC02 |
API block name |
AreaAnDO.CallsOK |
Parameters |
- |
See also |
AC01 - Area code report |
AC03 - Detail for unanswered calls
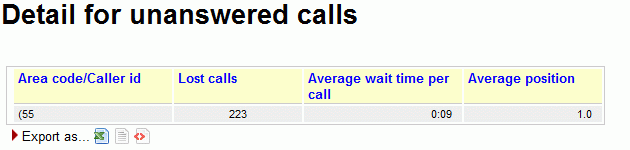
This report shows the unanswered calls grouped following the rules defined in AC01 - Area code report.
Available since |
1.6.0 |
Default page |
Area code analysis |
Shortcut code |
AC03 |
API block name |
AreaAnDO.CallsKO |
Parameters |
- |
See also |
AC01 - Area code report |
AC04 - Frequent Area Codes
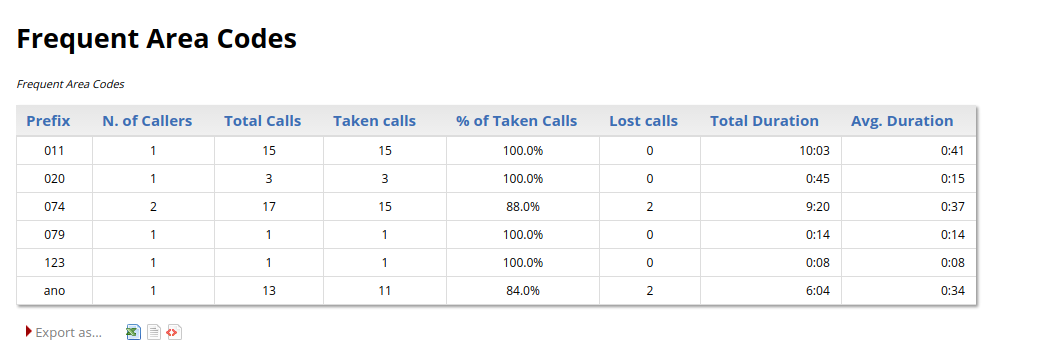
This report shows detailed information regarding different Area Codes. We take into account the quantity and quality of calls related to different areas, by calculating the following information:
-
Prefix
-
N. of Callers
-
Totale Calls
-
Taken Calls
-
% of Taken Calls
-
Lost Calls
-
Total Duration
-
Avg. Duration
Available since |
17.06.16 |
Default page |
Area code analysis |
Shortcut code |
AC04 |
API block name |
AreaAnDO.FrequentAreaCodes |
Parameters |
- |
See also |
AC01 - Area code report |
Historical reports - Distributions
When running an inbound call center, it is very important to determine the reason why a call is delayed: are your clients refusing to answer? Did they forget to log off before leaving their workplace? Is the phone malfunctioning? The inbound ACD call attempts metrics try to answer to these questions.
If your Asterisk system supports RINGCANCELED events, those events are displayed
and counted on the call details, but will be purpousedly ignored for these data blocks.
This is because those are not taken attempts, but not lost attempts either,
as it is the ACD itself "retiring" the attempts. By adding them to lost or taken
attempts, we would end up inflating these numbers providing no actual insights.
On the other hand, if you have a call that has one RINGNOANSWER, one RINGCANCELED
and was connected, the call list will say that the call has three attempts, but
these distributions will say it just has two.
|
AT01 - Inbound ACD call attempts
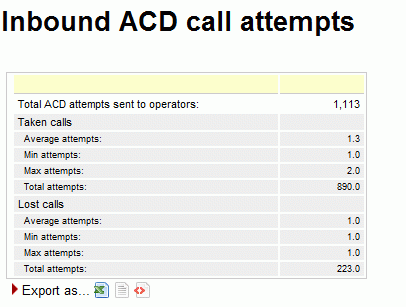
This page shows the following pieces of information:
-
How many agent attempts were made, i.e. how many times the agent’s telephones were rung in total
-
The average number of attempts that were necessary for a taken call; the minimum, maximum and total attempts made that resulted in a taken call
-
The average number of attempts that were necessary for a lost call; the minimum, maximum and total attempts made that resulted in a lost call
Available since |
1.6.0 |
Default page |
Distrib. |
Shortcut code |
AT01 |
API block name |
DistrDO.ReportAcd |
Parameters |
- |
See also |
AT02 - ACD attempts by queue
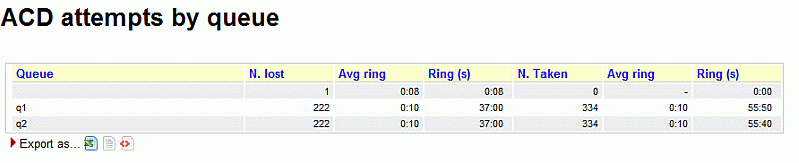
The following metrics are extracted and broken down by queue:
-
N. of lost agent attempts (i.e. the agent was called but not responding)
-
The average ring time for lost attempts
-
The total ringing time for lost calls
-
The number of taken agent attempts (i.e. calls answered)
-
The average ring duration for taken calls
-
The total ring time for taken calls
Available since |
1.6.0 |
Default page |
Distrib. |
Shortcut code |
AT02 |
API block name |
DistrDO.AcdByQueue |
Parameters |
- |
See also |
AT03 - ACD attempts by terminal
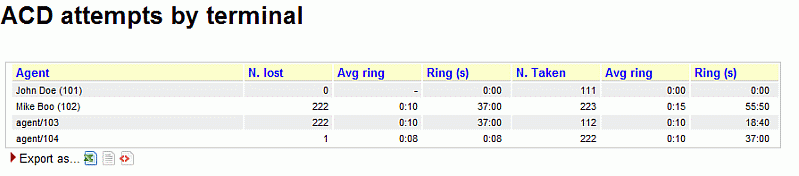
This graph breaks down agent attempts by the agent that was called. The following pieces of information are extracted for each agent:
-
N. of lost agent attempts (i.e. the agent was called but not responding)
-
The average ring time for lost attempts
-
The total ringing time for lost calls
-
The number of taken agent attempts (i.e. calls answered)
-
The average ring duration for taken calls
-
The total ring time for taken calls
Available since |
1.6.0 |
Default page |
Distrib. |
Shortcut code |
AT03 |
API block name |
DistrDO.AcdByTerminals |
Parameters |
- |
See also |
Historical reports - Call distribution by day
The call distribution report shows when calls were handled, when calls were lost and the average wait times broken down by period.
All percentages are calculated on the call class they belong to, i.e. a 50% of "Unanswered calls" on one day means that 50% of all unanswered calls for the period happened during that day, not that 50% of calls were lost.
For each metrics, the total number of calls is shown, together with average, minimum and maximum times. Graphs are plotted on the total number of calls broken down and on the averages.
It is possible to change the interval in the Hourly graphs, so that you can have reports break down calls e.g. by half-hours or hour quarters, by changing a value in the QueueMetrics master configuration file.
DD01 - Answered call distribution per day
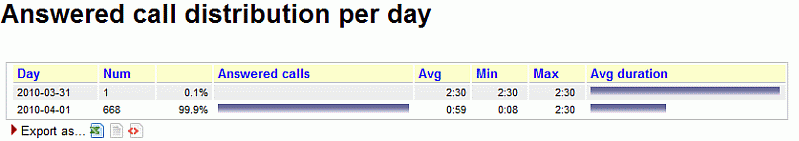
Taken calls are shown per specific day. Days with no events are not shown.
Available since |
1.6.0 |
Default page |
Call distribution, by day |
Shortcut code |
DD01 |
API block name |
CallDistrDO.AnsDistrPerDay |
Parameters |
- |
See also |
DD02 - Answered call wait time per day
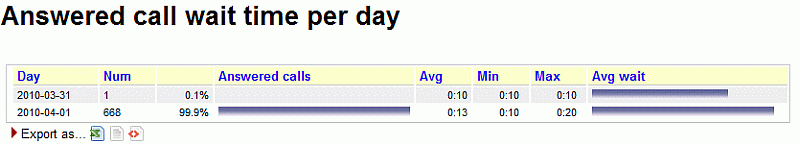
The total numbers of call wait time for answered calls are plotted for each day.
Available since |
1.6.0 |
Default page |
Call distribution, by day |
Shortcut code |
DD02 |
API block name |
CallDistrDO.AnsWaitPerDay |
Parameters |
- |
See also |
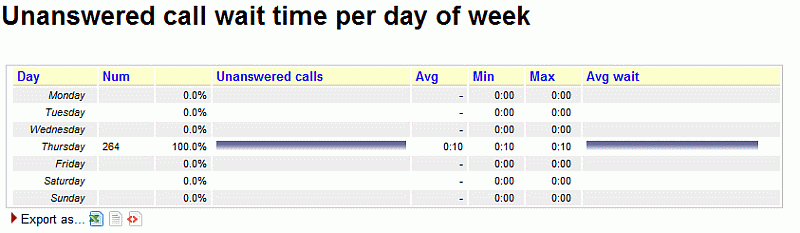
DD03 - Unanswered call wait time per day
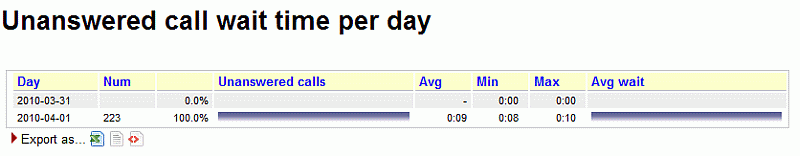
The total numbers of lost wait time for lost calls are plotted for each day.
Available since |
1.6.0 |
Default page |
Call distribution, by day |
Shortcut code |
DD03 |
API block name |
CallDistrDO.UnansWaitPerDay |
Parameters |
- |
See also |
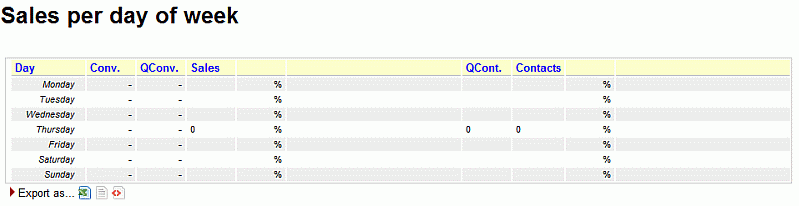
DD04 - Sales per day
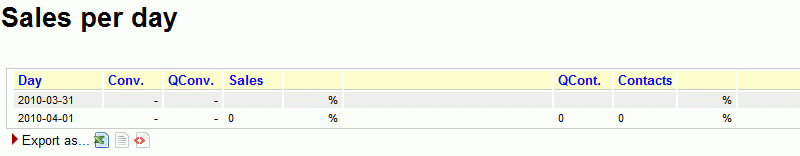
Sales and contacts are shown on a daily basis.
Available since |
1.6.0 |
Default page |
Call distribution, by day |
Shortcut code |
DD04 |
API block name |
CallDistrDO.SalesPerDay |
Parameters |
- |
See also |
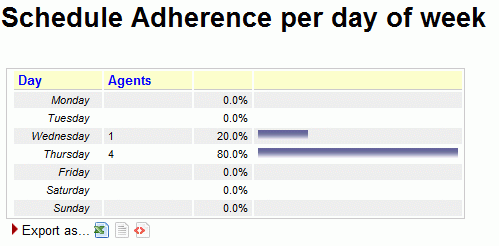
DD05 - Schedule Adherence per day
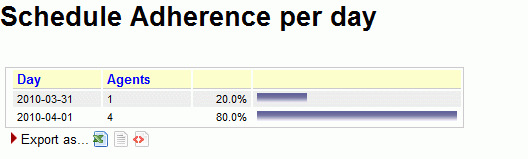
The Schedule Adherence report shows the number of distinct agents that were detected during the given period. This makes it possible to detect the number of different people that had been working on a given moment.
Available since |
1.6.0 |
Default page |
Call distribution, by day |
Shortcut code |
DD05 |
API block name |
CallDistrDO.StaffPerDay |
Parameters |
- |
See also |
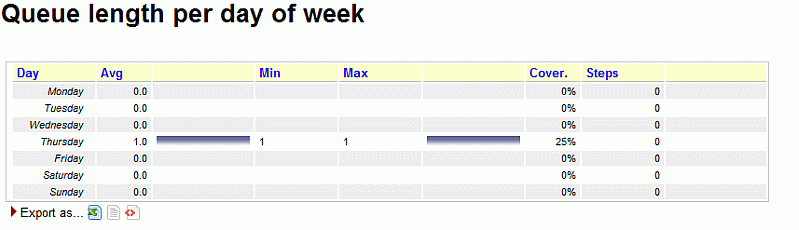
DD06 - Queue length per day
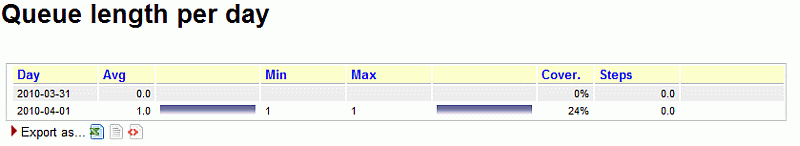
The Queue Length report shows the average length of the queue for each period, giving minimums and maximums. The Steps computation shows how fast each queue progresses during the period, expresses in steps per hour. Note: giving a meaning to the Queue Length reports may be hard in the case of composite queues.
Available since |
1.6.0 |
Default page |
Call distribution, by day |
Shortcut code |
DD06 |
API block name |
CallDistrDO.QPosPerDay |
Parameters |
- |
See also |
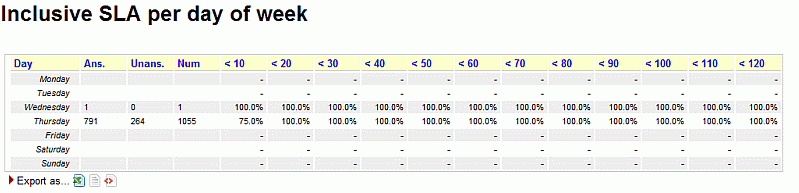
DD07 - Inclusive SLA per day
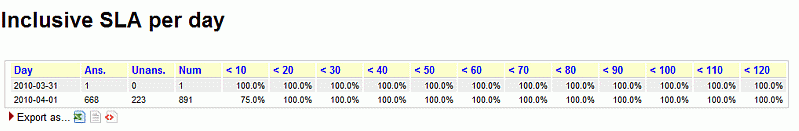
The inclusive SLA corresponds to the Service Level Agreement metrics shown on Service level agreement, grouped by day.
Available since |
1.6.0 |
Default page |
Call distribution, by day |
Shortcut code |
DD07 |
API block name |
CallDistrDO.InclSlaPerDay |
Parameters |
- |
See also |
DD08 - Traffic Analysis by period - per day
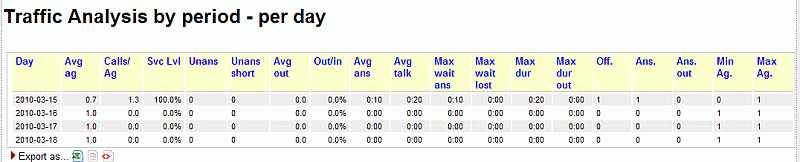
This report shows aggregate inbound/outbound activity per day.
-
Date: the date, hour or day of week used for the report.
-
Avg agents: the average number of agents, as calculated by agents logged in for each period versus the total period. E.g. if an agent logs in at 10:00 and logs off at 11:30, and a second agent logs in at 10:15 and logs off at 11:00, the period for 10:00 to 10:30 will show 1.5 available agents.
-
Avg calls/agent: number of INCOMING calls (answered+unanswered) per period versus average available agents
-
Service level: the SLA (see below), computed on INCOMING calls only
-
Unans: Lost calls (INCOMING only)
-
Unans short: Lost calls below X seconds (INCOMING only, as a percentage of all calls)
-
Avg out: number of OUTGOING calls (completed and lost) per period versus number of available agents
-
Out/in: ratio of outbound to inbound
-
Avg ans. Average answer time (for INCOMING only)
-
Avg talk time: Average talk time (for INCOMING only)
-
Max wait ans: Maximum answer time in period (for INCOMING only)
-
Max wait lost: Maximum wait time for lost calls in period (for INCOMING only)
-
Max duration: Maximum talk time in period (for INCOMING only)
-
Max duration OUT: Maximum talk time in period (for OUTGOING only)
-
N. offered: Total number of INCOMING calls
-
N Answered: Total number of answered INCOMING calls
-
N Answered out: Total number of answered OUTGOING calls
-
Min Agents: minimum number of agents logged on for the period
-
Max Agents: maximum number of agents logged on in the period
The Service Level is measured against a time period that is specidfied in the 'default.secondsServiceLevel' parameter (default is 20, as to say "percentage of calls answered within 20 seconds").
Short calls are defined as being shorter than the 'default.shortCallsLimit' parameter - default is 5 seconds.
Available since |
1.6.0.4 |
Default page |
Call distribution, by day |
Shortcut code |
DD08 |
API block name |
CallDistrDO.TrafficAnPerDay |
Parameters |
- |
See also |
DH08, DW08 |
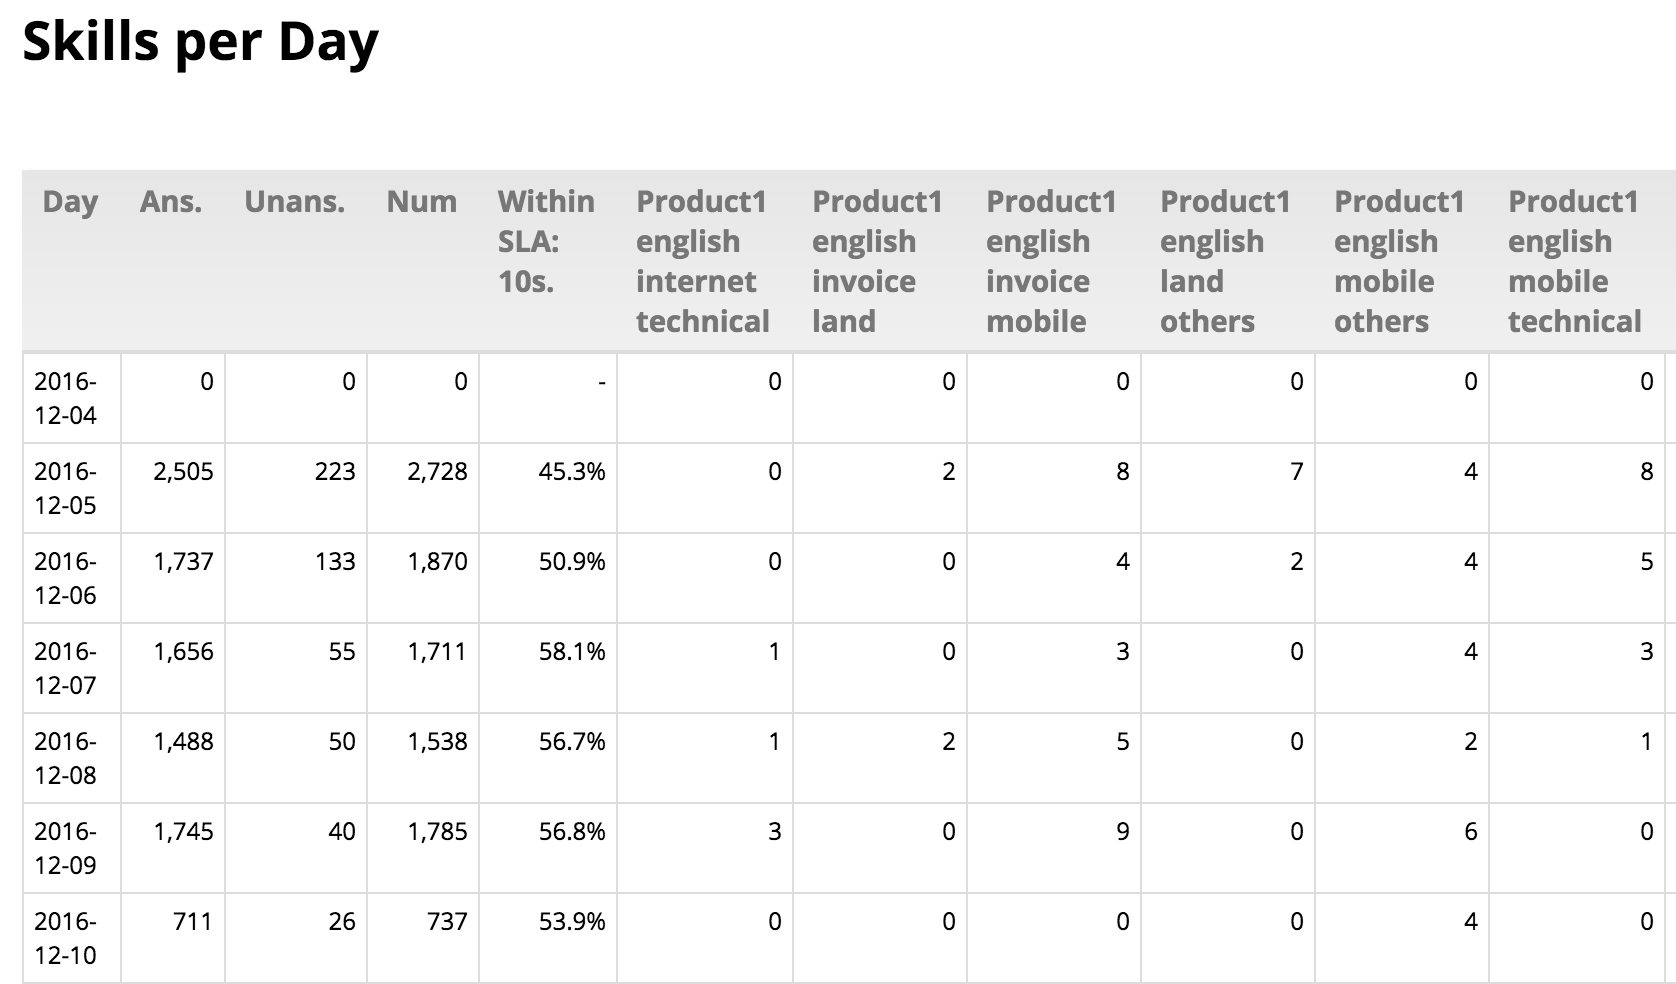
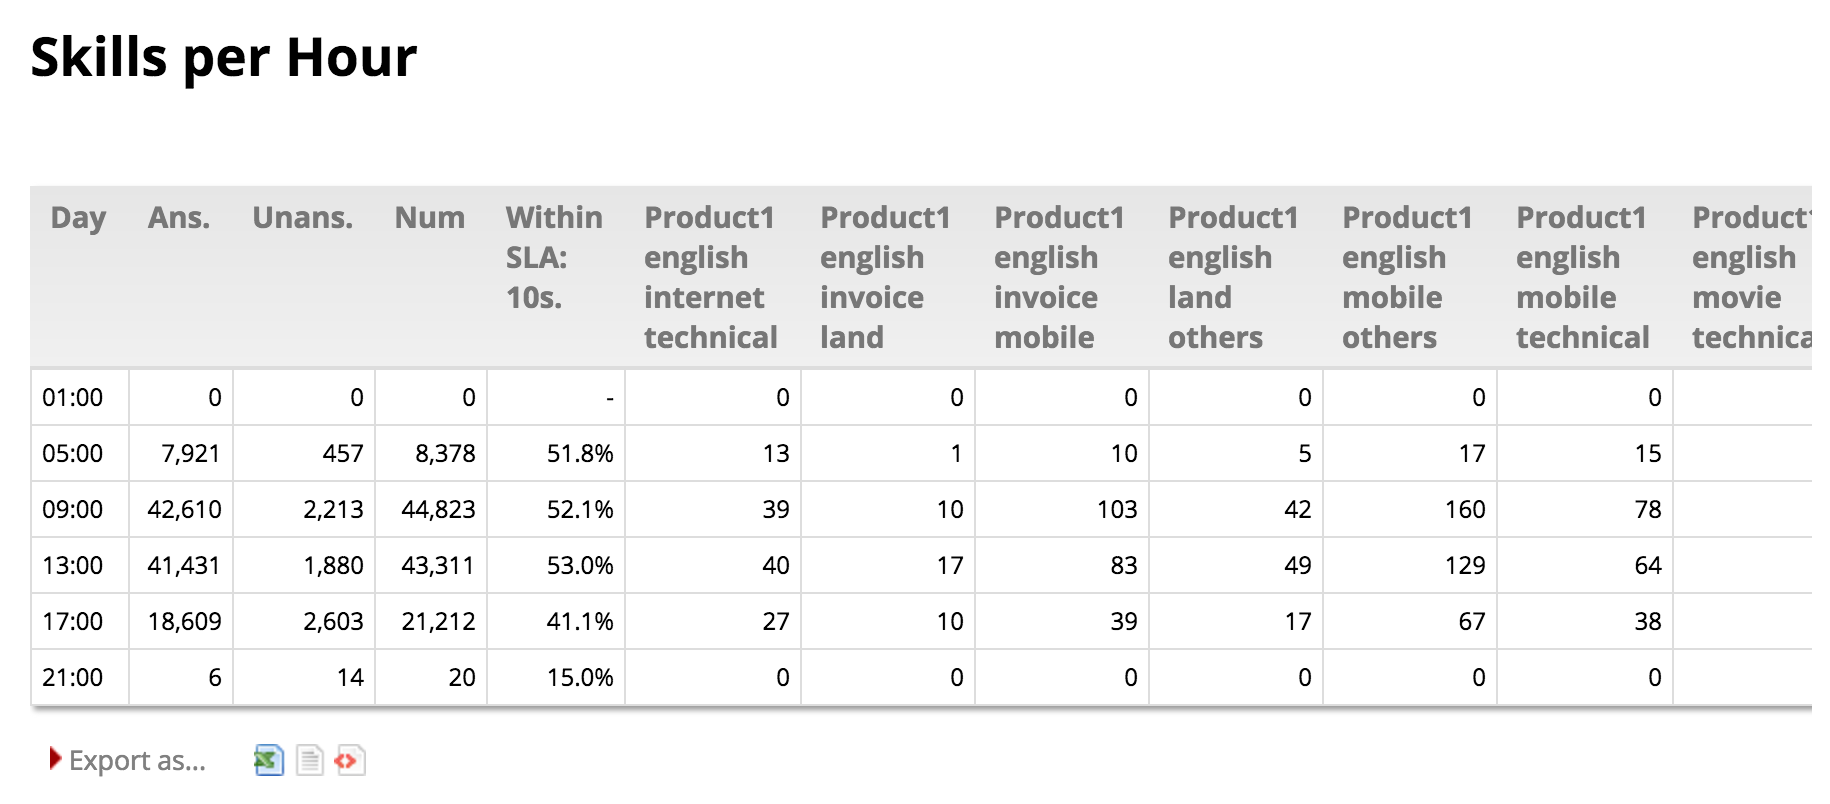
DD09 - Skill sets per day
This reports shows the unique sets of skills during a specified time period.
The report is computed out of all calls in the current analysis. Time bands are set as for the current report (system property that can be overridden and is "remembered" across sessions; can be reset through the Custom Reports page).
The SLA is set for a queue (or set of queues to be reported on at once) though the parameter "Service Level Agreement" on the Queue configuration page; if missing, the default value is taken from the property sla.max_initial_delay.
Each call is grouped into a "bucket" based on skills found; skills are sorted by Skill Sort Weight in order to create unique buckets for each permutation. Only buckets with at least one call are added to the report. Buckets are displayed with codes correctly decoded. To change the order of how the skills appear inside each bucket, make sure to adjust the Skill Sort Weight field in the Agents Skill editor. Skills with a lower sort weight are positioned before skills with higher sort weight. If two skills have the same sort weight, they are sorted alphabetically based on their description.
For example, a call with skills “inv en fix” is set to a bucket “en fix inv”, that is a separate bucket from e.g. “en fix” but is is the same as “en inv fix” . Such a call is displayed in a column named “English Fix Invoice”, where the names are based on the descripitions used for skills, sorted by the skills' sort weight.
The report shows the following columns:
-
Time Slot: a call is banded in a time slot based on the time it is queued
-
Answered calls: Total number of answered calls for this slot
-
Unanswered calls: total number of lost calls for this slot
-
Num: Total Answered + Unanswered
-
Within SLA
Xsec: the number of calls answered within X seconds divided the total number of calls offered (answered+lost) -
"bucket": the total number of calls (taken+lost) that belong to this bucket
| As the report may be very large, if you export it to PDF it may be cut on the right side. XLS report works without problems instead. |
Available since |
16.10.11 |
Default page |
Call distribution, by day |
Shortcut code |
DD09 |
API block name |
CallDistrDO.SkillsPerDay |
Parameters |
- |
See also |
DH09, DW09 |
DD10 - Detail Summary
This reports shows the number of taken and lost call by day.
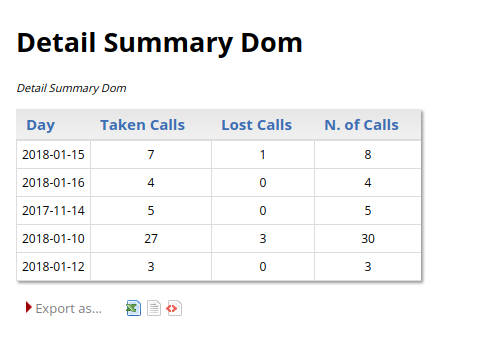
This report comes in three version, that show the number of calls in different time slices. The available period of times are:
-
Hourly [DH10]
-
Days of the week [DW10]
-
Days (with date) [DD10]
The information is the following
-
Taken Calls
-
Lost Calls
-
N. of Calls
Available since |
17.06.16 |
Default page |
Detail Summary, by day |
Shortcut code |
DD10 |
API block name |
CallDistrDO.DetailSummaryDom |
Parameters |
- |
See also |
DH10, DW10 |
Historical reports - Call distribution by hour
Events are shown on a 24-hour distribution.
DH01 - Answered call distribution per hour
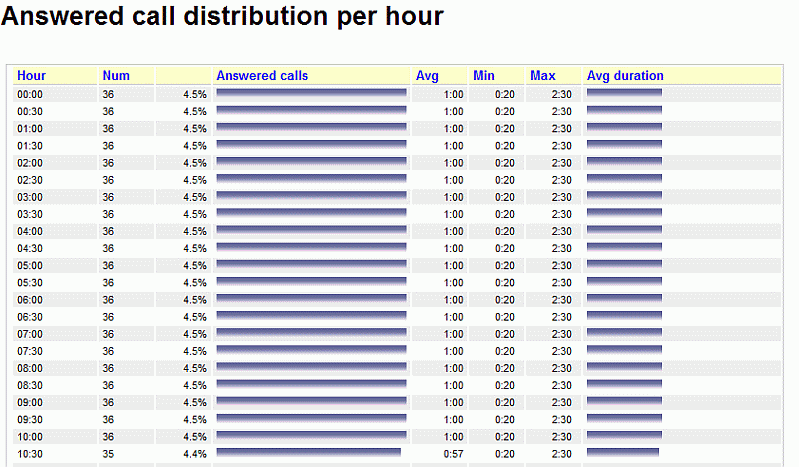
The total numbers of call lengths for answered calls are plotted for each hourly interval. The size of hourly intervals can be controlled by the default.hourly_slot configuration property, making it possible to run this reports based on 30-minute, 20-minute or 15-minute intervals.
Available since |
1.6.0 |
Default page |
Call distribution, by hour |
Shortcut code |
DH01 |
API block name |
CallDistrDO.AnsDistrPerHr |
Parameters |
- |
See also |
DH02 - Answered call wait time per hour
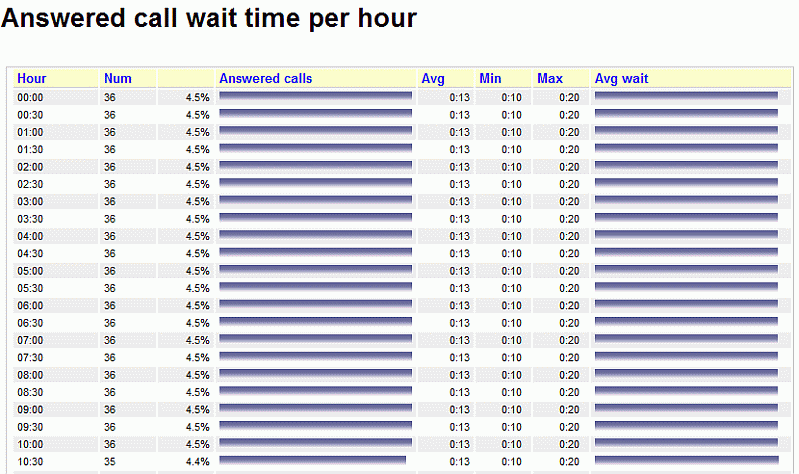
The total numbers of call wait time for answered calls are plotted for each hourly interval. The size of hourly intervals can be controlled by the default.hourly_slot configuration property, making it possible to run this reports based on 30-minute, 20-minute or 15-minute intervals.
Available since |
1.6.0 |
Default page |
Call distribution, by hour |
Shortcut code |
DH02 |
API block name |
CallDistrDO.AnsWaitPerHr |
Parameters |
- |
See also |
DH03 - Unanswered call wait time per hour
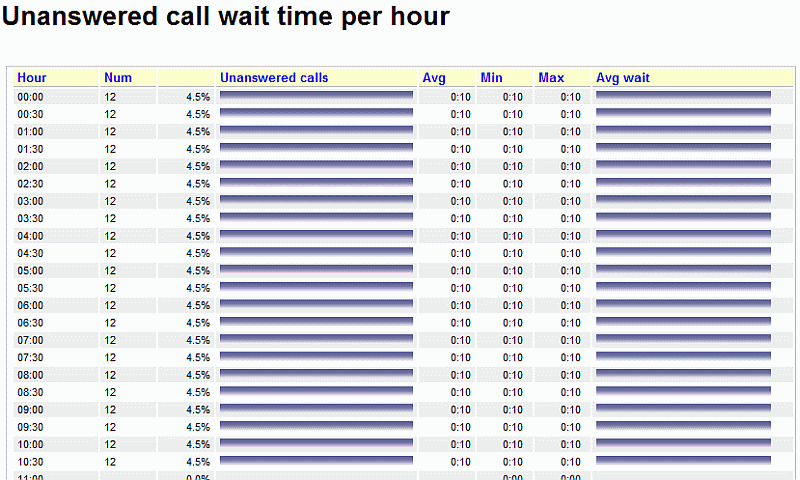
The total numbers of call lengths for unanswered calls are plotted for each hourly interval. The size of hourly intervals can be controlled by the default.hourly_slot configuration property, making it possible to run this reports based on 30-minute, 20-minute or 15-minute intervals.
Available since |
1.6.0 |
Default page |
Call distribution, by hour |
Shortcut code |
DH03 |
API block name |
CallDistrDO.UnansWaitPerHr |
Parameters |
- |
See also |
DH04 - Sales per hour
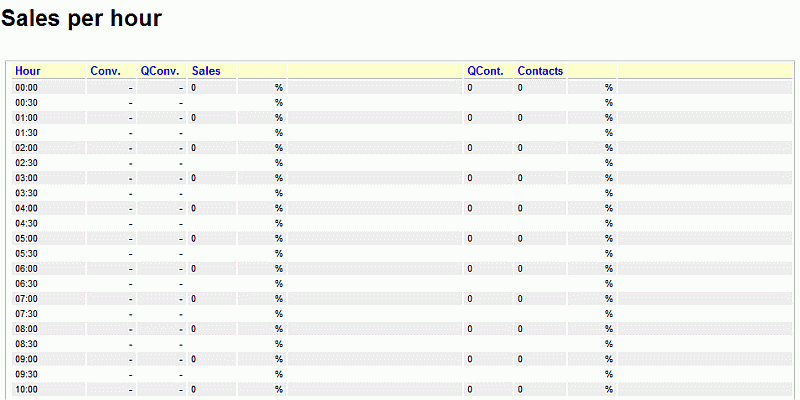
The total numbers sales and contacts, are plotted for each hourly interval. The size of hourly intervals can be controlled by the default.hourly_slot configuration property, making it possible to run this reports based on 30-minute, 20-minute or 15-minute intervals.
Available since |
1.6.0 |
Default page |
Call distribution, by hour |
Shortcut code |
DH04 |
API block name |
CallDistrDO.SalesPerHr |
Parameters |
- |
See also |
DH05 - Schedule Adherence per hour
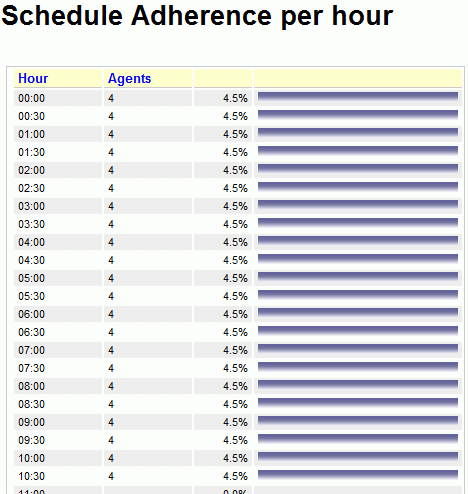
The Schedule Adherence report shows the number of distinct agents that were detected during the given period. This makes it possible to detect the number of different people that had been working on a given moment.
Available since |
1.6.0 |
Default page |
Call distribution, by hour |
Shortcut code |
DH05 |
API block name |
CallDistrDO.StaffPerHr |
Parameters |
- |
See also |
DH06 - Queue length per hour
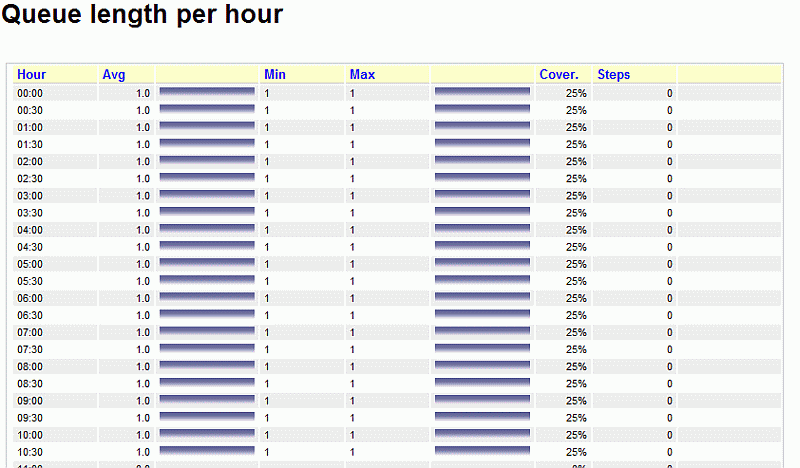
The Queue Length report shows the average length of the queue for each period, giving minimums and maximums. The Steps computation shows how fast each queue progresses during the period, expresses in steps per hour. Note: giving a meaning to the Queue Length reports may be hard in the case of composite queues.
Available since |
1.6.0 |
Default page |
Call distribution, by hour |
Shortcut code |
DH06 |
API block name |
CallDistrDO.QPosPerHr |
Parameters |
- |
See also |
DH07 - Inclusive SLA per hour

The inclusive SLA corresponds to the Service Level Agreement metrics shown on Service level agreement, grouped each hour.
Available since |
1.6.0 |
Default page |
Call distribution, by hour |
Shortcut code |
DH07 |
API block name |
CallDistrDO.InclSlaPerHr |
Parameters |
- |
See also |
DH08 - Traffic Analysis by period - per hour
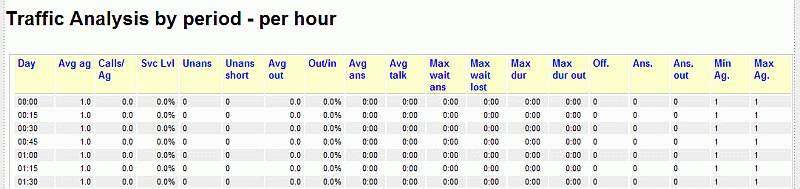
Distribution of calls and agent availability per hour (or interval you specified). The whole 24h are mapped out for ease of comparison.
For a complete description of parameters, see DD08 - Traffic Analysis by period - per day
Available since |
1.6.0.4 |
Default page |
Call distribution, by hour |
Shortcut code |
DH08 |
API block name |
CallDistrDO.TrafficAnPerHr |
Parameters |
- |
See also |
DD08, DW08 |
DH09 - Skill sets per hour
This reports shows the unique sets of skills during a specified time period.
For a complete description of parameters and behavior, see DD09 - Skill sets per day
Available since |
16.10.11 |
Default page |
Call distribution, by day |
Shortcut code |
DH09 |
API block name |
CallDistrDO.SkillsPerHour |
Parameters |
- |
See also |
DD09, DW09 |
DH10 - Detail Summary
This reports shows the number of taken and lost call by hour.
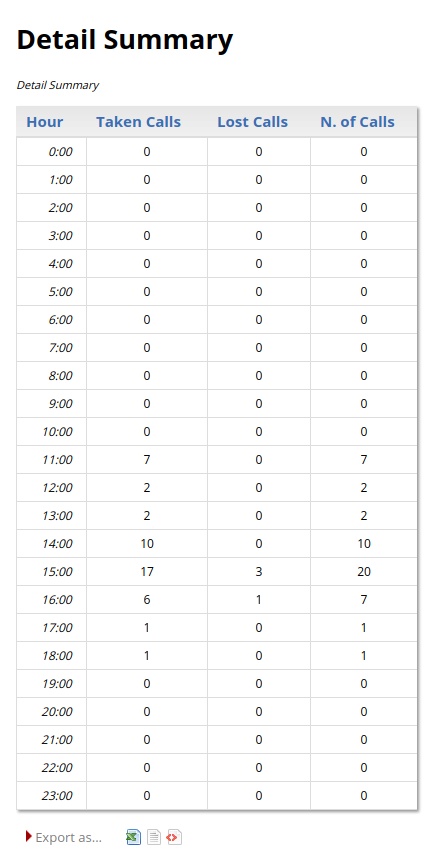
For a complete description of parameters and behavior, see DD10 - Detail Summary by day
Available since |
17.06.16 |
Default page |
Detail Summary, by hour |
Shortcut code |
DH10 |
API block name |
CallDistrDO.DetailSummary |
Parameters |
- |
See also |
DD10, DW10 |
Historical reports - Call distribution by day of week
This report shows the weekly behaviour of your queues. The longer the analysis period, the more significant its results will be.
DW01 - Answered call distribution per day of week
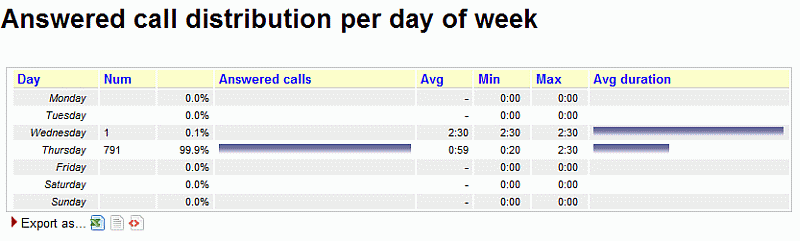
The total numbers of call lengths for answered calls are plotted for each day of the week.
Available since |
1.6.0 |
Default page |
Call distribution, by day of week |
Shortcut code |
DW01 |
API block name |
CallDistrDO.AnsDistrPerDOW |
Parameters |
- |
See also |
DW02 - Answered call wait time per day of week
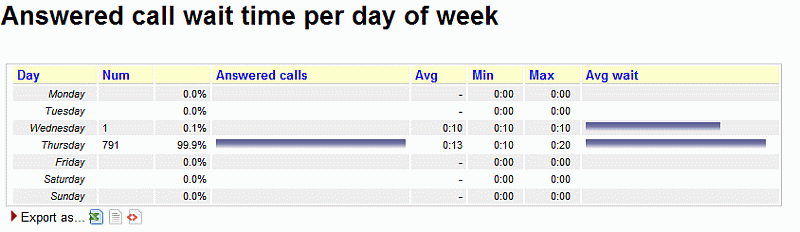
The total numbers of call wait time for answered calls are plotted for each day of the week.
Available since |
1.6.0 |
Default page |
Call distribution, by day of week |
Shortcut code |
DW02 |
API block name |
CallDistrDO.AnsWaitPerDOW |
Parameters |
- |
See also |
DW03 - Unanswered call wait time per day of week
The total numbers of call wait time for unanswered calls are plotted for each day of the week.
Available since |
1.6.0 |
Default page |
Call distribution, by day of week |
Shortcut code |
DW03 |
API block name |
CallDistrDO.UnansWaitPerDOW |
Parameters |
- |
See also |
DW04 - Sales per day of week
The total numbers sales and contacts, are plotted for each day of the week.
Available since |
1.6.0 |
Default page |
Call distribution, by day of week |
Shortcut code |
DW04 |
API block name |
CallDistrDO.SalesPerDOW |
Parameters |
- |
See also |
DW05 - Schedule Adherence per day of week
The Schedule Adherence report shows the number of distinct agents that were detected during the given period. This makes it possible to detect the number of different people that had been working on a given moment.
Available since |
1.6.0 |
Default page |
Call distribution, by day of week |
Shortcut code |
DW05 |
API block name |
CallDistrDO.StaffPerDOW |
Parameters |
- |
See also |
DW06 - Queue length per day of week
The Queue Length report shows the average length of the queue for each period, giving minimums and maximums. The Steps computation shows how fast each queue progresses during the period, expresses in steps per hour. Note: giving a meaning to the Queue Length reports may be hard in the case of composite queues.
Available since |
1.6.0 |
Default page |
Call distribution, by day of week |
Shortcut code |
DW06 |
API block name |
CallDistrDO.QPosPerDOW |
Parameters |
- |
See also |
DW07 - Inclusive SLA per day of week
The inclusive SLA corresponds to the Service Level Agreement metrics shown on Service level agreement, grouped for each day of week.
Available since |
1.6.0 |
Default page |
Call distribution, by day of week |
Shortcut code |
DW07 |
API block name |
CallDistrDO.InclSlaPerDOW |
Parameters |
- |
See also |
DW08 - Traffic Analysis by period - per day of week
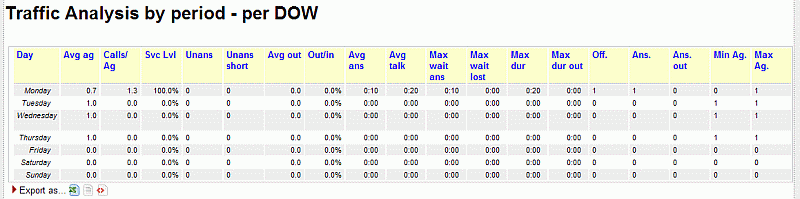
Distribution of calls and agent availability per day of week.
For a complete description of parameters, see DD08 - Traffic Analysis by period - per day
Available since |
1.6.0.4 |
Default page |
Call distribution, by day of week |
Shortcut code |
DW08 |
API block name |
CallDistrDO.TrafficAnPerDOW |
Parameters |
- |
See also |
DD08, DH08 |
DW09 - Skill sets per day of week
This reports shows the unique sets of skills during a specified time period.
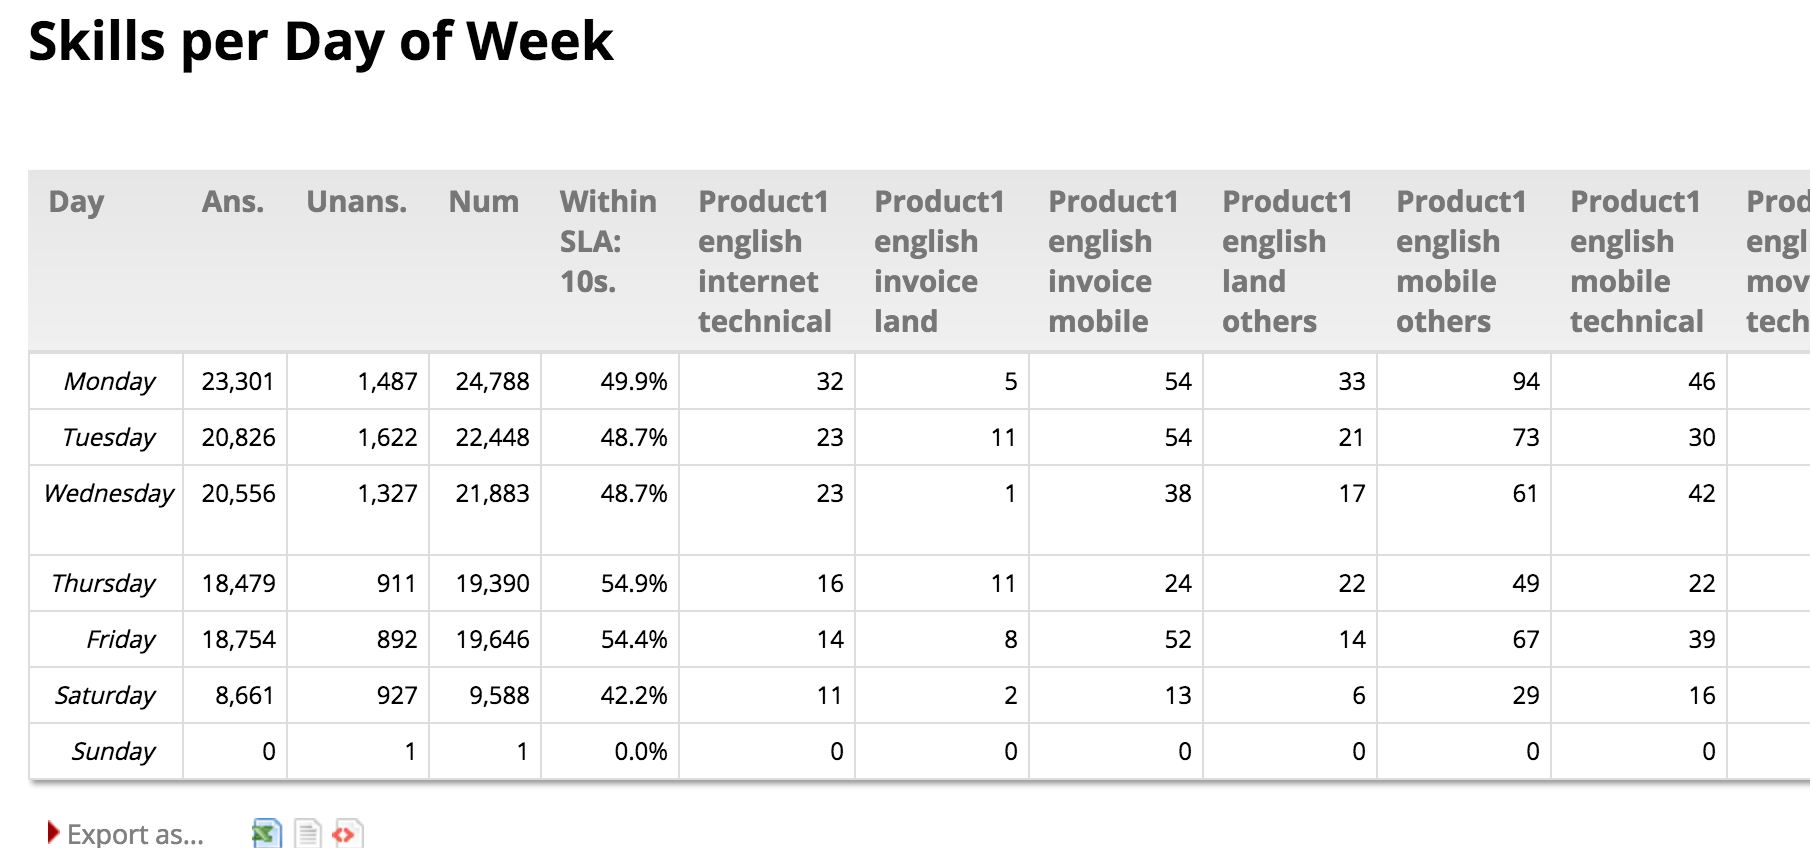
For a complete description of parameters and behavior, see DD09 - Skill sets per day
Available since |
16.10.11 |
Default page |
Call distribution, by day |
Shortcut code |
DW09 |
API block name |
CallDistrDO.SkillsPerHour |
Parameters |
- |
See also |
DD09, DH09 |
DW10 - Detail Summary by Day of the week
This reports shows the number of taken and lost call by day of the week.
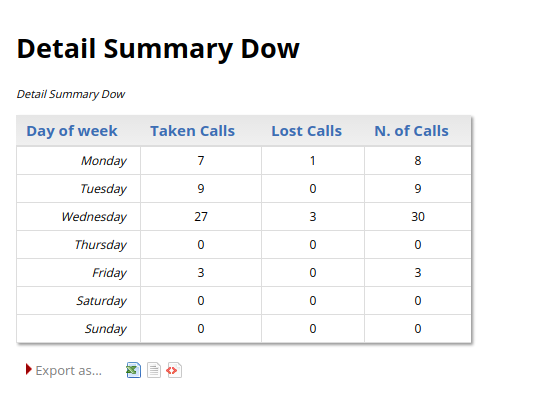
For a complete description of parameters and behavior, see DD10 - Detail Summary by day
Available since |
17.06.16 |
Default page |
Detail Summary by day of the week |
Shortcut code |
DW10 |
API block name |
CallDistrDO.DetailSummaryDow |
Parameters |
- |
See also |
DD10, DH10 |
Historical reports - Agents and Sessions
Agent activity refers to the behaviour of Asterisk defined agents. If you connect you queues straight to telephone terminals, this section will always be empty.
Each agent may be flagged as being a member of four priority groups:
-
Main: the agents usually answering the queue
-
Spill: the agents answering the queue if all "Main" agents are busy or unavailable
-
Wrap: the agents answering the queue if all "Main" and "Spill" agents are busy or unavailable
-
Undefined: this agent is not a member of any priority group for this queue
This feature is useful if priority groups are used in the queue configuration. If they are not used, just assign all agents to "Main" for each queue.
If an unknown agent appears on a queue, it will be marked as "Undefined", written in red.
Agent names are written in blue and are clickable, if you click on them in any of the graphs, you will be lead to a popup that detail the logon and pause history for that agent.
As a default, QueueMetrics will show and count an agent session if and only if the agent handled at least one call during this session. This may not be what you want when you use pause codes - an agent may log on and immediately go on pause to do some back-end activities. If this is the case, you should set the configuration option default.useRawAgentSessions to true to see all agent sessions.
AG01 - Agent session detail
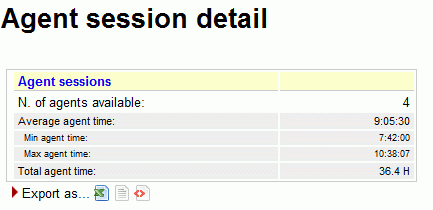
This report shows:
-
The number of available agents in the considered period
-
The average agent time availability
-
The minumum agent time availability
-
The maximum agent time availability
-
The cumulated agents time availability
Available since |
1.6.0 |
Default page |
Agents and Sessions |
Shortcut code |
AG01 |
API block name |
AgentsDO.ReportAgents |
Parameters |
- |
See also |
AG02 - Session and pause durations
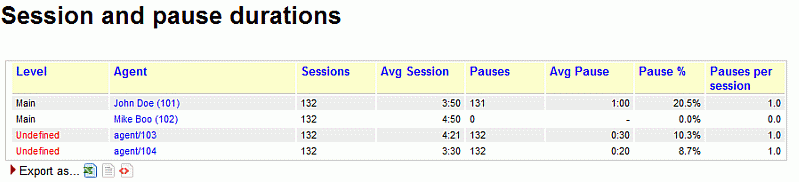
This report shows:
-
The number of sessions for each available agent
-
The number of pauses for each available agent
-
The average pause time
-
The percentage between the pause time and the availability time for each agent
-
The number of pauses for each session, for each available agent
Available since |
1.6.0 |
Default page |
Agents and Sessions |
Shortcut code |
AG02 |
API block name |
AgentsDO.SessionPauseDur |
Parameters |
- |
See also |
AG03 - Agent availability (for all the queues they are member of)
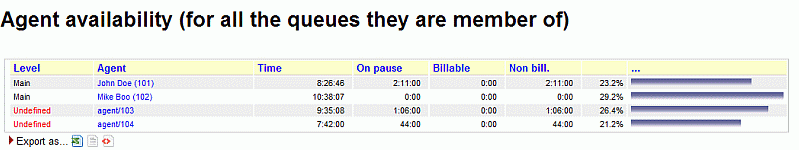
This report shows:
-
The agent available time
-
The total billable and not billable pause times
In the latest release a new column has been added (Paused on Conversation), which displays occupancy values.
Available since |
1.6.0 |
Default page |
Agents and Sessions |
Shortcut code |
AG03 |
API block name |
AgentsDO.AgentAvail |
Parameters |
- |
See also |
AG04 - Answered calls (for selected queues)
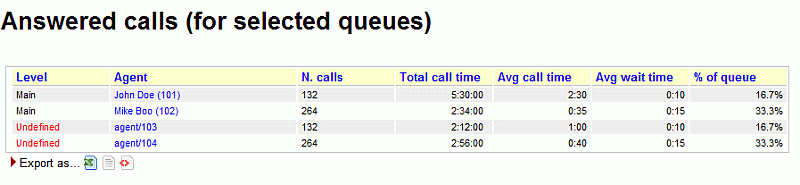
This report shows:
-
The number of answered calls for each agent
-
The cumulated call time for each agent
-
The average call time for each agent
-
The average wait time for each call taken
-
The percentage of taken calls, related to the total queue calls, for each agent
Available since |
1.6.0 |
Default page |
Agents and Sessions |
Shortcut code |
AG04 |
API block name |
AgentsDO.AnsCallsQueues |
Parameters |
- |
See also |
AG05 - Answered calls by custom group
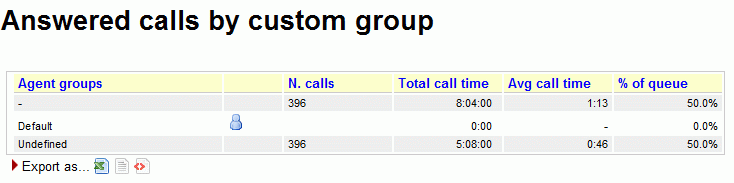
This report shows:
-
The number of answered calls for each defined agent group
-
The cumulated call time for each defined agent group
-
The average call time for each defined agent group
-
The percentage of taken calls, related to the total queue calls, for each defined agent group
The report displays separately the following cases:
-
Agents that are known to QueueMetrics but have no custom group, are counted under the group "-"
-
Agents that are not known to QueueMetrics but found in the analysis are counted under "Undefined".
Available since |
1.6.0 |
Default page |
Agents and Sessions |
Shortcut code |
AG05 |
API block name |
AgentsDO.AnsCallsCG |
Parameters |
- |
See also |
AG06 - Answered calls by location
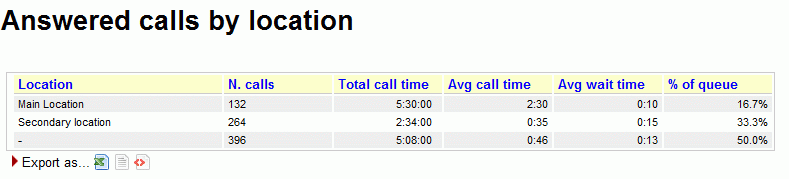
This report shows:
-
The number of answered calls for each defined location
-
The cumulated call time for each defined location
-
The average call time for each defined location
-
The average wait time for each defined location
-
The percentage of taken calls, related to the total queue calls, for each defined location
Available since |
1.6.0 |
Default page |
Agents and Sessions |
Shortcut code |
AG06 |
API block name |
AgentsDO.AnsCallsLocation |
Parameters |
- |
See also |
AG07 - Answered calls by service group
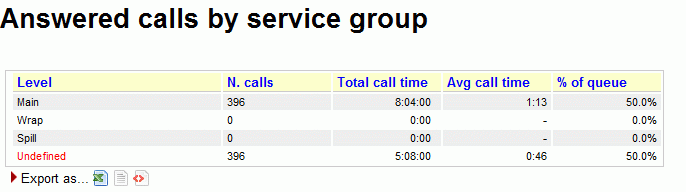
This report shows:
-
The number of answered calls for each defined service group
-
The cumulated call time for each defined service group
-
The average call time for each defined service group
-
The percentage of taken calls, related to the total queue calls, for each defined service group
Available since |
1.6.0 |
Default page |
Agents and Sessions |
Shortcut code |
AG07 |
API block name |
AgentsDO.AnsCallsSG |
Parameters |
- |
See also |
AG08 - Agent Performance by ACD Group
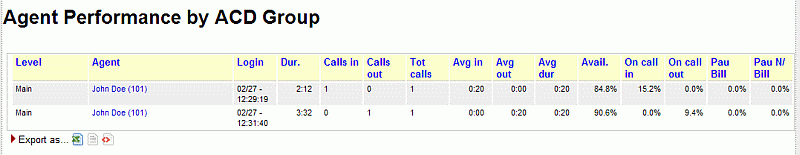
One entry is presented for each agent session. What makes this report different from most is that inbound and outbound activity for the agent is aggregated.
Items are computed as:
-
Level: the agent level this agent belongs to
-
Agent: agent name (if present) or Asterisk internal code if unknown. By clicking on it, the session details open.
-
Login: Session login time
-
Duration: Session duration
-
N.calls in: Number of calls taken for this queue(s)
-
N calls out: Number of calls outbound made for these campaign(s)
-
Tot calls: calls in + calls out
-
Average duration IN
-
Average duration OUT
-
Average duration for all (weighted)
-
Available: precentage of idle time
-
On call IN: percentage of time on call inbound
-
On call OUT: percentage of time on call outbound
-
Pause Billable: percentage of time on a pause code marked as billable
-
Pause Unbillable: percentage of time on a pause code marked as unbillable, or not specified, or unknown. (a.k.a. Clerical time)
Available since |
1.6.0.4 |
Default page |
Agents and Sessions |
Shortcut code |
AG08 |
API block name |
AgentsDO.PerformanceAcdGroups |
Parameters |
- |
See also |
AG09 - Agent Occupancy Report
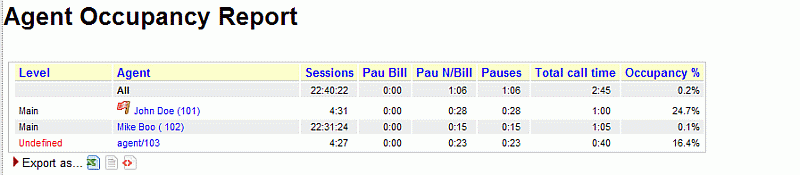
The report details the occupancy rate for each and all agents in the current analysis.
-
The Agent column contains the decoded name, level and current group of the agent (if defined, expressed as an icon like elsewhere in QM). By clicking on the agent name, it is possible to open a popup with the session details for that agent.
-
Total session time is the sum of the duration of all sessions in the current analysis, from start to end.
-
Pause Billable is the total time on Billable pauses, for all sessions considered.
-
Pause Non Billable is the total time on Non-Billable pauses, for all sessions considered.
-
Total pause time is the sum of all pauses for all sessions considered.
-
Total talk time is the sum of all time that the specified agent spent in conversation during the sessions considered.
-
Occupancy is computed as: Talk time / (Total session - Total Pause) and expressed as a percentage, as per the numeric examples show in the table above.
In the latest release a new column has been added (Paused Conversation) which is subtracted from the total pauses time; this way Occupancy will never be able to be over 100%.
The first line is labeled "All agents" and is computed according to the following rules:
-
Total session time, Pause billable, Pause non billable, Pause wrap, Total pause, Total talk time are computed as sums of the rest of data in each column
-
Occupancy is computed as: Sum talk time / (Sum Total session - Sum Total Pause)
The Occupancy report allows you to define custom calculations by entering one or more custom formulas in the Parameters field when editing your report.
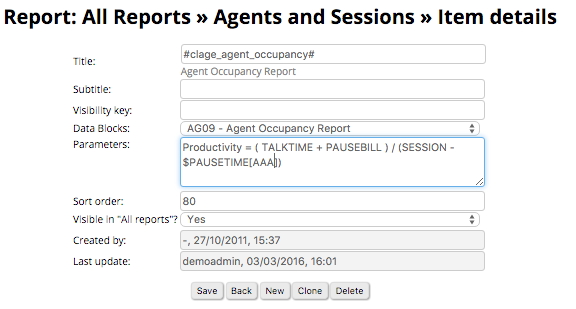
For example, if you add the formula:
Productivity = ( TALKTIME + PAUSEBILL ) / (SESSION - ($PAUSETIME[AAA] + $PAUSETIME[BB]))
A new column "Productivity" will be computed based on the formula supplied. At the moment, the formula will always be displayed as a percentage.
New columns can be programmed as explained in User-Programmable reports
| A version of this data block meant to be completely customized is available as AG18. |
Available since |
1.6.2.4 - Formulas available since 15.10.5 |
Default page |
Agents and Sessions |
Shortcut code |
AG09 |
API block name |
AgentsDO.AgentOccupancy |
Parameters |
Agent parameters - See Variables bound for Agent blocks |
See also |
AG10 - Agent Session Time by Hour
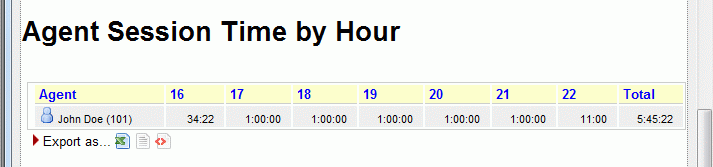
The report details the total presence time of each agent over the 24h for which you are running the current analysis.
-
The Agent column contains the agent’s decoded name, level and current group (if defined, expressed as an icon like elsewhere in QM).
-
Total time is the sum of the duration of all sessions included in the current analysis, from start to end.
-
One or more columns are present for each hour’s timeframe where total session information is present
Available since |
1.7.2 |
Default page |
Agents and Sessions |
Shortcut code |
AG10 |
API block name |
AgentsDO.AgentBillableTimeByHour |
Parameters |
- |
See also |
AG11 - Agent Payable Time by Hour
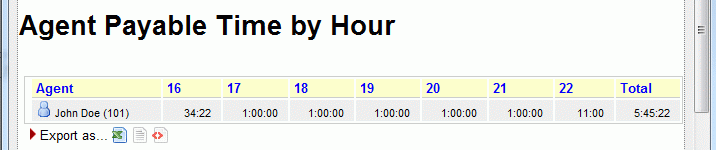
The report details the payable presence time of each agent over the 24h for which you are running the current analysis.
-
The Agent column contains the agent’s decoded name, level and current group (if defined, expressed as an icon like elsewhere in QM).
-
Total time is the sum of the duration of payable session time within the current analysis, from start to end.
-
One or more columns are present for each hour’s timeframe where payable session information is present
Available since |
1.7.2 |
Default page |
Agents and Sessions |
Shortcut code |
AG11 |
API block name |
AgentsDO.AgentPayableTimeByHour |
Parameters |
- |
See also |
AG12 - Agent Billable Time by Hour
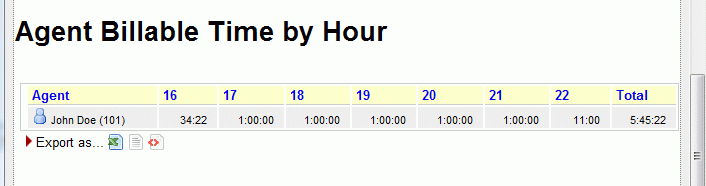
The report details the billable presence time of each agent over the 24h for which you are running the current analysis.
-
The Agent column contains the agent’s decoded name, level and current group (if defined, expressed as an icon like elsewhere in QM).
-
Total time is the sum of the duration of billable session time within the current analysis, from start to end.
-
One or more columns are present for each hour’s timeframe where billable session information is present
Available since |
1.7.2 |
Default page |
Agents and Sessions |
Shortcut code |
AG12 |
API block name |
AgentsDO.AgentBillableTimeByHour |
Parameters |
- |
See also |
AG13 - Agent Session View
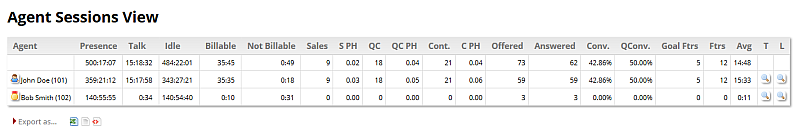
This report shows a set of calls aggregated by agents. It reports session information and shows, for each agent, the main figures for aggregated calls related to that agent. The first row reports the overall aggregated values.
Each row in the report shows:
-
The agent name (the first line contains all agents information)
-
Presence, calculated as sum of all agent sessions (so including pauses time)
-
Talk time
-
Idle time, calculated by subtracting pauses and talk time from the presence figure
-
Idle time (No Wait), calculated by subtracting pauses talk time and Wait time from the presence figure
-
Billable time
-
Not billable time
-
Total Wait Time
-
Sales: the number of taken calls flagged "sales"
-
S PH (Sales per hour): the number of sales per hour ratio
-
QC: the number of taken calls flagged as qualified contacts
-
QC PH: Qualified contacts per hour
-
Cont: number of taken calls flagged as "contacts"
-
CPH: Contacts per hour
-
Offered: Overall taken + lost calls
-
Answered: taken calls
-
Conv: convertion ratio
-
QConv: qualified convertion ratio
-
Goal Ftrs: number of goal flagged feature codes found in the call dataset
-
Ftrs: number of feature codes found in the call dataset
-
Avg: average talk time
-
T: by clicking on that icon, a popup with the taken call list (used to count the aggregated) is shown
-
L: by clicking on that icon, a popup with the lost call list (used to count the aggregated) is shown
| Regarding inbound calls, when looking at a single agent, the concept of "offered call" will coincide with the concept of "answered call". This is because this report does not keep track of the various attempts for agent, but only registers the call as an answered call for the agent that actually answered the call. This will eventually result in the first row containing a number of offered calls that is higher than the number of answered calls, while on the single agents rows the offered and answered calls will be the same. |
| Regarding the "Total Wait Time" field, it’s important to know that the wait time data refers to the sum of the wait time of all the calls that the agent answered. This does not mean that the wait time listed here is the same as the time the agent took before answering the call, but rather the time that the various calls have been waiting in the queue. This may include wait times that happened before the agent was free and thus unable to answer the call. To check the actual wait time before a particular agent answered a call, please refer to report AT03 "ACD attempts by terminal". |
Available since |
15.9 |
Default page |
Agents and Sessions |
Shortcut code |
AG13 |
API block name |
AgentsDO.AgentSessionsView |
Parameters |
- |
See also |
AG14 - Queue Session View
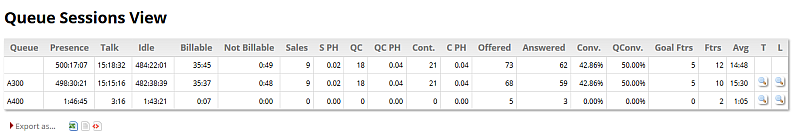
This report shows a set of calls aggregated by queue. It reports queue information and shows, for each queue, the main figures for aggregated calls related to that queue. The first row reports the overall aggregated values.
Each row in the report shows:
-
The queue name (the first line contains all queues information)
-
Presence, calculated as sum of all agent sessions in the queue
-
Talk time
-
Idle time, calculated by subtracting pauses and talk time from the presence figure
-
Billable time
-
Not billable time
-
Sales: the number of taken calls flagged "sales"
-
S PH (Sales per hour): the number of sales per hour ratio
-
QC: the number of taken calls flagged as qualified contacts
-
QC PH: Qualified contacts per hour
-
Cont: number of taken calls flagged as "contacts"
-
CPH: Contacts per hour
-
Offered: Overall taken + lost calls
-
Answered: taken calls
-
Conv: convertion ratio
-
QConv: qualified convertion ratio
-
Goal Ftrs: number of goal flagged feature codes found in the call dataset
-
Ftrs: number of feature codes found in the call dataset
-
Avg: average talk time
-
T: by clicking on that icon, a popup with the taken call list (used to count the aggregated) is shown
-
L: by clicking on that icon, a popup with the lost call list (used to count the aggregated) is shown
| QueueMetrics uses an approach where it does not exactly track sessions per queue. If an agent joins and leaves multiple queues during the same session, QueueMetrics does not track where each session starts and ends. Therefore, while we may get accurate details of the time an agent was available, if an agent may cherry pick queues or work on multiple queues at once, we will have to find a way to estimate when its time was spent. In order to do this QueueMetrics counts the local time an agent was available per session, then it multiplies this value by the percentage of talk time that happened on each queue. |
Available since |
15.9 |
Default page |
Agents and Sessions |
Shortcut code |
AG14 |
API block name |
AgentsDO.QueueSessionsView |
Parameters |
- |
See also |
AG15 - Agents by Hour
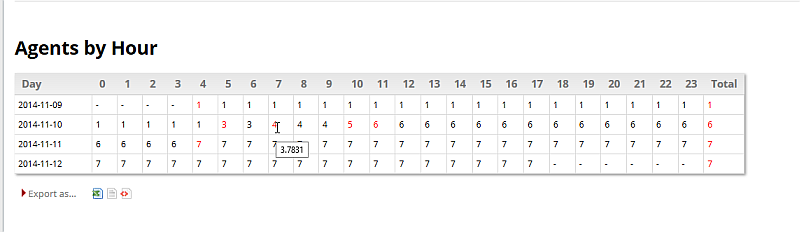
The report details the number of agents available on the selected queues each hour for each day in the report.
-
The first column (Day) reports the date who the line is referred to
-
The next 24 columns report the number of agents found for at least one second in the associated hour. Numbers are reported black if the timeband has been covered completely by the agents, are reported red if at least one agent is not present for the whole hour. In this case, by flying over the red number the user can have an idea on what’s the coverage percentage for the timeband. The coverage is counted as the sum of periods, in seconds, the agents cumulated in that timeband, divided by 3600 seconds.
-
The last column reports the agents seen, for at least one second, during the day
Available since |
14.10.5-938 |
Default page |
Agents and Sessions |
Shortcut code |
AG15 |
API block name |
AgentsDO.AgentByHour |
Parameters |
- |
See also |
AG16 - Tag Session View
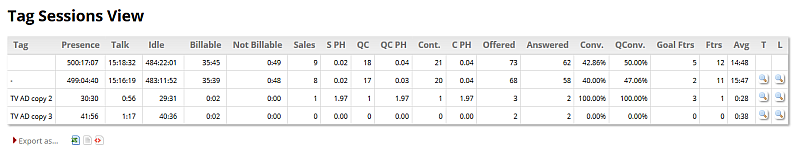
This report shows a set of calls aggregated by tag. It reports tags information and shows, for each tag, the main figures for aggregated calls related to that tag. The first row reports the overall aggregated values.
Each row in the report shows:
-
The tag name (the first line contains all tags information)
-
Presence, calculated as sum of all agent sessions for agents taking calls with related tag
-
Talk time
-
Idle time, calculated by subtracting pauses and talk time from the presence figure
-
Billable time
-
Not billable time
-
Sales: the number of taken calls flagged "sales"
-
S PH (Sales per hour): the number of sales per hour ratio
-
QC: the number of taken calls flagged as qualified contacts
-
QC PH: Qualified contacts per hour
-
Cont: number of taken calls flagged as "contacts"
-
CPH: Contacts per hour
-
Offered: Overall taken + lost calls
-
Answered: taken calls
-
Conv: convertion ratio
-
QConv: qualified convertion ratio
-
Goal Ftrs: number of goal flagged feature codes found in the call dataset
-
Ftrs: number of feature codes found in the call dataset
-
Avg: average talk time
-
T: by clicking on that icon, a popup with the taken call list (used to count the aggregated) is shown
-
L: by clicking on that icon, a popup with the lost call list (used to count the aggregated) is shown
| QueueMetrics uses an approach where it does not exactly track sessions per tag. If an agent joins and leaves multiple queues during the same session, QueueMetrics does not track where each session starts and ends. Therefore, while we may get accurate details of the time an agent was available, if an agent may cherry pick queues or work on multiple queues at once, we will have to find a way to estimate when its time was spent. In order to do this QueueMetrics counts the local time an agent was available per session, then it multiplies this value by the percentage of talk time that happened on each queue. |
Available since |
15.09 |
Default page |
Agents and Sessions |
Shortcut code |
AG16 |
API block name |
AgentsDO.TagSessionsView |
Parameters |
- |
See also |
AG17 - Cumulated sessions by Queue, Tag
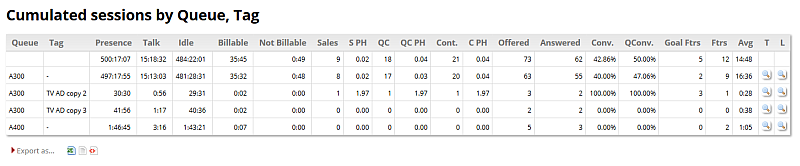
This report shows a set of calls aggregated by queue and tag. It reports queue and tags information and shows, for each queue/tag pair, the main figures for aggregated calls related to that pair. The first row reports the overall aggregated values.
Each row in the report shows:
-
The queue name (the first line contains all queues information)
-
The tag name (the first line contains all tags information)
-
Presence, calculated as sum of all agent sessions for agents taking calls with related tag
-
Talk time
-
Idle time, calculated by subtracting pauses and talk time from the presence figure
-
Billable time
-
Not billable time
-
Sales: the number of taken calls flagged "sales"
-
S PH (Sales per hour): the number of sales per hour ratio
-
QC: the number of taken calls flagged as qualified contacts
-
QC PH: Qualified contacts per hour
-
Cont: number of taken calls flagged as "contacts"
-
CPH: Contacts per hour
-
Offered: Overall taken + lost calls
-
Answered: taken calls
-
Conv: convertion ratio
-
QConv: qualified convertion ratio
-
Goal Ftrs: number of goal flagged feature codes found in the call dataset
-
Ftrs: number of feature codes found in the call dataset
-
Avg: average talk time
-
T: by clicking on that icon, a popup with the taken call list (used to count the aggregated) is shown
-
L: by clicking on that icon, a popup with the lost call list (used to count the aggregated) is shown
| QueueMetrics uses an approach where it does not exactly track sessions per queue/tag. If an agent joins and leaves multiple queues during the same session, QueueMetrics does not track where each session starts and ends. Therefore, while we may get accurate details of the time an agent was available, if an agent may cherry pick queues or work on multiple queues at once, we will have to find a way to estimate when its time was spent. In order to do this QueueMetrics counts the local time an agent was available per session, then it multiplies this value by the percentage of talk time that happened on each queue. |
Available since |
15.09 |
Default page |
Agents and Sessions |
Shortcut code |
AG17 |
API block name |
AgentsDO.SessionByQueueTagReport |
Parameters |
- |
See also |
AG18 - Programmable Agent Performance
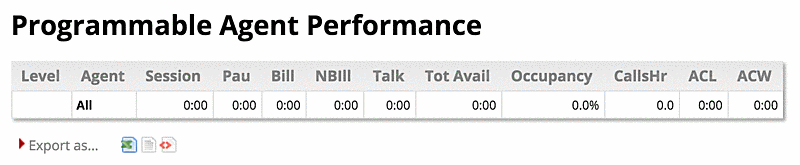
This block just includes the first two columns: Level and Agent. All other columns are to be programmed by the user as explained in User-Programmable reports .
This block is meant as a completyl configurable version of block AG09.
Available since |
15.10.8 |
Default page |
Agents and Sessions |
Shortcut code |
AG18 |
API block name |
AgentsDO.ProgAgPerf |
Parameters |
Agent parameters - See Variables bound for Agent blocks |
See also |
AG19 - Detailed Pause Tracking
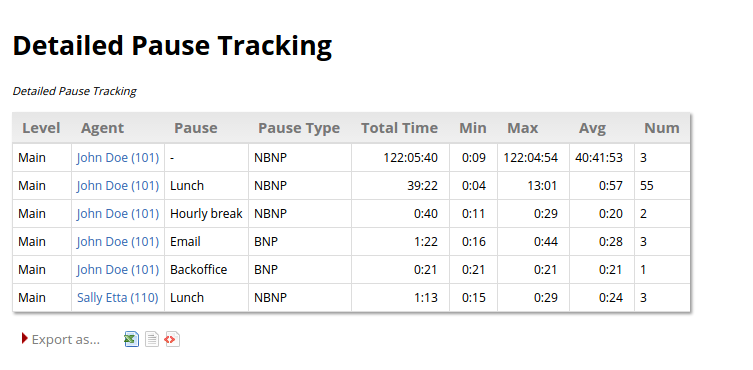
This block shows detailed information about agent pauses, including total pause time, average duration, maximum duration, minimum duration and number of pauses. This information is aggregated by agent and pause. For each agent/pause pair the agent’s name and the pause code are displayed, together with the information described above.
The last two columns show the percentage of such pauses out of the the total session time for the given agent, and out of the total pause time for the given agent. For example, if an agent was logged in for four hours, two of which were on pause, and the current pause code has a total of one hour, it would show as 50% of all pauses and 25% of all session time for the agent.
Available since |
16.10 - updated in 24.05 |
Default page |
Agents and Sessions |
Shortcut code |
AG19 |
API block name |
AgentsDO.DetailedPauses |
Parameters |
- |
See also |
AG20 - Agent Talk Time Per Hour
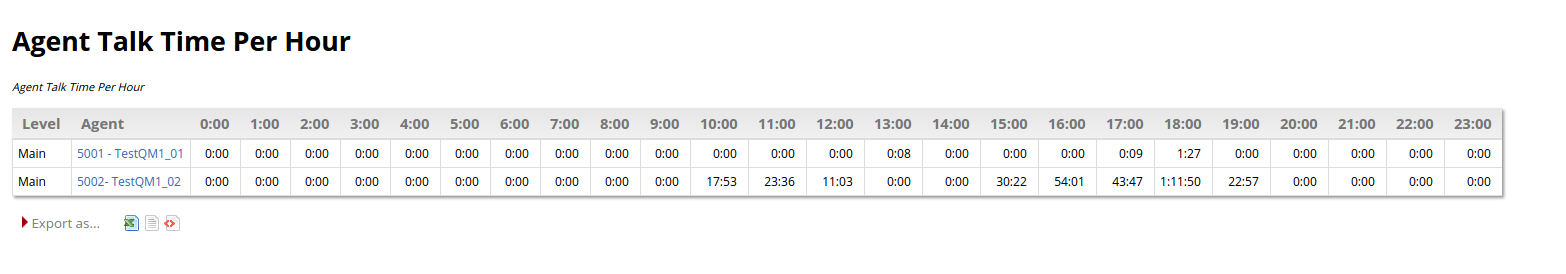
This block breaks down all the agents' talk times in one-hour long timeslots. This information is aggregated by agent, so you can keep track of how many minutes or hours of conversation your agents are having during the course of the day, across a given period of time. The name of the agent and the agent’s level are displayed as well as the information listed above.
Available since |
16.10.13 |
Default page |
Agents and Sessions |
Shortcut code |
AG20 |
API block name |
AgentsDO.AgentTTPerHour |
Parameters |
- |
See also |
AG21 - Agent Outbound Productivity
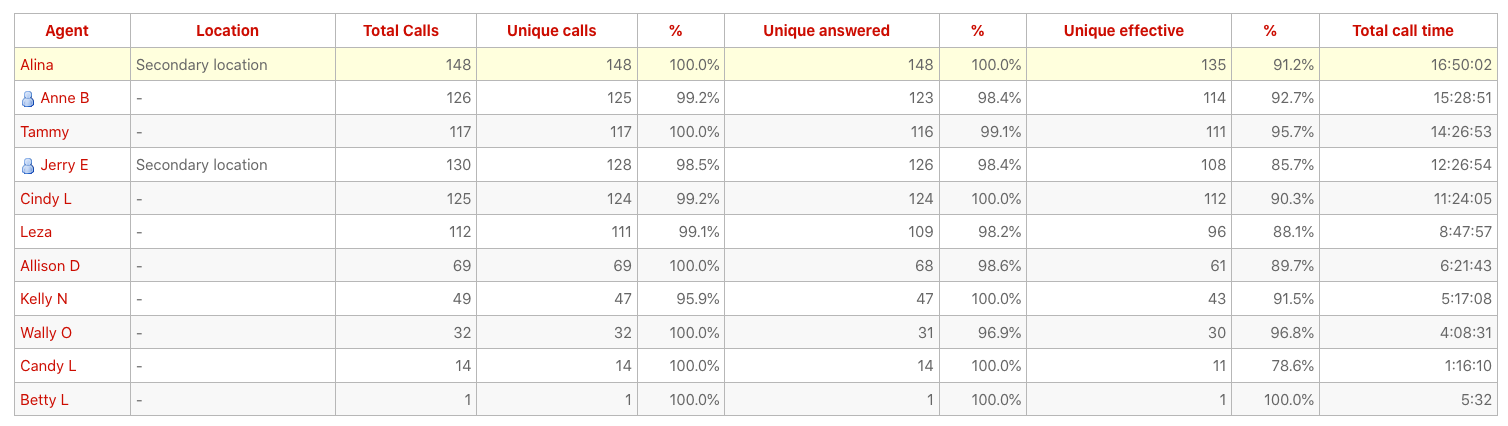
This block counts calls linked to an agent (both taken and lost); it is meant for outbound queues, though you can use it whenever it makes sense.:
-
Agent: the code/name and group icon
-
Location: the agent’s location (if set)
-
Total calls: all calls handled by this agent, answered or lost
-
Unique calls: all calls handled by this agent that have a unique telephone number
-
(Unique) %: the percentage of unique calls
-
Unique answered: all answered calls that have a unique number
-
(Answered) %: The percentage of unique answered to unique calls
-
Unique effective: the number of answered calls that lasted at least
Xseconds that have a unique number -
(Effective) %: the percentage of unique calls that are effective
-
Total Call Time: the total amount of time the agent spoke with a customer
Call numbers are computed lexicographically with no further processing, as they appear on the queue_log table. If a call has an empty number, then it counted in the number of calls and total call time but not in unique calls.
The report is sorted by talk time (descending) but can be sorted by name or any other value by clicking on its column header.
The threshold for including calls into Unique Effective is the configuration parameter default.effectiveCallThresold; default is 150 seconds.
Available since |
19.10.x |
Default page |
Agents and Sessions |
Shortcut code |
AG21 |
API block name |
AgentsDO.OutboundProductivity |
Parameters |
- |
See also |
AG22 - Agent Session Overview
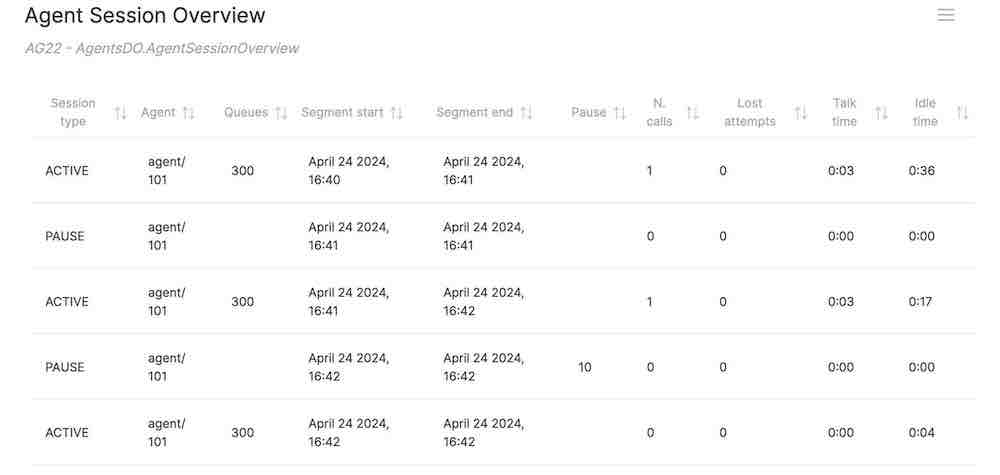
This data block is mostly useful in a JSON/RPC environment, where you have in a machine-friendly format the same data you get in the agent timeline. All agent activity is split into "segments" of uniform activity for each agent, and data has a minimal decoration for machine interoperability.
-
Session type: whether the agent is active or paused
-
Agent: the agent involved
-
Queues: one or more queues the agent is logged on to
-
Segment start and end
-
Pause: the pause code
-
N. calls
-
N. lost attempts
-
Talk time (if not paused)
-
Idle time (if not paused)
Available since |
24.05 |
Default page |
Agents and Sessions |
Shortcut code |
AG22 |
XML-RPC code |
AgentsDO.AgentSessionOverview |
See also |
AG23 - Details of Pause Types
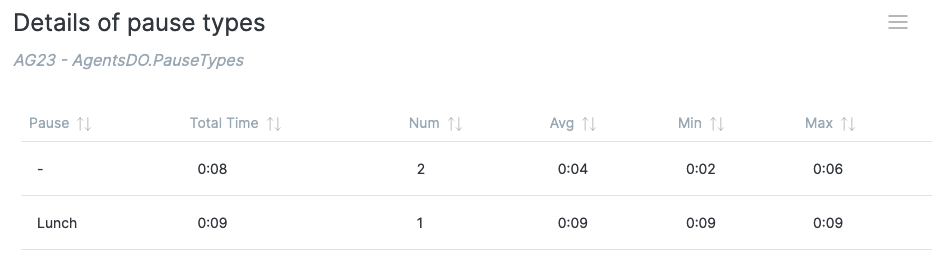
This report shows, for all of the pauses within the current report, given each pause code:
-
the total and average time spent on a pause code
-
the number of pauses
-
the average, minimun and maximum duration
If the pause code is unset, it is shown as "-"
Available since |
24.05 |
Default page |
Agents and Sessions |
Shortcut code |
AG23 |
API block name |
AgentsDO.PauseTypes |
Parameters |
- |
See also |
Historical reports - Details of agent sessions and pauses
AD01 - Detail of agent sessions
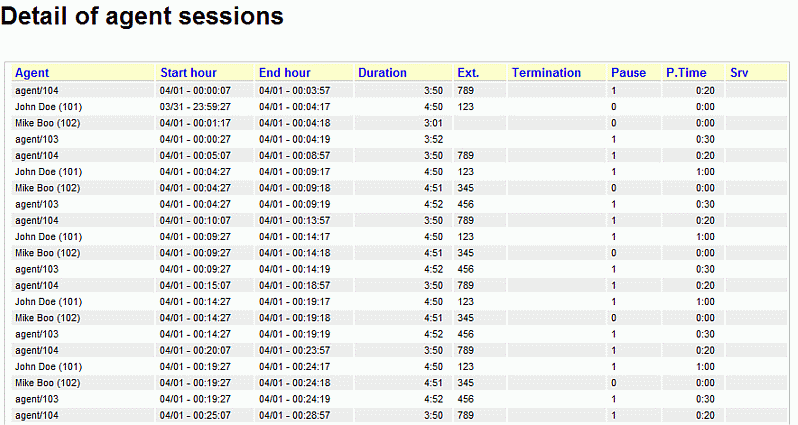
For each agent session, the start and end times are recorded, together with the total duration in seconds.
If the agent logs on via the call back function, the designated call back extension is shown.
The number of pauses and the total pause time in seconds is shown.
The "Srv" column tells you on which server an agent was working in case you set up a cluster of Asterisk servers.
It is possible to sort the table for each title, in either descending and ascending order. To do this, click once on the desired title for descending sort, and twice for ascending sort. Once the table is sorted, an arrow symbol will appear close to the title, so you know on which column it was sorted last. As the sorting is done on the client machine, it may take a while with very large tables.
Available since |
1.6.0 |
Default page |
Details of Agent sessions and pauses |
Shortcut code |
AD01 |
API block name |
DetailsDO.AgentSessions |
Parameters |
- |
See also |
AD02 - Detail of agent pauses
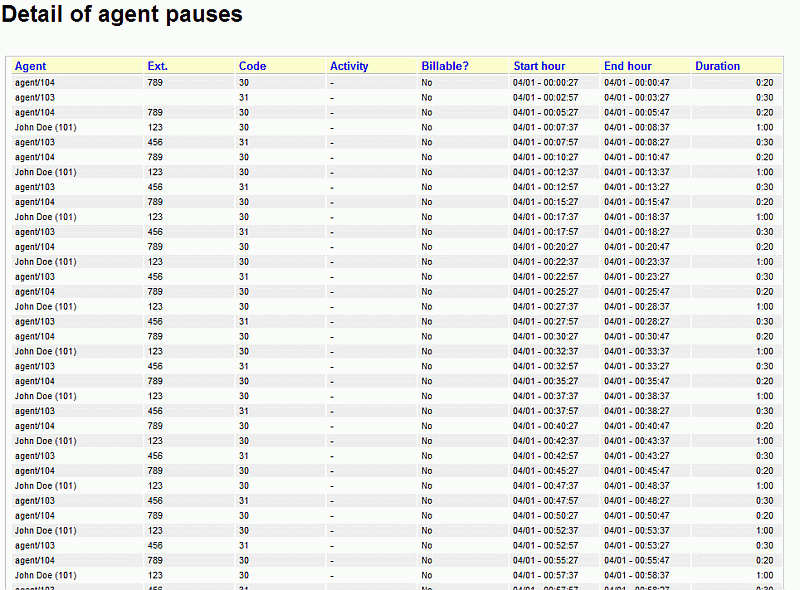
This table shows the specific pauses that each agent took and the pause code that was entered for each pause. It also shows whether the pause taken was considered to be billable or non-billable.
Available since |
1.6.0 |
Default page |
Details of Agent sessions and pauses |
Shortcut code |
AD02 |
API block name |
DetailsDO.AgentPauses |
Parameters |
- |
See also |
Popup of agent activity
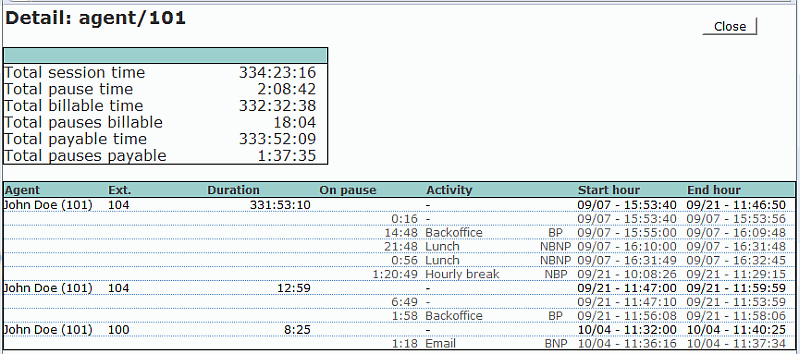
This is not a normal data block but it is the popup that is displayed whenever you click on an agent’s name.
-
The top table reports session, pause, billable and payable time
-
The bottom table shows the details of all agent sessions, with a break-up of all pauses that were made during that session. For each pause with a known pause code, their billable-payable status is displayed:
-
BP: Pause is Billable and Payable
-
BNP: Pause is Billable but not payable (be careful!)
-
NBP: Pause is not billable but Payable
-
NBNP: Pause is neither billable nor payable
-
In the latest release a new "Conversation" column has been added on, to the right of the "On Pause" column, which displays the pause time there may have been while actually in conversation.
You can close the popup by clicking on the Close button.
Historical reports - Call outcomes
If your agents are entering Pause codes or Call outcomes, the "Outcomes" tab will let you report on the information they just entered.
OU01 - Outcomes
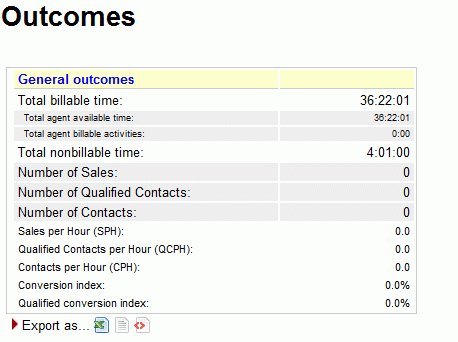
This report shows:
-
How much billable time there has been on this system, broken down by ACD/call time ("agent available time") and billable activities (agent on pause)
-
The total non billable time (e.g. lunch, breaks)
-
The total number of Contacts, Qualified Contacts and Sales, as defined by call outcome codes
-
The Sales per Hour (SPH), Qualified Contacts per hour (QCPH) and Contacts per Hour (CPH) ratios
-
The Conversion index, that is the percentage of sales over the total number of sales and contacts.
Available since |
1.6.0 |
Default page |
Call outcomes |
Shortcut code |
OU01 |
API block name |
OutcomesDO.GeneralRep |
Parameters |
- |
See also |
OU02 - Call results, by outcomes
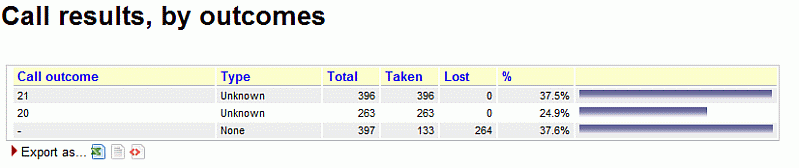
This report shows:
-
The number of total calls grouped by outcome
-
The number of answered calls grouped by outcome
-
The number of unanswered calls grouped by outcome
-
The percentage of calls related to each outcome
-
The percentage of taken calls related to each outcome (available since 16.10.13)
Available since |
1.6.0 |
Default page |
Call outcomes |
Shortcut code |
OU02 |
API block name |
OutcomesDO.CallResByOutcome |
Parameters |
- |
See also |
OU03 - Billable activities
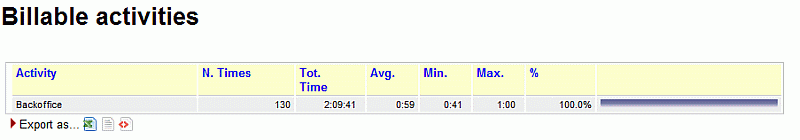
In this report you can find details explaining Billable activities, with average, minimum and maximum session durations, and a percentage on all activities of the same kind.
Available since |
1.6.0 |
Default page |
Call outcomes |
Shortcut code |
OU03 |
API block name |
OutcomesDO.ActivBillable |
Parameters |
- |
See also |
OU04 - Non billable activities
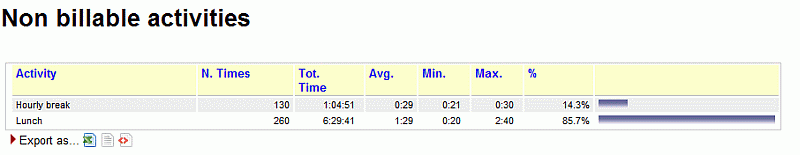
In this report you can find details explaining Non billable activities, with average, minimum and maximum session durations, and a percentage on all activities of the same kind.
Available since |
1.6.0 |
Default page |
Call outcomes |
Shortcut code |
OU04 |
API block name |
OutcomesDO.ActivNotBillable |
Parameters |
- |
See also |
OU05 - Detailed agent report
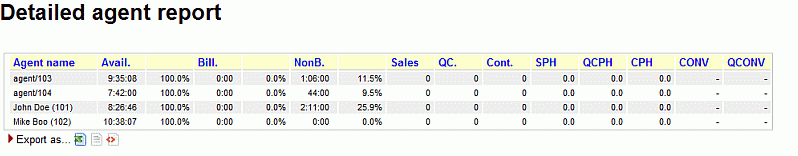
The Detailed Agent Report will show, for each agent:
-
The Available (ACD) time, as an absolute value and a percentage of its total time logged on
-
The Billable time, as an absolute value and a percentage of its total time logged on
-
The Non-Billable time, as an absolute value and a percentage of its total time logged on
-
The number of Sales And Contacts the agent had (if a sale is counted a s both a Sale and a Contact, it’s counted only once as a Sale)
-
The Sales per Hour (SPH) and Contacts per Hour (CPH) ratios for this agent
-
The Conversion ratio, that is the percentage of sales over the total number of sales and contacts.
Available since |
1.6.0 |
Default page |
Call outcomes |
Shortcut code |
OU05 |
API block name |
OutcomesDO.AgentReportDetailed |
Parameters |
- |
See also |
OU06 - Outcomes per agent
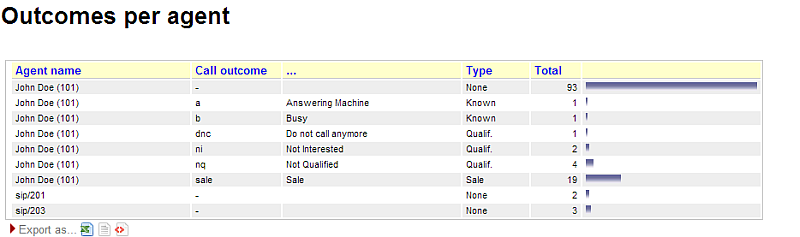
This data block displays all the status codes for each call handled by each agent within the current reporting selection.
If a call has no associated status code, then it is counted under a special status code called "-".
The columns show:
-
The agent name. As an agent might have multiple status codes, the agent name will appear multiple times. If the agent belongs to an agent group, the proper icon is displayed.
-
The call outcome, specified both as a code and a description (if it is present)
-
The type currently associated with the status code
-
The total number of calls for that agent under that status code
All columns are client-sortable.
Available since |
13.04.3 |
Default page |
Call outcomes |
Shortcut code |
OU06 |
API block name |
OutcomesDO.AgentOutcomes |
Parameters |
- |
See also |
OU07 - Call results, by tag
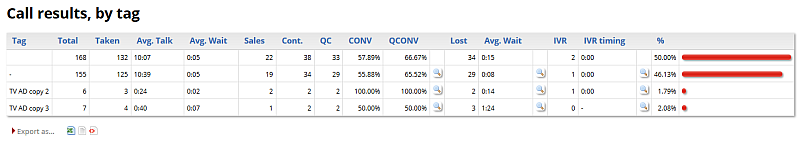
This data block displays calls aggregated by tag code. The first line reports the figures for all aggregated call. The second row, marked with the dash code as tag, counts aggregates for all calls with no tag code assigned.
The columns show:
-
The tag code name
-
Total number of calls aggregated
-
Taken calls
-
Average talk time
-
Average wait time on taken calls
-
Number of calls flagged as sales
-
Number of calls flagged as contact
-
Number of calls flagged as qualified contact
-
Conversion ratio
-
Qualified conversion ratio
-
Number of lost calls
-
Average wait on lost calls
-
Average wait on IVR calls
-
Time spent on IVR
-
Ratio and histogram for total calls the row is reporting, compared with the overall total call in the report
All columns are client-sortable. Clicking on the lens icons present in the report will open a popup with call details (taken, lost and IVR) counted in the aggregation.
Available since |
15.09 |
Default page |
Call outcomes |
Shortcut code |
OU07 |
API block name |
CallTagDO.CallResByTag |
Parameters |
- |
See also |
OU08 - Call results, by feature code
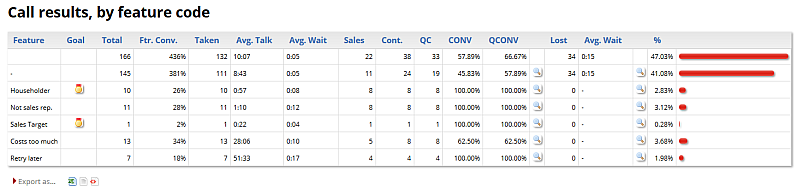
This data block displays calls aggregated by feature code. The first line reports the figures for all aggregated call. The second row, marked with the dash code as feature, counts aggregates for all calls with no feature code assigned.
The columns show:
-
The feature code name
-
Goal/Not goal flag for feature code
-
Total number of calls aggregated
-
Feature conversion factor, counted as ratio between the total calls and the call flagged as contact
-
Taken calls
-
Average talk time
-
Average wait time on taken calls
-
Number of calls flagged as sales
-
Number of calls flagged as contact
-
Number of calls flagged as qualified contact
-
Conversion ratio
-
Qualified conversion ratio
-
Number of lost calls
-
Average wait on lost calls
-
Ratio and histogram for total calls the row is reporting, compared with the overall total call in the report
All columns are client-sortable.
Available since |
15.09 |
Default page |
Call outcomes |
Shortcut code |
OU08 |
API block name |
OutcomesDO.CallResByFeature |
Parameters |
- |
See also |
Historical reports - IVR tracking
The following reports let you track information about IVR calls and goals. A detailed explanation of IVR can be found in: Tracking IVR data
IV01 - IVR Traversals
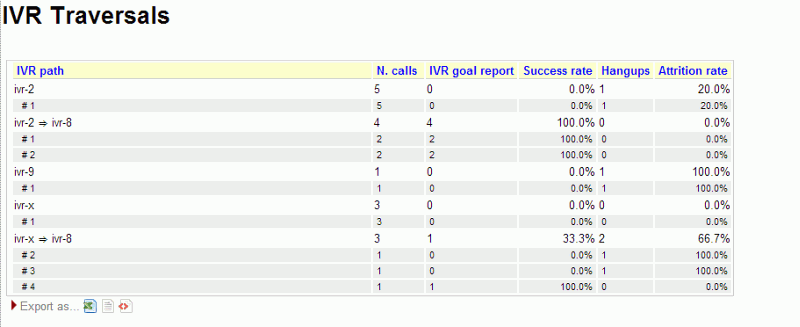
This block shows:
-
The IVR paths examined, in total (as the sum of all choices)
-
For each IVR path, the choices made on that path (prepended by '#')
For each path, the following information is computed:
-
The number of calls traversing that path
-
The number of IVR goals reached immediately after that path (a goal can be a queue or an activity expressly earmarked as a goal)
-
The success rate, as the percentage of goals on all calls that entered the menu
-
The number of hang-ups made in that IVR menu
-
The attrition rate, as the number of hang-ups versus total number of calls
Available since |
13.03 |
Default page |
IVR |
Shortcut code |
IV01 |
API block name |
IvrDO.IvrReport |
Parameters |
- |
See also |
IV02 - IVR Timing
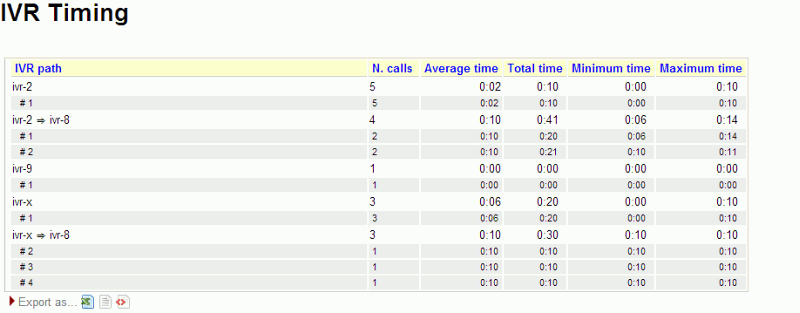
This block shows:
-
The IVR paths examined, in total (as the sum of all choices)
-
For each IVR path, the choices made on that path (prepended by '#')
For each path, the following information is computed:
-
The number of calls traversing that path
-
The average traversal time for that IVR menu
-
The total traversal time (as the sum of all times for each call)
-
The maximum and minimum traversal times
Available since |
13.03 |
Default page |
IVR |
Shortcut code |
IV02 |
API block name |
IvrDO.IvrTiming |
Parameters |
- |
See also |
IV03 - IVR Goals
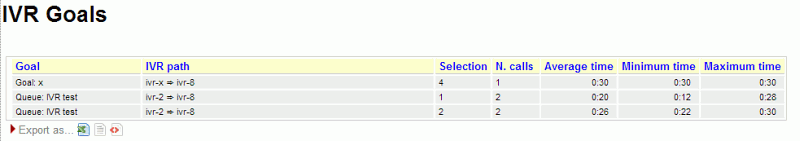
This block shows:
-
For each goal, all the paths that lead to that goal and their selection (the digit that was pressed in order to reach the goal)
-
The number of calls that reached each goal
-
The average, minimum and maximum traversal time to to reach the goal. The time is computed since the call is first tracked, and not only on the final IVR menu.
Available since |
13.03 |
Default page |
IVR |
Shortcut code |
IV03 |
API block name |
IvrDO.IvrGoals |
Parameters |
- |
See also |
Historical reports - First Call Resolution (FCRs)
First Call Resolution lets you track cases that are not resolved in a single call and so the customer ends up calling multiple times in a specified time frame.
Repeated callers and clusters
At the basis of FCR, there is a definition of "repeated call". A call is considered "repeated" if:
-
the caller-id is the same for multiple calls; e.g. if some user calls from a different number, we do not consider this a repeated call.
-
the same caller-id is calling multiple times that are separated by less than a given time period, called "margin".
-
the margin is controlled by a configuration property called 'default.groupingMargin', that can be changed in the system configuration and which default value is 168 hours (7 days).
-
the caller-id is considered the same if after a normalization process (stripping of whitespaces and non-numeric characters) the same caller-ids match
-
the caller-id is skipped (not clustered) if after the normalization it is blank – e.g. caller-ids like "" or "anonymous" will be skipped. Any calls with a blank caller-id will be counted as a single-call, as we do not have further information to cluster it.
-
the normalized caller-id appears at least twice
For example, given the following set of calls and a marging of one week
The data blocks are computed in three different flavors:
-
Taken calls
-
Lost calls
-
All calls
FC01/2/3 - Break-down of recalls
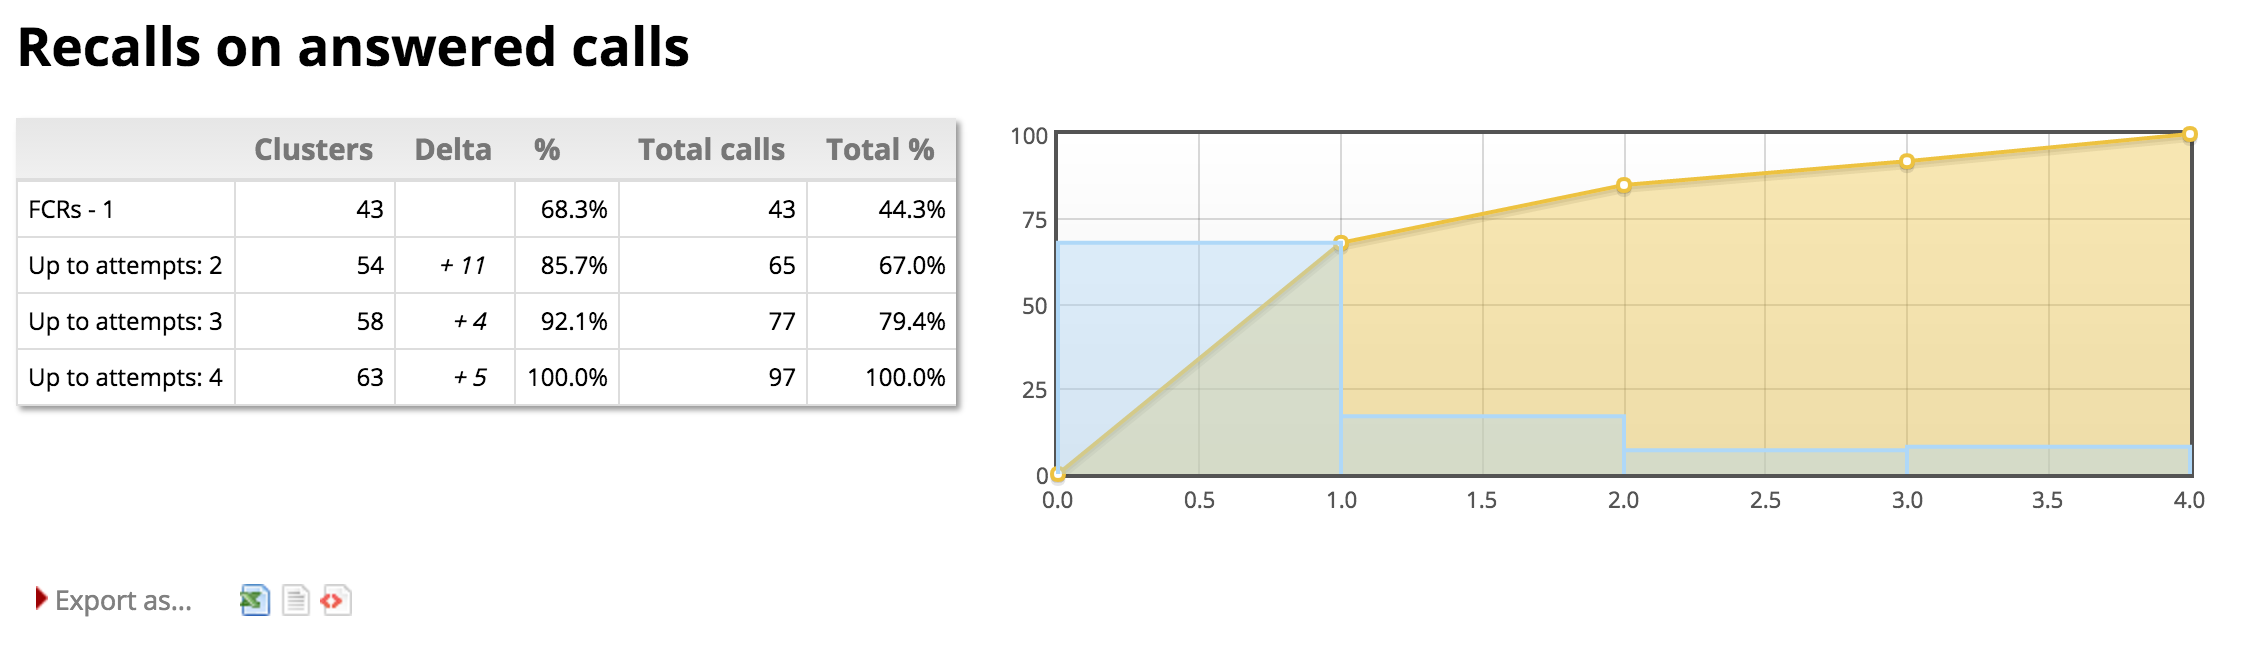
This report aims at letting you know how many calls were clustered.
This report is built to have a “shape” that is familiar for users used to SLAs, and is completed by a similar graph.
In detail:
-
FCRs are calls that appear only once; while the other "classes" will be calls "up to" so many attempts
-
"Up-to" lines will be present up to the maximum present in the report; considering all integers from 2 to the maximum included
-
Clusters is the number of clusters that are "up to", so clusters that belong to the current class plus all previous ones
-
Delta is the number of clusters that belong to the current class
-
Percentage is the number of calls of the current class
-
Total is the growing percentage of sorted classes, and always ends at 100%
-
Total Calls is the number of calls that are "up to", so belong to the current class plus all previous ones
Available since |
15.10.11 |
Default page |
FCRs |
Shortcut code |
FC01 |
API block name |
FcrDO.RecallsOk |
Parameters |
- |
See also |
Taken calls |
Available since |
15.10.11 |
Default page |
FCRs |
Shortcut code |
FC02 |
API block name |
FcrDO.RecallsKo |
Parameters |
- |
See also |
Lost calls |
Available since |
15.10.11 |
Default page |
FCRs |
Shortcut code |
FC03 |
API block name |
FcrDO.RecallsAll |
Parameters |
- |
See also |
All calls |
FC04/5/6 - Recall details
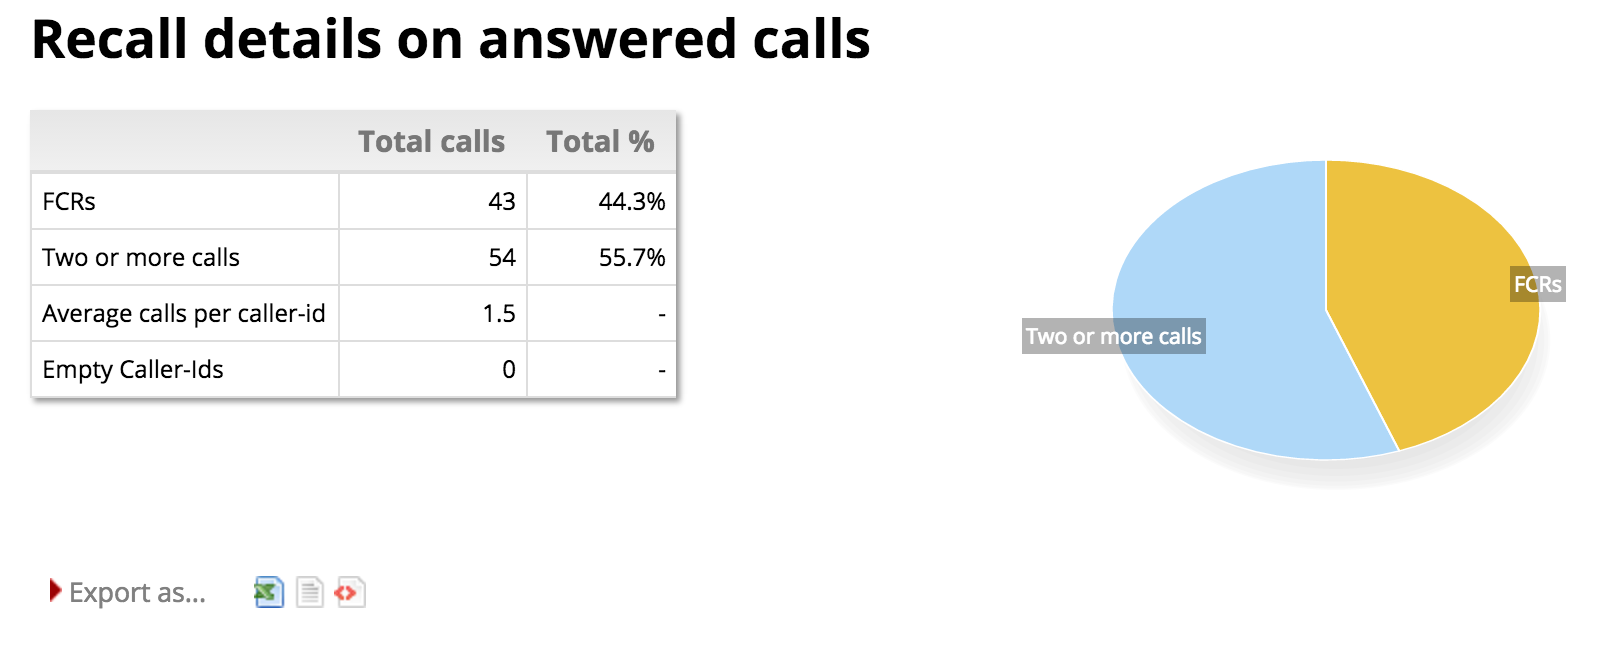
This report shows the total number of FCRs, clusters and calls with an empty IDs.
It has a pie chart showing FCRs vs clusters.
Available since |
15.10.11 |
Default page |
FCRs |
Shortcut code |
FC04 |
API block name |
FcrDO.ClidsOk |
Parameters |
- |
See also |
Taken calls |
Available since |
15.10.11 |
Default page |
FCRs |
Shortcut code |
FC05 |
API block name |
FcrDO.ClidsKo |
Parameters |
- |
See also |
Lost calls |
Available since |
15.10.11 |
Default page |
FCRs |
Shortcut code |
FC06 |
API block name |
FcrDO.ClidsAll |
Parameters |
- |
See also |
All calls |
FC07/8/9 - Cluster details
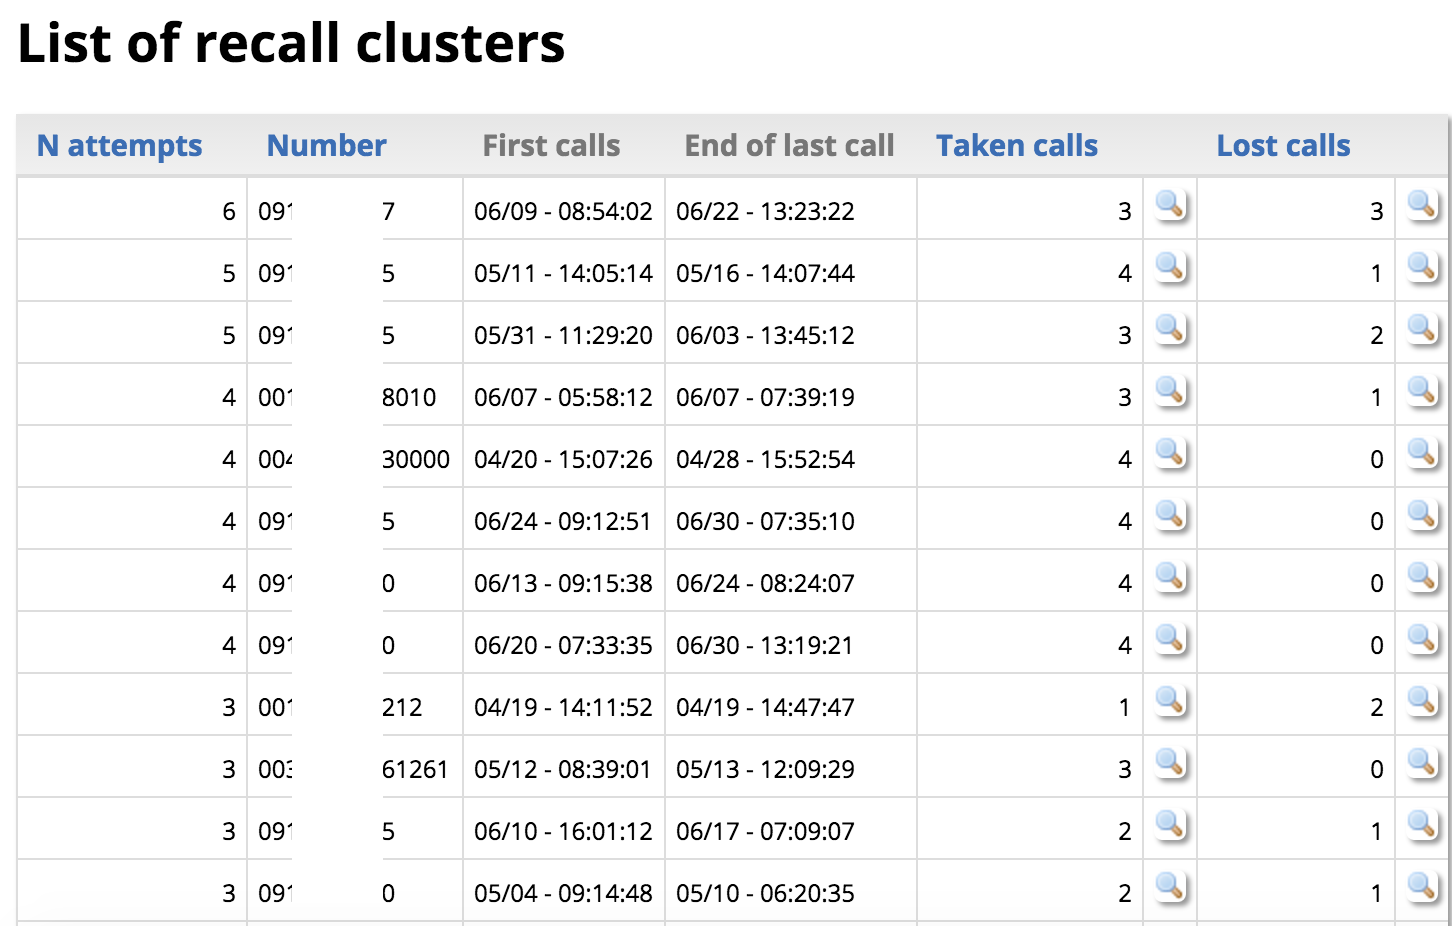
This block is a list of all clusters, sorted by the number of attempts and showing the cluster’s first and last call. Only clustered calls are included.
For all clusters including "taken" calls, the "Taken" column appears showing how many of those calls were counted and offering a link to a pop-up from which you can access the calls. The same goes for "Lost" calls. If both are counted, both columns are present.
Notes:
-
When clicking on the icon to see calls, you will see all calls with the same caller-id belonging to the current report, whether they belong to the current cluster or not; so that you can have a general overview of all recalls in the current report
Available since |
15.10.11 |
Default page |
FCRs |
Shortcut code |
FC07 |
API block name |
FcrDO.ClustersOk |
Parameters |
- |
See also |
Taken calls |
Available since |
15.10.11 |
Default page |
FCRs |
Shortcut code |
FC08 |
API block name |
FcrDO.ClustersKo |
Parameters |
- |
See also |
Lost calls |
Available since |
15.10.11 |
Default page |
FCRs |
Shortcut code |
FC09 |
API block name |
FcrDO.ClustersAll |
Parameters |
- |
See also |
All calls |
FC10 - Retry Rate and Lost Caller Behaviour
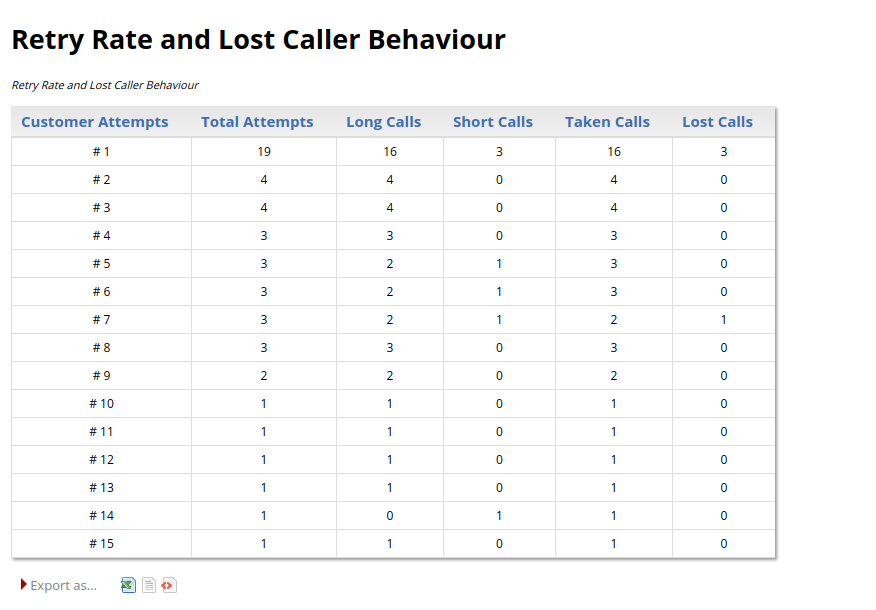
This report shows information about customers retry behaviour. We can see how many calls are registered as being the n-th attempt, based on the Customer Attempt number in the first column. The information is the following:
-
Customer Attempts
-
Total Attempts
-
Long Calls
-
Short Calls
-
Taken Calls
-
Lost Calls
Notes:
-
the number of seconds needed for a call to be classified as long is dictated by the following configuration property: default.shortcall_treshold = 30 . If the property is not specified, it will deafault at 30.
Available since |
17.06.16 |
Default page |
FCRs |
Shortcut code |
FC10 |
API block name |
FcrDO.RetryRate |
Parameters |
- |
See also |
NA |
FC11 - Most Frequent Called-Calling Number
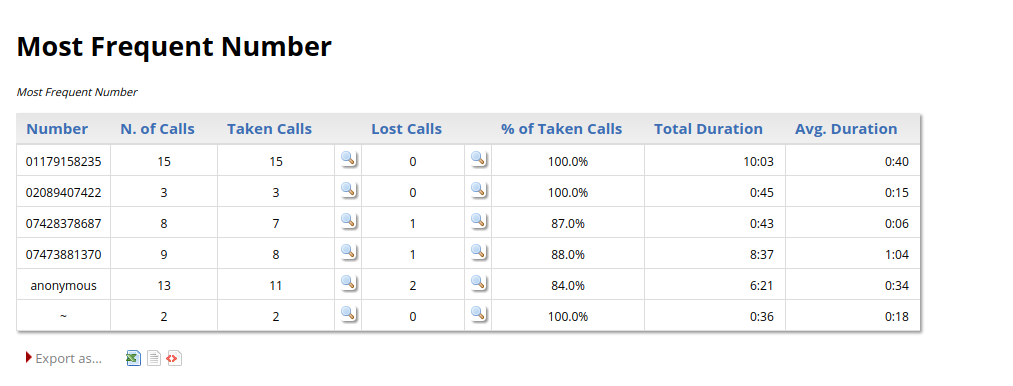
This report shows aggregated data by caller/called number. We can deduce by looking at this report, the most frequent callers and the duration of their calls. A special icon is also present to inspect the signular calls that make up the aggregated data.
The information is the following:
-
Number
-
N. of Calls
-
Taken Calls
-
Lost Calls
-
% of Taken Calls
-
Total Duration
-
Avg. Duration
Notes:
-
Calls that show "anonymous" as caller number are calls which have an empty or undeterminable caller id. these calls are all evaluated together. Similarly, calls that show "~" as caller id, are calls coming from caller numbers that have only called once, we can refer to them as FCR (First Call Resolution).
Available since |
17.06.16 |
Default page |
FCRs |
Shortcut code |
FC11 |
API block name |
FcrDO.MostFrequentNumber |
Parameters |
- |
See also |
NA |
Historical reports - Cases and Clients
CA01 - Case Distribution
This block show all cases referenced within the current report.
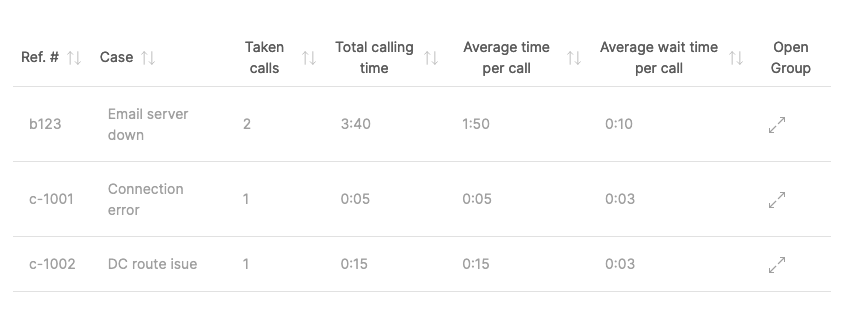
For each case, we show:
-
The case’s external reference and name
-
How many calls reference this case
-
The total handling time
-
The average wait and talk time for those calls
-
A detail of all calls (within the current report) that belong to this case
Available since |
23.08 |
Default page |
Cases |
Shortcut code |
CA01 |
API block name |
CaseDO.CaseDistribution |
Parameters |
- |
See also |
CA02 |
CA02 - Client Distribution
This block show all clients referenced within the current report.
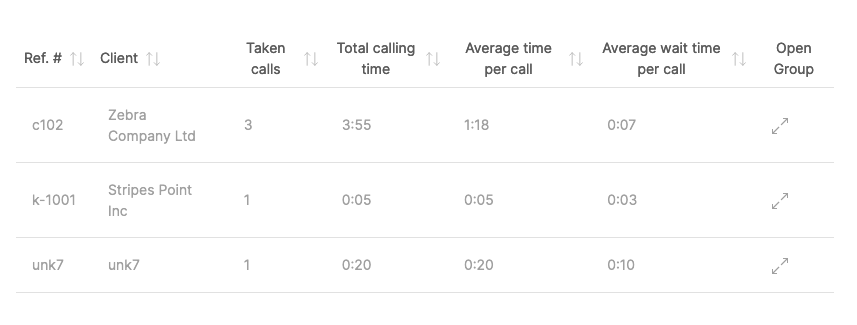
For each client, we show:
-
The client’s external reference and name
-
How many calls reference this client
-
The total handling time
-
The average wait and talk time for those calls
-
A detail of all calls (within the current report) that belong to this client
| As explained in Configuring cases, a case may belong to a different client than its own, if set so by an agent. |
Available since |
23.08 |
Default page |
Cases |
Shortcut code |
CA02 |
API block name |
CaseDO.ClientDistribution |
Parameters |
- |
See also |
CA01 |
Externally generated reports
QueueMetrics is able to fetch and display data blocks generated by external systems. This may be used to enhance the standard QueueMetrics reports with data that is handled outside of QueueMetrics - for example, data from a CRM application or order tracking systems or anything else that makes sense to display together with queue data.
In order to use these blocks, you need to create external data providers that will generate the data that QueueMetrics is to display. Details on how to do this can be found in the 'XML-RPC Manual' in the section called 'Dynamic blocks in QueueMetrics'.
XS01 - Plain HTML
This data block includes a block of HTML right into the QueueMetrics report page.
For example, in order to include an HTML fragment generated by a server located at http://server/page.php you would set:
url=http://server/page.php
in the data block’s parameter field.
Available since |
13.12 - Removed in 20.11 |
Default page |
None |
Shortcut code |
XS01 |
API block name |
ExtSourceDO.HTML |
Parameters |
'url': The URL that points to the page generating HTML |
See also |
XS02 - XML-RPC data source
This data block includes a formatted table of data into the QueueMetrics report page. The data must be generated in a specified format by an XML-RPC server, as described on the 'XML-RPC Manual'.
Available since |
13.12 |
Default page |
None |
Shortcut code |
XS02 |
API block name |
ExtSourceDO.XMLRPC |
Parameters |
'url': The URL that points to the XML-RPC server |
See also |
XS01 |
XS03 - JSON data source
This data block includes a formatted table of data into the QueueMetrics report page. The data must be generated in a given format by a JSON server, as described on the 'XML-RPC Manual'.
Available since |
13.12 |
Default page |
None |
Shortcut code |
XS03 |
API block name |
ExtSourceDO.JSON |
Parameters |
'url': The URL that points to the page generating a JSON document |
See also |
XS01 |
You can find some easy-to-use examples at https://github.com/Loway/OpenQueueMetricsAddOns/tree/master/xs03_json_example.
|
User-Programmable Reports
'User Programmable Reports' are meant to be completely customized by the end-user. As such, they usually include a fixed set of columns that will be displayed, plus a set of facilities for creating new columns.
Those columns are defined through the "Parameters" field of the data block, where new columns are to be configured. For example, in order to add a column that displays the time an agent was available, you could enter a definition like:
Tot Avail [hms]= SESSION - (PAUSETIME + (TALKTIME + OOSCALL))
This definition is made up of three parts:
-
A 'column name': how the column’s title will appear in the reports;
-
A 'formatter': how the resulting value is to be displayed. Formatting is expressed as a token between square brackets just before the equal sign;
-
A 'formula': how the value is to be computed.
The 'column name' is a free string; you may put anything you want in it.
The 'formatter' must be one of the following values:
-
'hms' - a number of seconds displayed as "[hours:]minutes:seconds"
-
'%' - prints a float number into a percentage, es .365 is displayed as 36.5%
-
'n' – prints an integer, right-aligned
-
'f' – prints a float number
If no formatter is specified, the 'percent' formatter is used. All numbers are printed according to the current rules set by your current language and locale (e.g. number of decimal digits, decimal separators, etc.)
The 'formula' lets you insert an algebraic formula. This formula works on a set of bound variables (as specified below) that the block will replace with the correct values for each row.
-
The following operators are supported, with natural precedence rules:
-
Addition: 2 + 2
-
Subtraction: 2 - 2
-
Multiplication: 2 * 2
-
Division: 2 / 2
-
Exponentation: 2 ^ 2
-
Unary Minus and Plus: +2 - (-2)
-
Modulo: 2 % 2
-
Rounded brackets are supported to force the order of evaluation. Use them freely.
-
-
The following functions are supported:
-
abs: absolute value
-
acos: arc cosine
-
asin: arc sine
-
atan: arc tangent
-
cbrt: cubic root
-
ceil: nearest upper integer
-
cos: cosine
-
cosh: hyperbolic cosine
-
exp: exponent (e^x)
-
floor: nearest lower integer
-
log: logarithmus naturalis (base e)
-
log10: logarithm (base 10)
-
log2: logarithm (base 2)
-
sin: sine
-
sinh: hyperbolic sine
-
sqrt: square root
-
tan: tangent
-
tanh: hyperbolic tangent
-
-
Specific data blocks may implement custom functions. Those are prefixed by the dollar sign and depend on the agent block.
-
Any error in the formula (e.g. division by zero, incorrect formula, missing parentheses, referencing an unbound variable) will cause the formula to return zero. An error will be printed on the system log.
You can have multiple columns defined; it is also valid to have empty lines in the parameters block and comments, prefixed by "#".
| When creating new formulas, it is often useful to print all referenced items by themselves, so you can double-check them, and comment them out when you don’t need them anymore. |
Variables bound for Agent blocks
The following variables are automatically bound and therefore usable in formulas:
-
TALKTIME: The total conversation time
-
SESSION: The total session time
-
OVERLAPPING: The total overlapping conversation time
-
OOSCALL: Out-of-session call time
-
PAUSETIME: The total pause time
-
PAUSEBILL: The total time of billable pauses
-
PAUSENBILL: The total time of non-billable pauses
-
PAUSEPAY: The total time of payable pauses
-
PAUSENPAY: The total time of non-payable pauses
-
NCALLS: The total number of calls for this agent
-
NCALLSIN: The total number of inbound calls for this agent
-
NCALLSOUT: The total number of outbound calls for this agent
The following custom functions are implemented:
-
$PAUSETIME[X]: returns the total duration of all pauses with the pause code "X" for the current agent
All times are expressed in seconds.
JSON and XML-RPC access
As Programmable blocks often do not include much interesting information by themselves, when referenced though their own block code will only return fixed columns.
It is still possible to access them as they are configured in a report by referencing their direct code; this will be displayed by the Reports editor as soon as you enter parameters for an existing data block. The format will usually be "DRI.num", where 'num' depends on your QueueMetrics install (different QueueMetrics systems will report different DRI codes for a block defined in the same way).
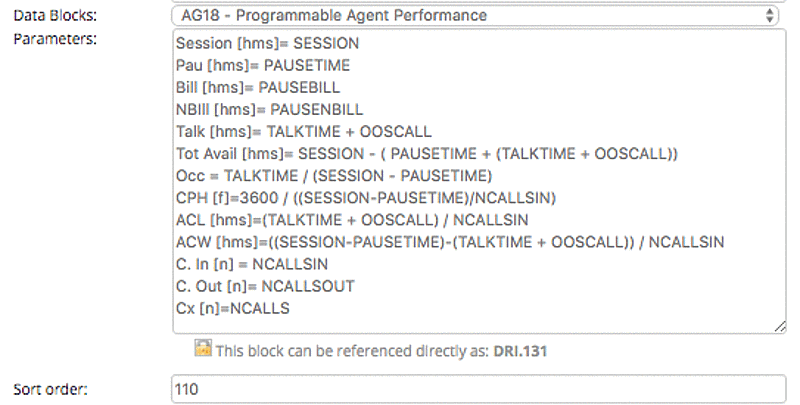
| As accessing a data block that is a part of a report requires the accesing used to have the correct grants to access the report, screen and block, these security rules will be also enforced on "robot" users doing data queries. Make sure that, if you key-protect reports or elements in them, the "robot" user has all needed grants. |