Understanding results
Understanding results: Answered calls
The answered calls section deals with calls that were correctly handled by agents.
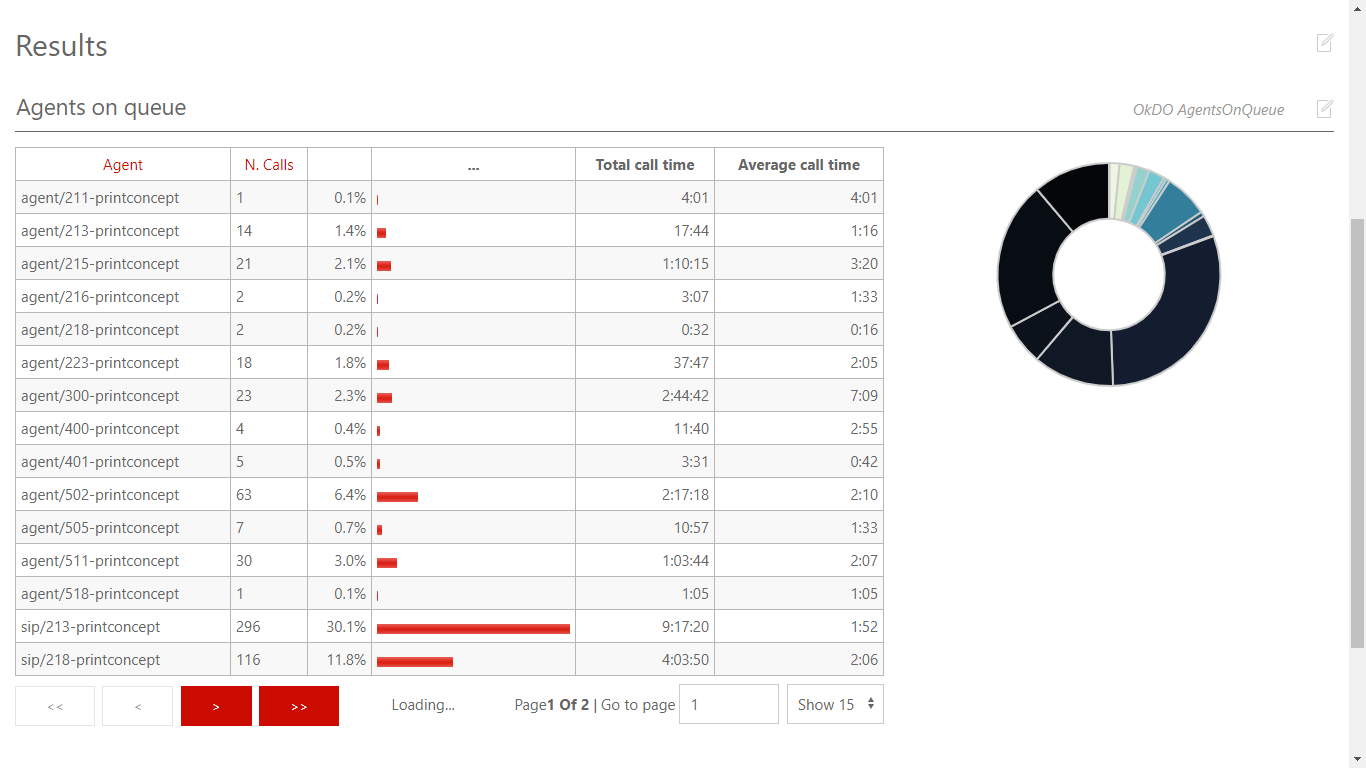
Agents on queue
This report shows which agents have been available for the given queue, how many calls each one handled and the percentage of all calls that each one handled.
If calls are connected directly to a phone terminal, QM tries its best to show the corresponding terminal, usually in the format used by Asterisk, like "SIP/303" to signify a SIP phone whose number is 303.
If you connect to H.323 telephones via the OH323 module, the recorded channel names have no meaning and do not refer to a specific terminal; that’s why all OH323 calls are grouped together under the label "OH323/-".
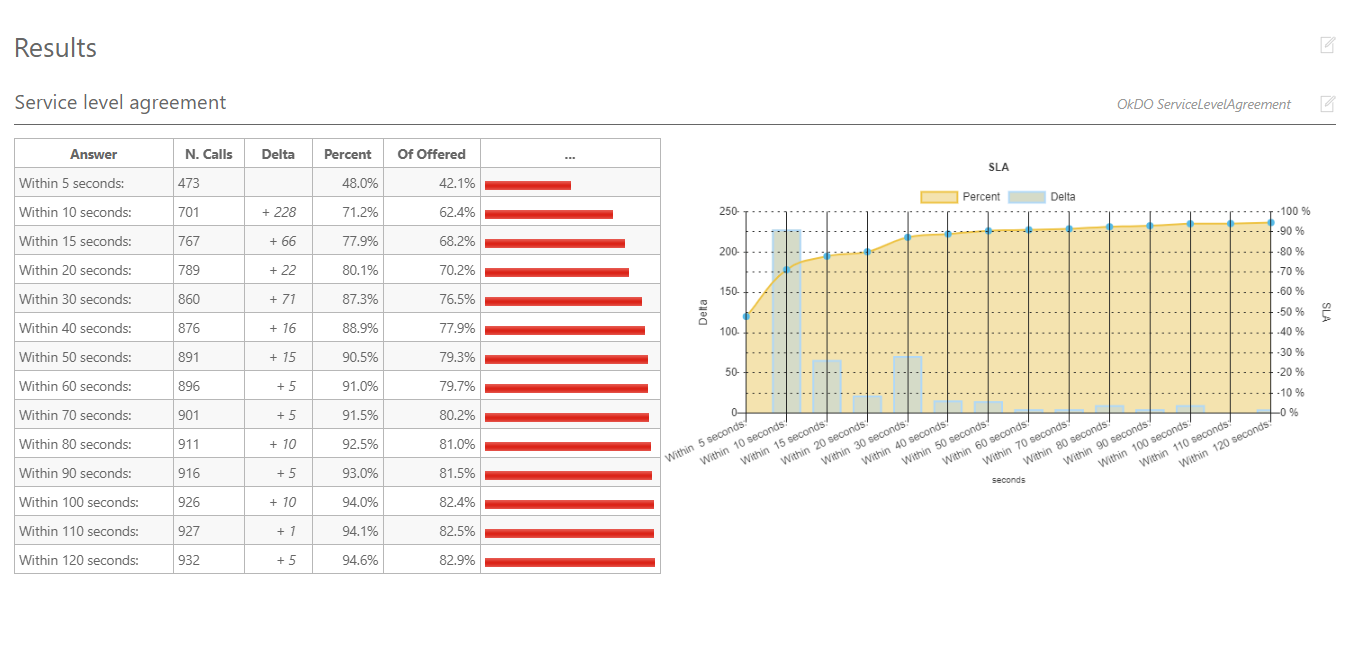
Service level agreement
This report shows the distribution of call waiting times. It shows how many calls were answered within a given time frame, usually 120 seconds in 10 second increments (the time frame and increment can be modified by the administrator, if needed - see Configuring system preferences ).
It is also possible to have two time frames in order to have a higher granularity for shorter time periods - e.g. having SLA computed in intervals of 5 seconds up to 20 seconds, and in intervals of 10 seconds up to 120 seconds.
You get a percentage of how many calls were answered within X seconds; the percentage includes calls answered in a shorter time frame and therefore grows with time.
The "delta" value you see is the absolute increment, expressed in number of calls, between each time frame.
This metric is computed only on answered calls, i.e. ignoring lost calls . If your SLA is defined in terms of taken and lost calls, see the corresponding metrics "Inclusive SLA" on Inclusive Service Level Agreement.
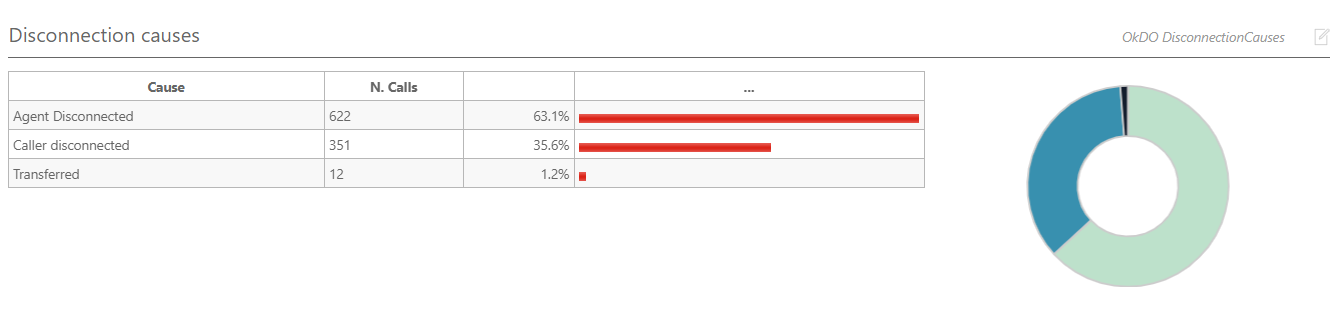
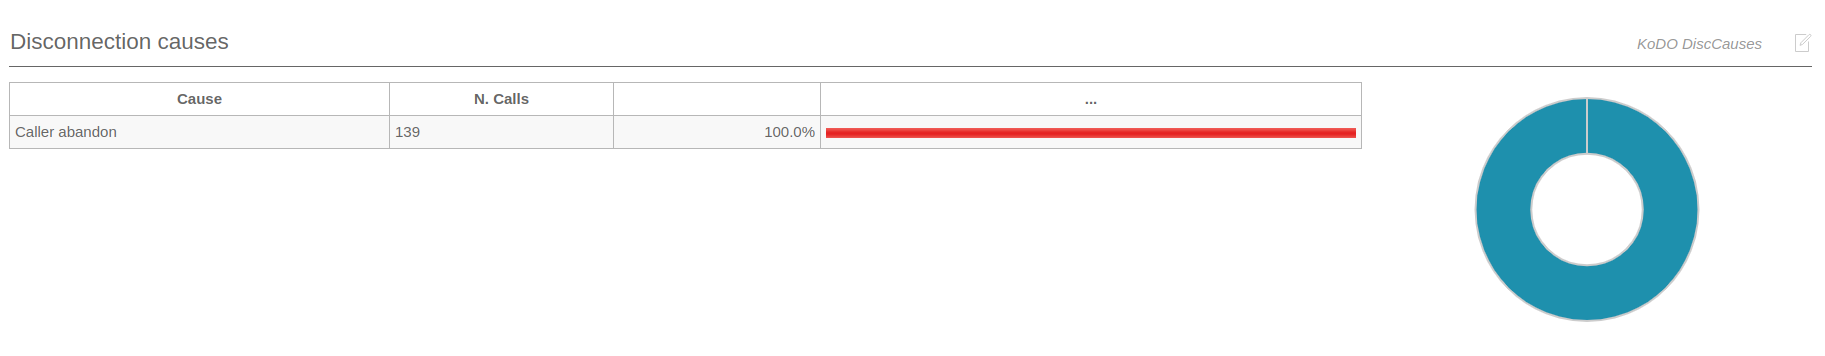
Disconnection causes
This report shows the reason why calls were terminated; this means that:
-
The agent hung up, or
-
The caller hung up, or
-
The call was transferred outside the queue and the agent was freed again, or
-
The call was ongoing at the time the report was run.
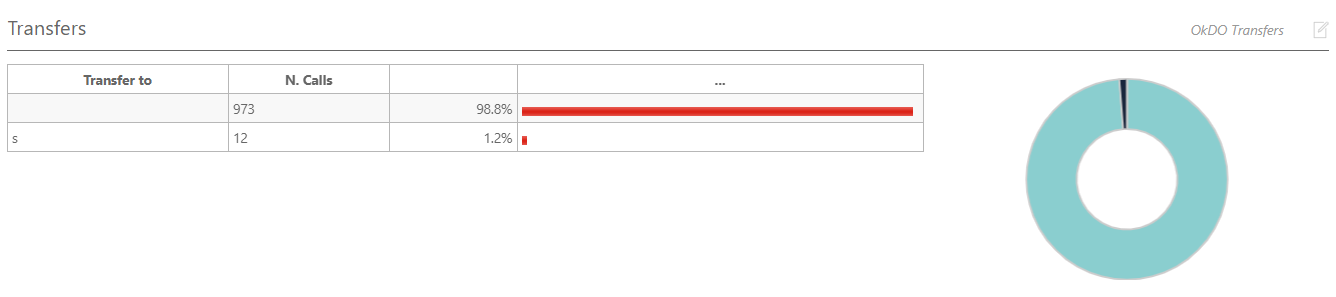
Transfers
This graph shows how many calls were transferred to each extension in the given time frame. This lets you know who is handling exception calls.
| when a call is transferred outside the queue system, its length is no more recorded by the queue subsystem; therefore you only get to see the length of the call while the agent was on line. |
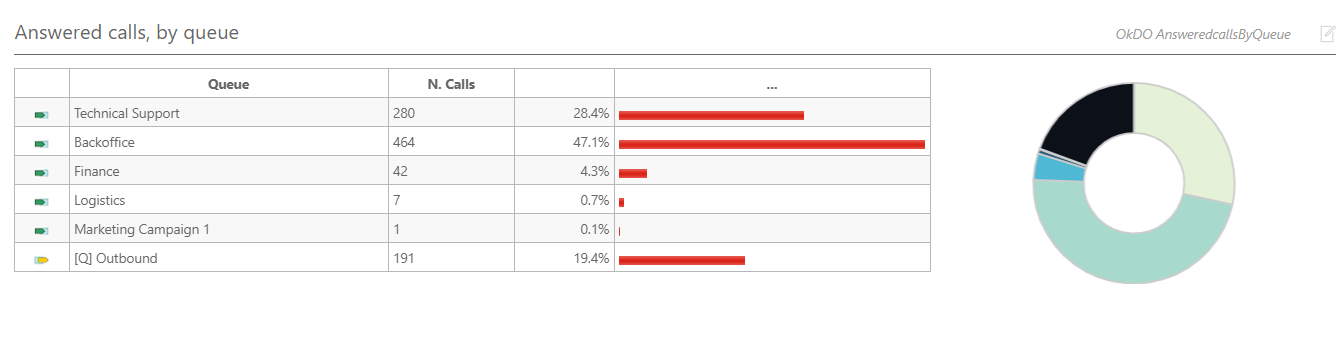
Answered calls by queue
If more than one queue is in use for the report, this graph shows the relative magnitude of each queue.
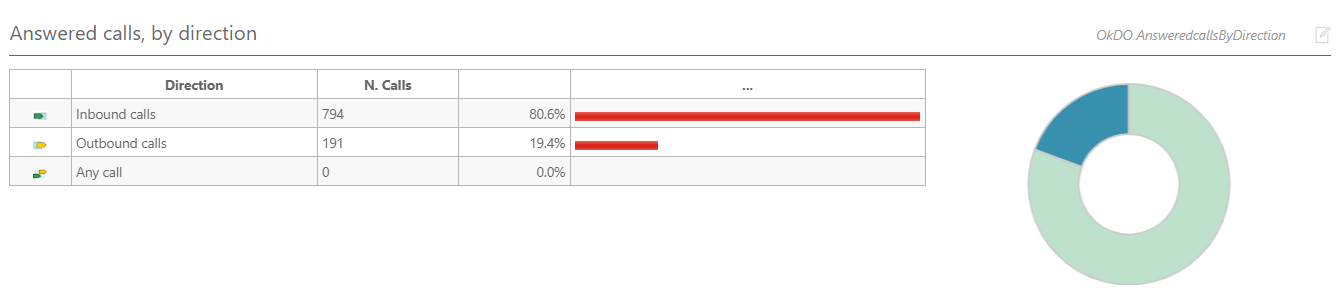
Answered calls by direction
If more than one queue is in use for the report, this graph shows the relative magnitude of inbound versus outbound calls made.
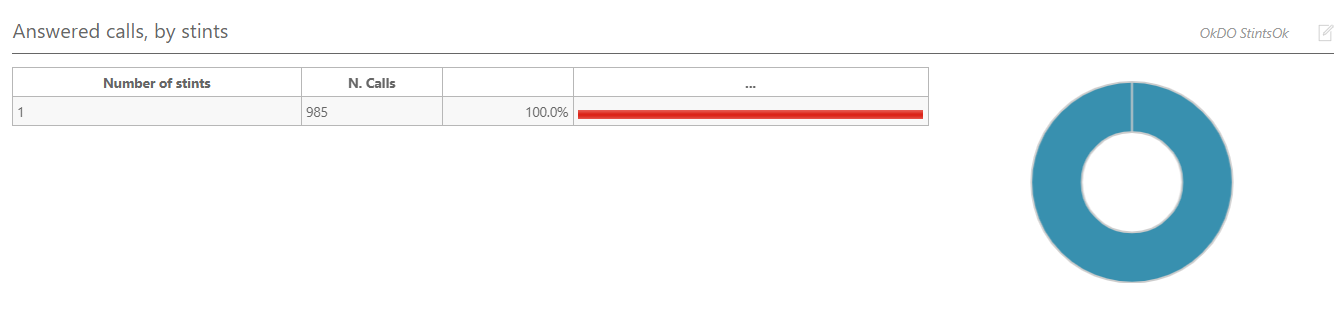
Answered calls, by stints
This graph counts the distribution of multi-stint calls on selected queues. If multi-stint mode is not enable, all calls will have only one stint.
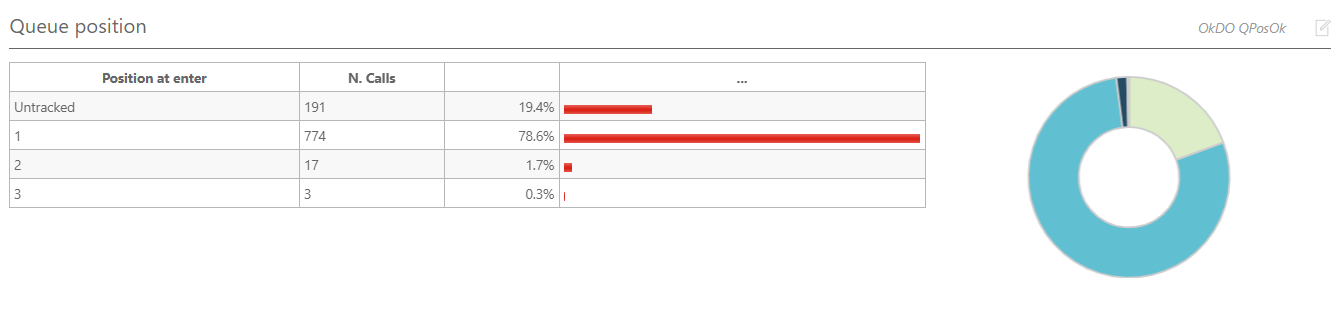
Queue position
This graph shows the initial queue position that the calls had when they joined the queue. For example, a queue position of 1 means that a call was first in line, of 5 means that a call had four other calls in line before being answered. As the logging of queue positions is a bit inconsistent, some calls might be missing it ("Untracked")
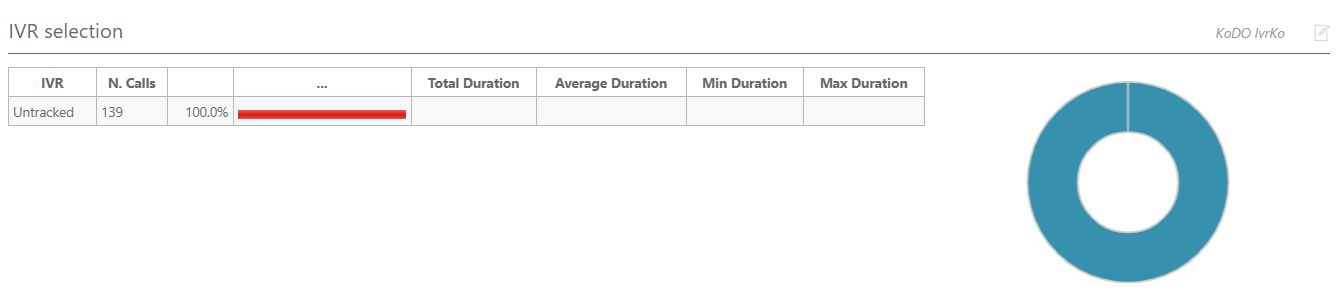
IVR selection
This graph shows the distribution of IVR selections available in the calls processed.
This must be tracked manually in Asterisk - See "Configuring Asterisk for QueueMetrics" below.
Understanding results: Unanswered calls
Unanswered calls are calls that were lost, i.e. the caller could not connect to an agent. This usually means that either the caller hung up, fed up with waiting, or the queue system decided to discharge the caller, maybe sending him to voicemail or another queue.
| if you run a report with an agent filter, or a supervisor filter, or a location filter, the number of lost calls in the report is usually zero, showing just outgoing calls, if any. This is because the agent is specified only for taken calls and not lost ones, so not deleting them all would show, e.g., the taken call data for one single agent and the lost calls for all of the queue. |
Disconnection causes
This report shows the relative magnitude of disconnection causes, that are:
-
The caller hung up, or
-
The queue timed out and discharged the caller (if this feature is enabled by the queue configuration - see Configuring Asterisk for QueueMetrics), or
-
The caller exited the queue by pressing a key (if this feature is enabled by the queue configuration).
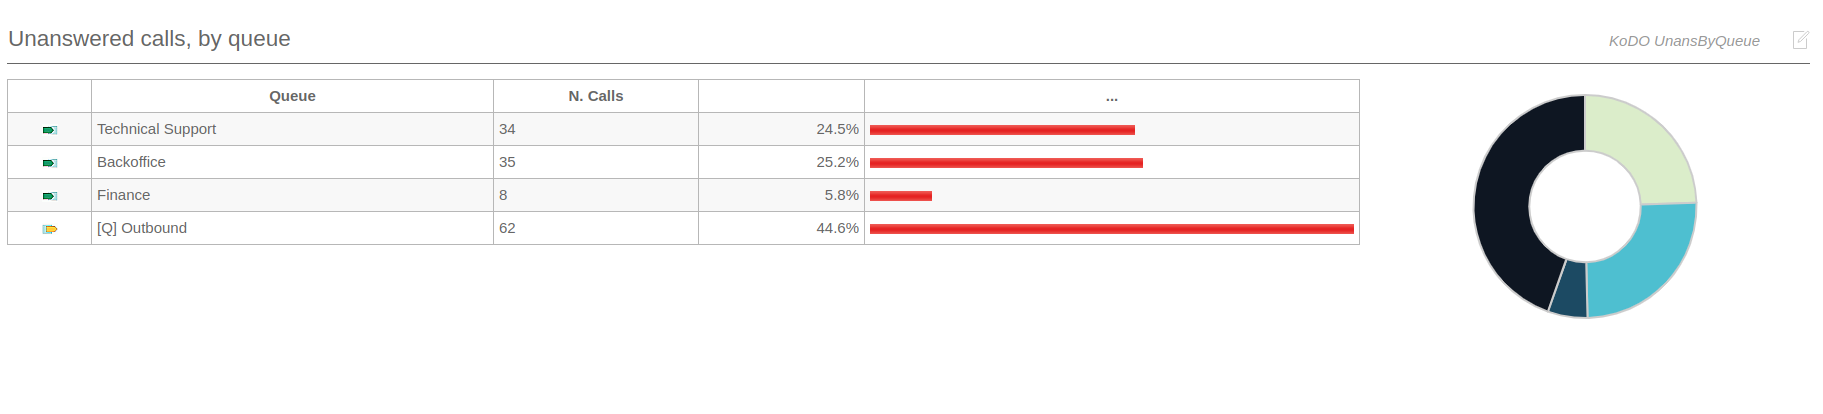
Unanswered calls, by queue
If more than one queue is in use for the report, this graph shows the relative magnitude of each queue.
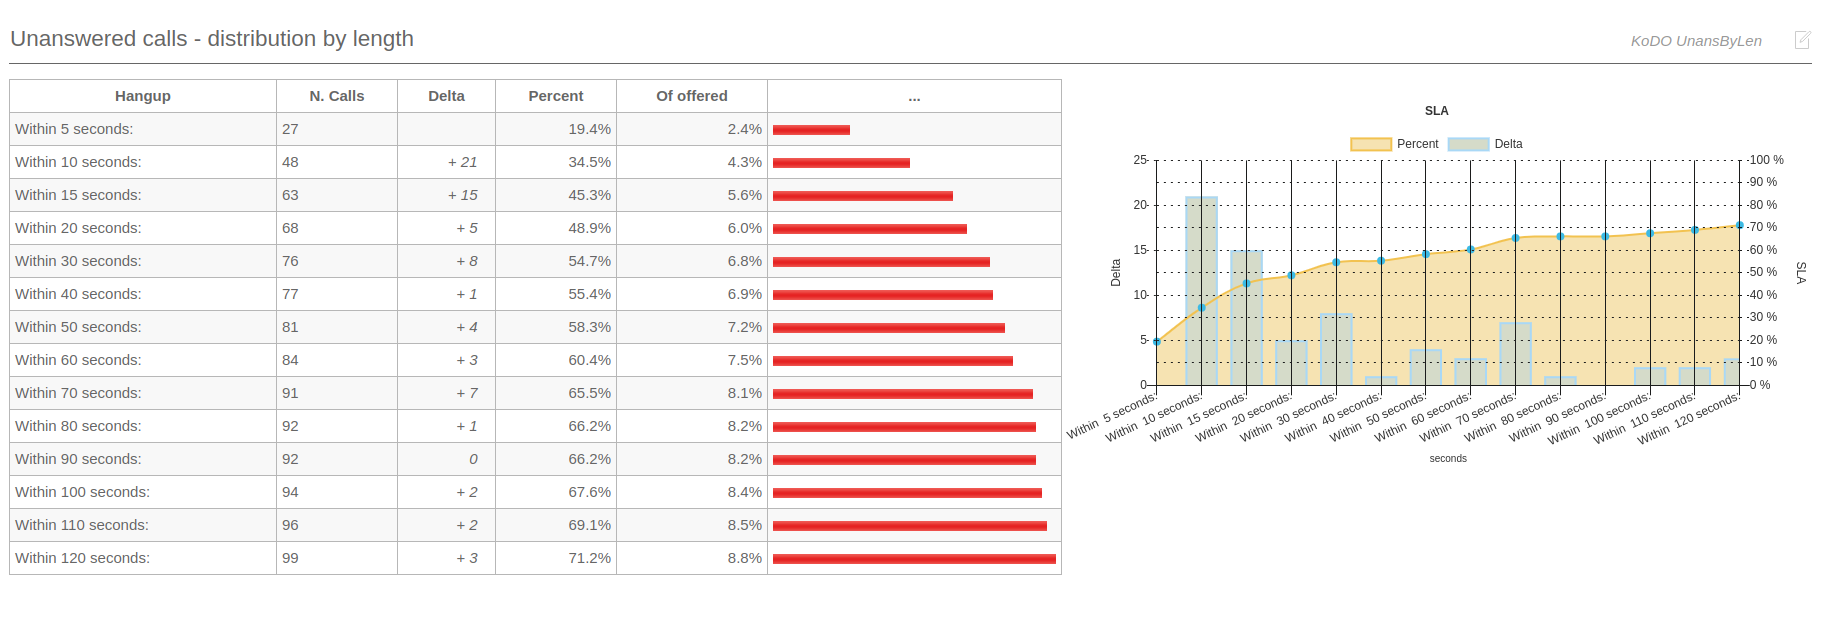
Unanswered calls - distribution by length
This report is functionally equivalent to "Service level agreement" in the Answered calls section (see Service level agreement), but is computed on lost calls. It shows how many calls were hung up within a given time frame, usually 120 seconds in 10 second increments (the time frame and increment can be modified by the administrator, if needed - see Configuring system preferences).
You get a percentage of how many calls were lost within X seconds; the percentage includes calls lost in a shorter time frame and therefore grows with time.
The "delta" value you see is the absolute increment, expressed in number of calls, between each time frame.
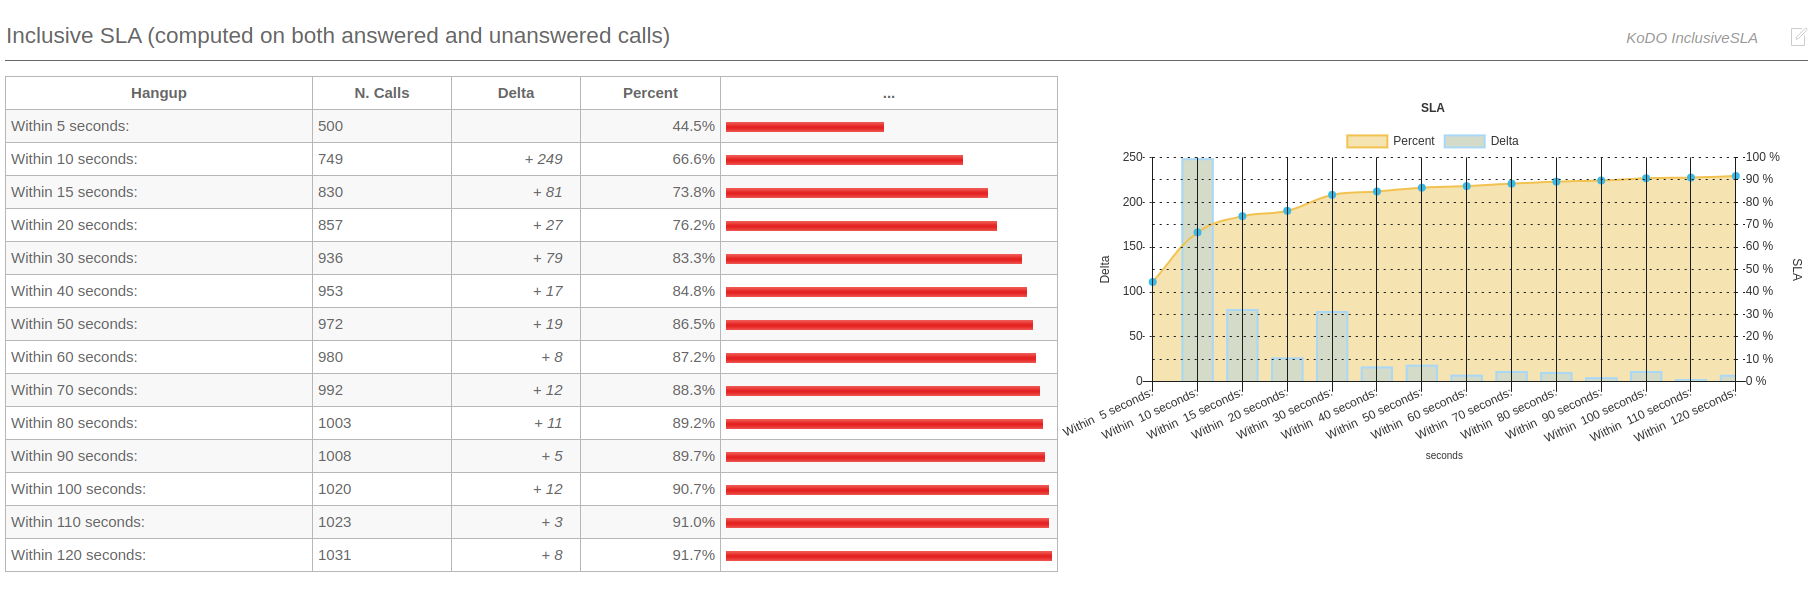
Inclusive Service Level Agreement
The inclusive SLA corresponds to the Service Level Agreement metrics shown on Service level agreement, with the difference that it is computed taking into consideration both answered and unanswered calls.
Unanswered calls by key press
If there are any calls that are were set unanswered because the caller pressed a key to exit the queue, this graph shows which keys were pressed and how many calls were terminated for that reason.
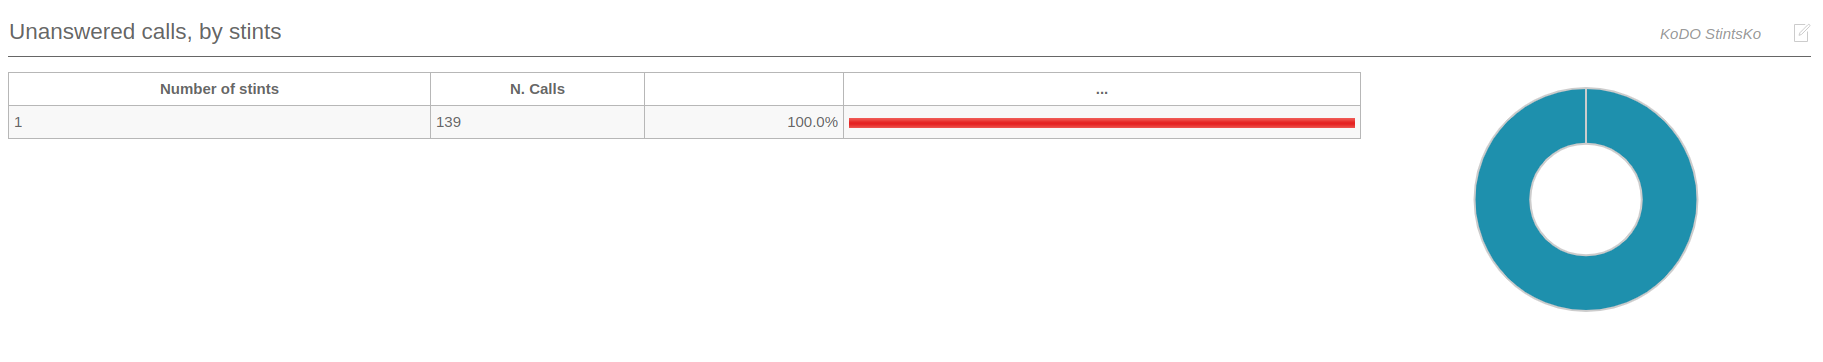
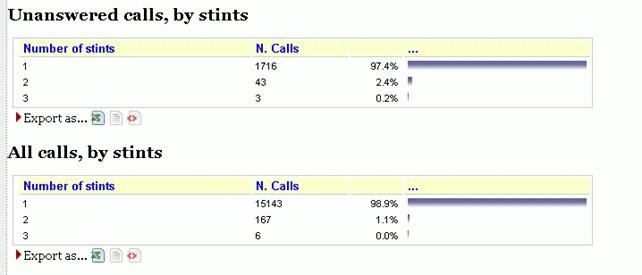
Unanswered calls, by stints
This graph tells the stint distribution of unanswered calls. It corresponds to the graph called "Answered calls, by stints".
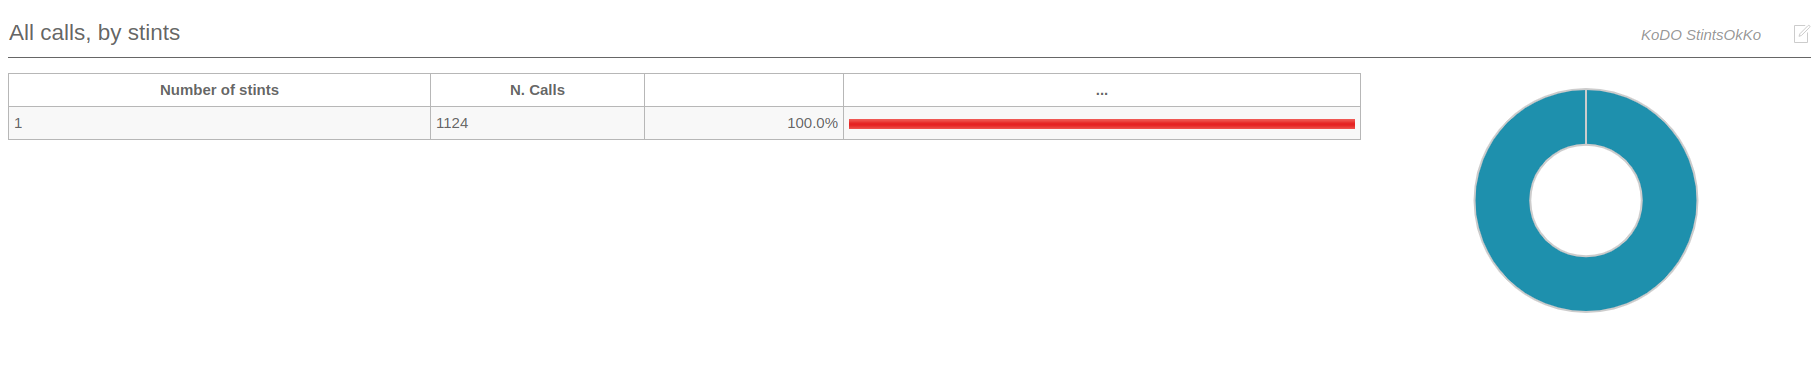
All calls, by stints
This graph tells the stint distribution of all processed calls. It corresponds to the sum of the graphs called "Answered calls, by stints" and "Unanswered calls, by stints"
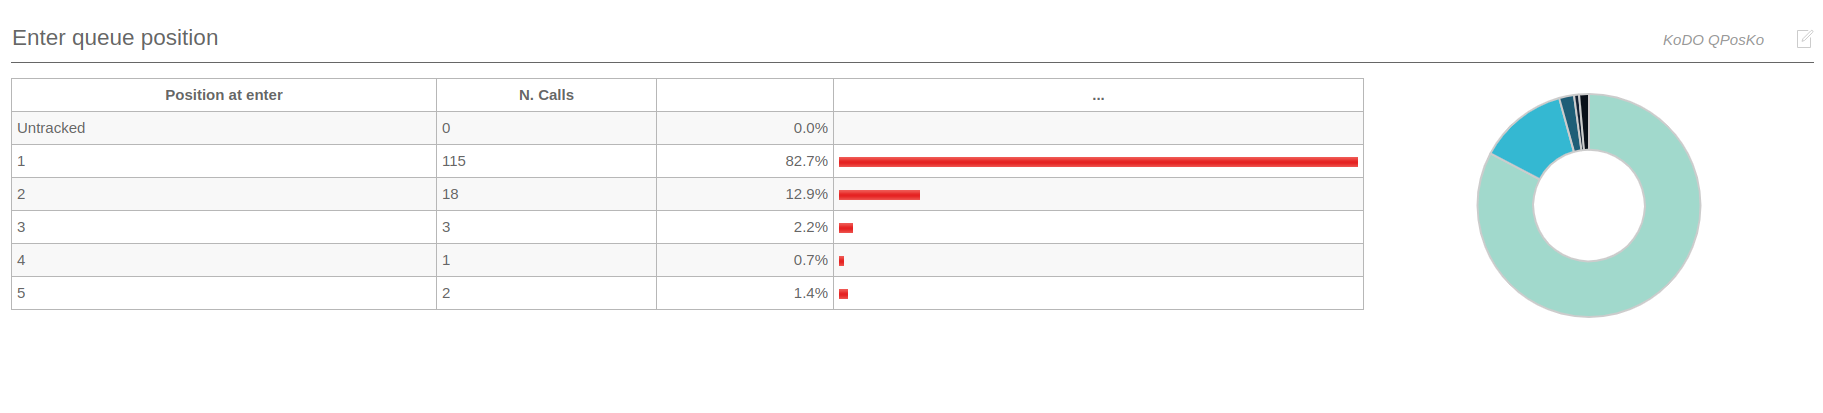
Enter queue positions
This graph shows the initial queue position that the calls had when they joined the queue. For example, a queue position of 1 means that a call was first in line, of 5 means that a call had four other calls in line before being answered. As the logging of queue positions is a bit inconsistent, some calls might be missing it ("Untracked")
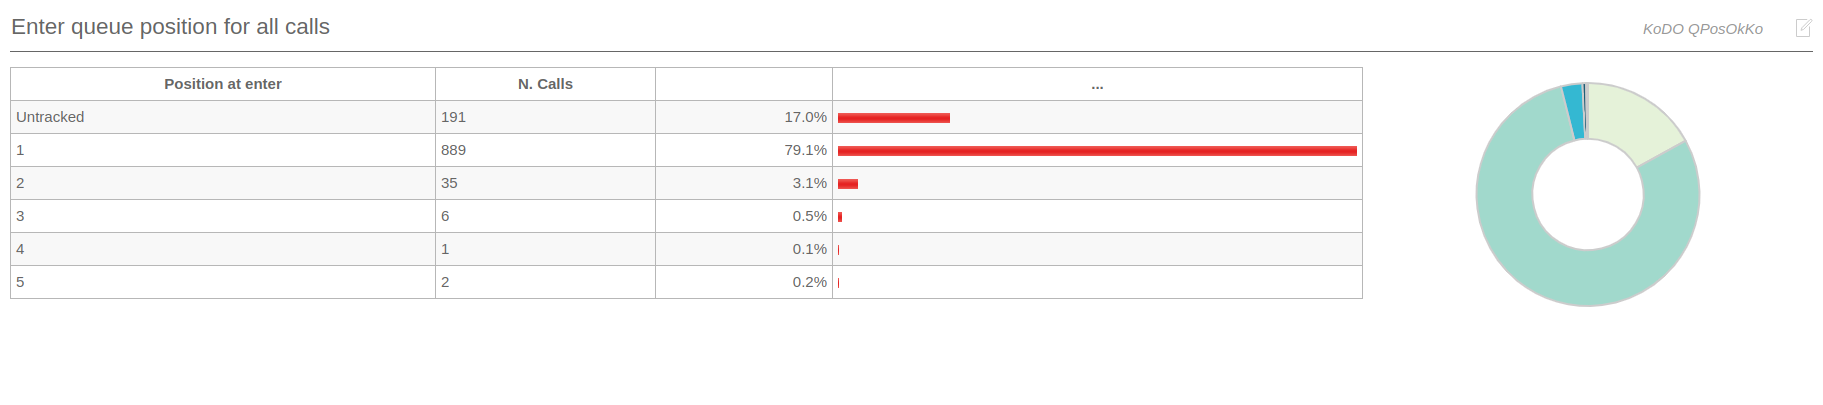
Enter queue positions for all calls
This graph shows the initial queue positions for both answered and unanswered calls.
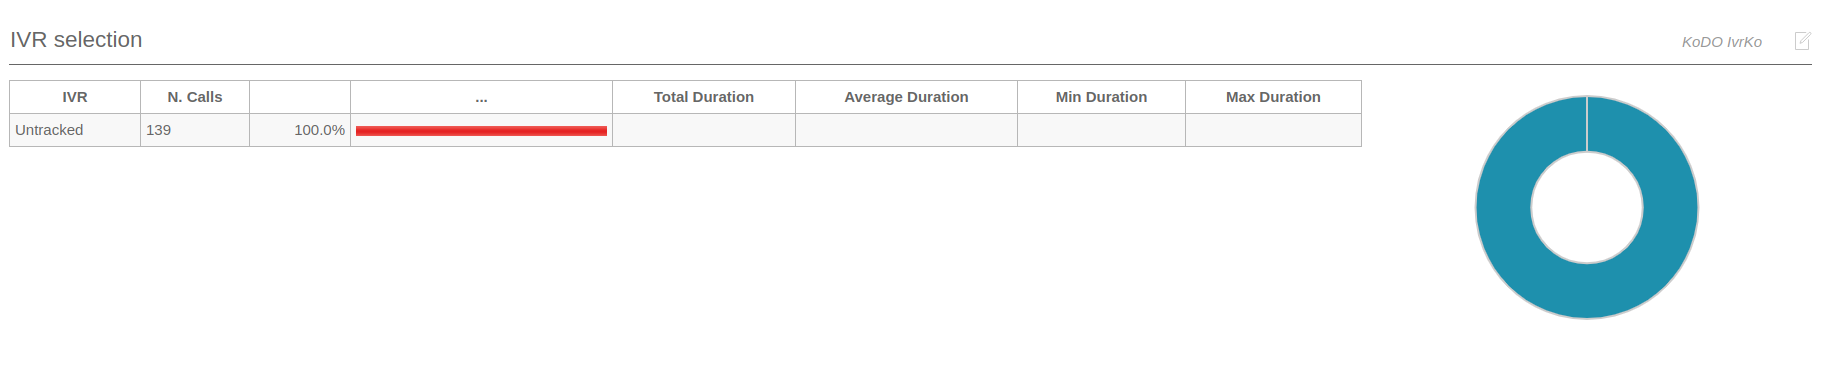
IVR selection
This graph shows the distribution of IVR selections available for lost calls.
This must be tracked manually in Asterisk - See "Configuring Asterisk for QueueMetrics" below.
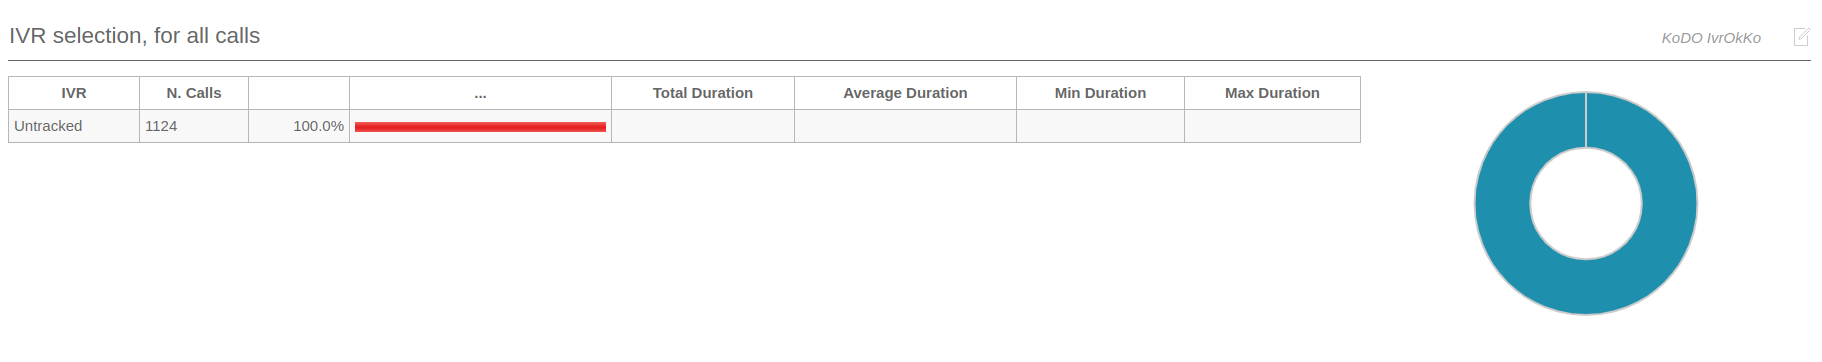
IVR selection for all calls
This graph shows the distribution of IVR selections for all calls (taken and lost) available in the report.
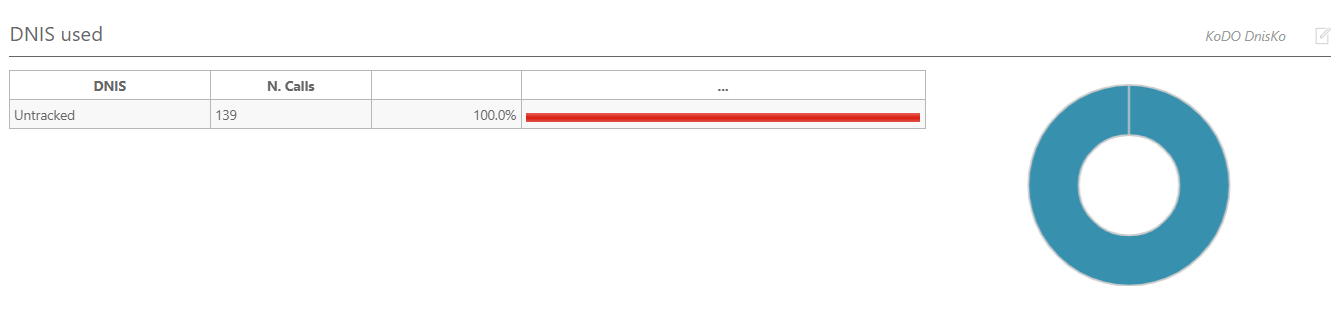
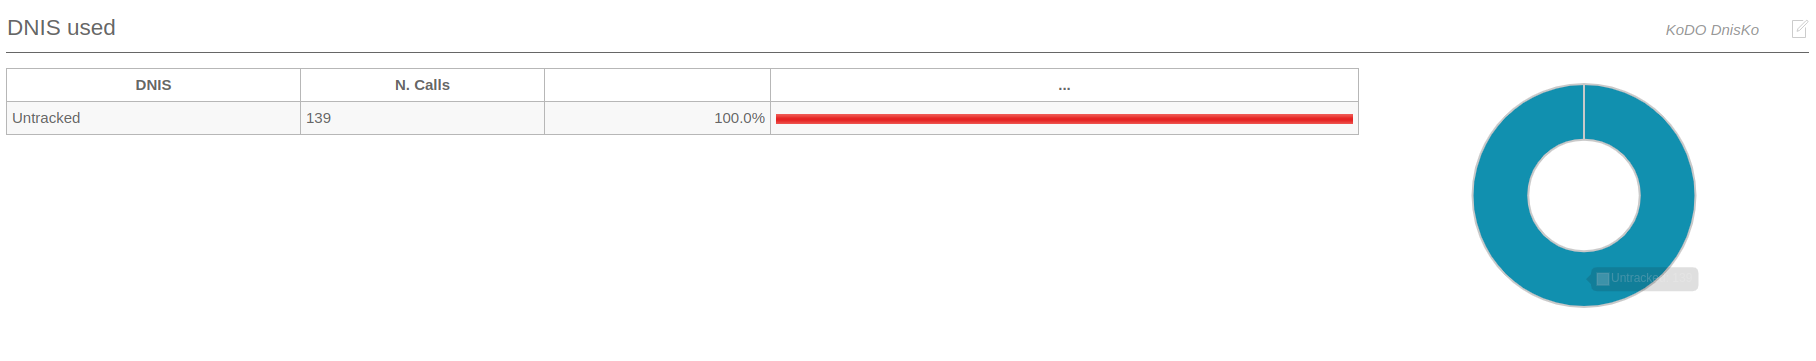
DNIS used
This graph shows the distribution of DNIS lines that lead to lost calls.
This must be tracked manually in Asterisk - See "Configuring Asterisk for QueueMetrics" below.
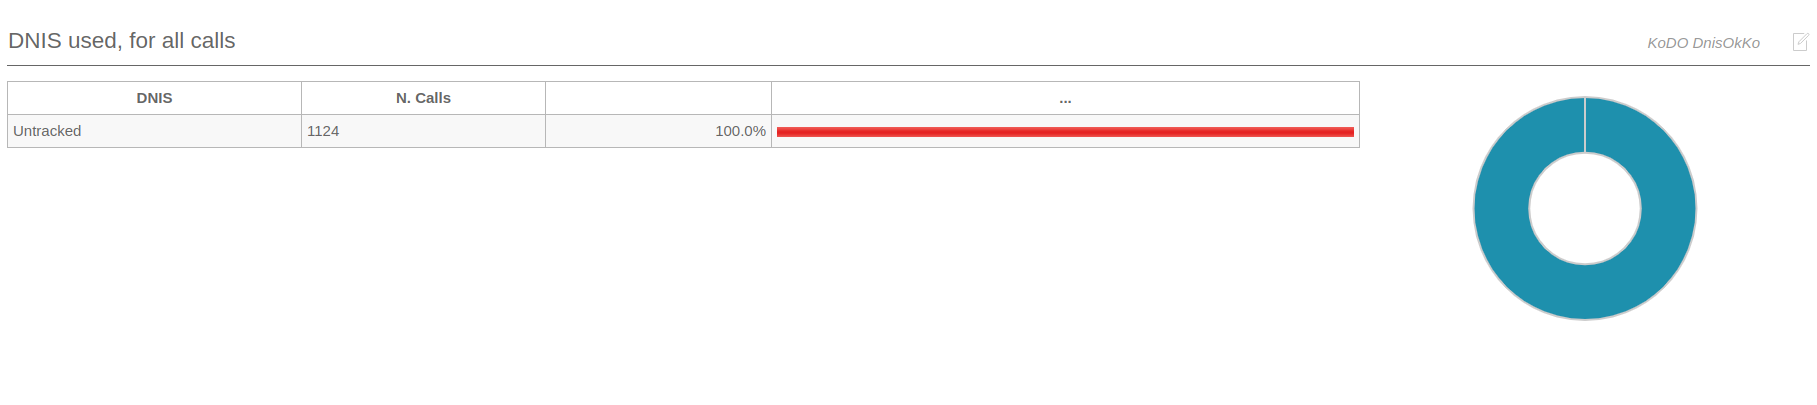
DNIS used, for all calls
This graph shows the distribution of DNIS lines for all calls (taken and lost) available in the report.
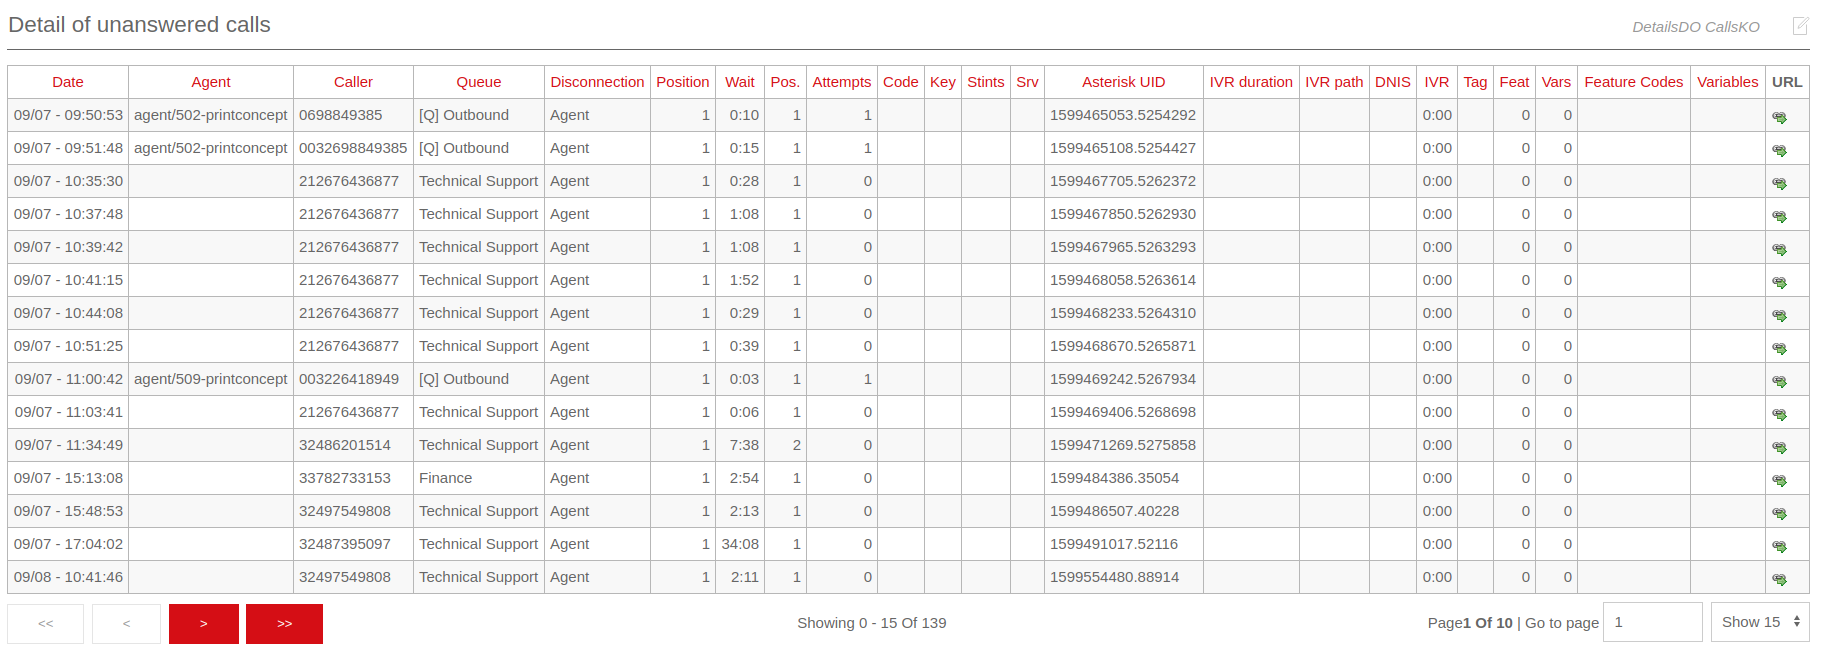
Details of unanswered calls
This page shows full details of unanswered calls Detail of unanswered calls.
Understanding results: Inbound ACD call attempts
When running an inbound call center, it is very important to determine the reason why a call is delayed: are your clients refusing to answer? Did they forget to log off before leaving their workplace? The inbound ACD call attempts metrics try to answer to these questions.
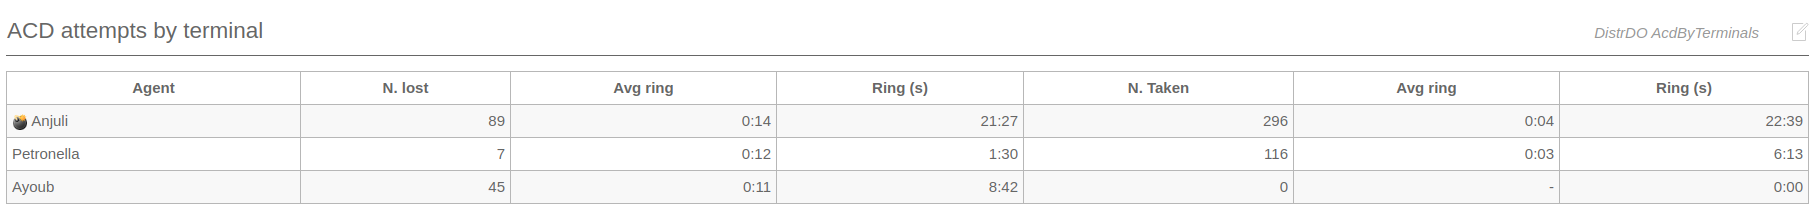
ACD attempts by terminal
This graph breaks down agent attempts by the agent that was called. The following pieces of information are extracted for each agent:
-
N. of lost agent attempts (i.e. the agent was called but not responding)
-
The average ring time for lost attempts
-
The total ringing time for lost calls
-
The number of taken agent attempts (i.e. calls answered)
-
The average ring duration for taken calls
-
The total ring time for taken calls
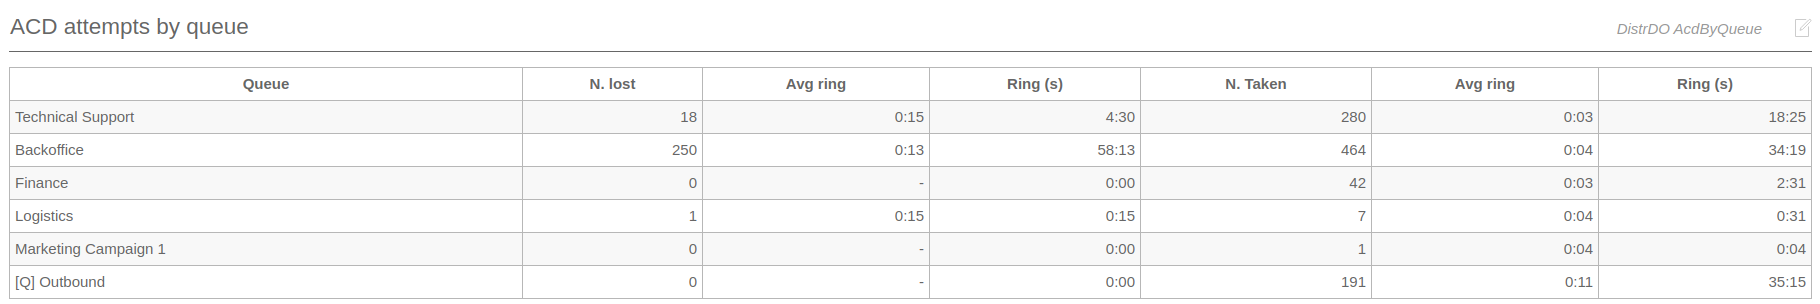
ACD attempts by queue
The following metrics are extracted and broken down by queue:
-
N. of lost agent attempts (i.e. the agent was called but not responding)
-
The average ring time for lost attempts
-
The total ringing time for lost calls
-
The number of taken agent attempts (i.e. calls answered)
-
The average ring duration for taken calls
-
The total ring time for taken calls
Understanding results: Call distribution
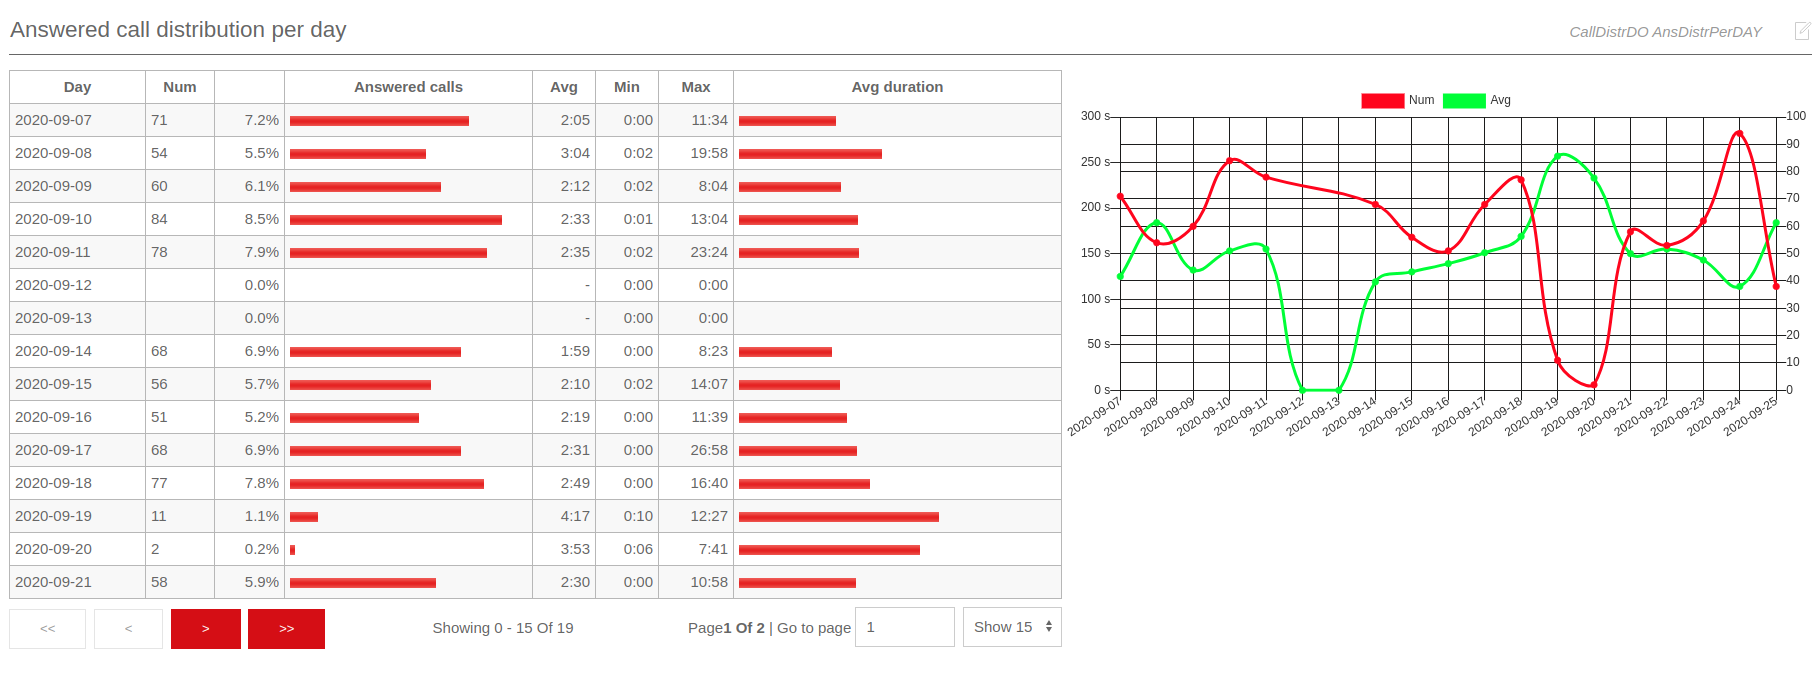
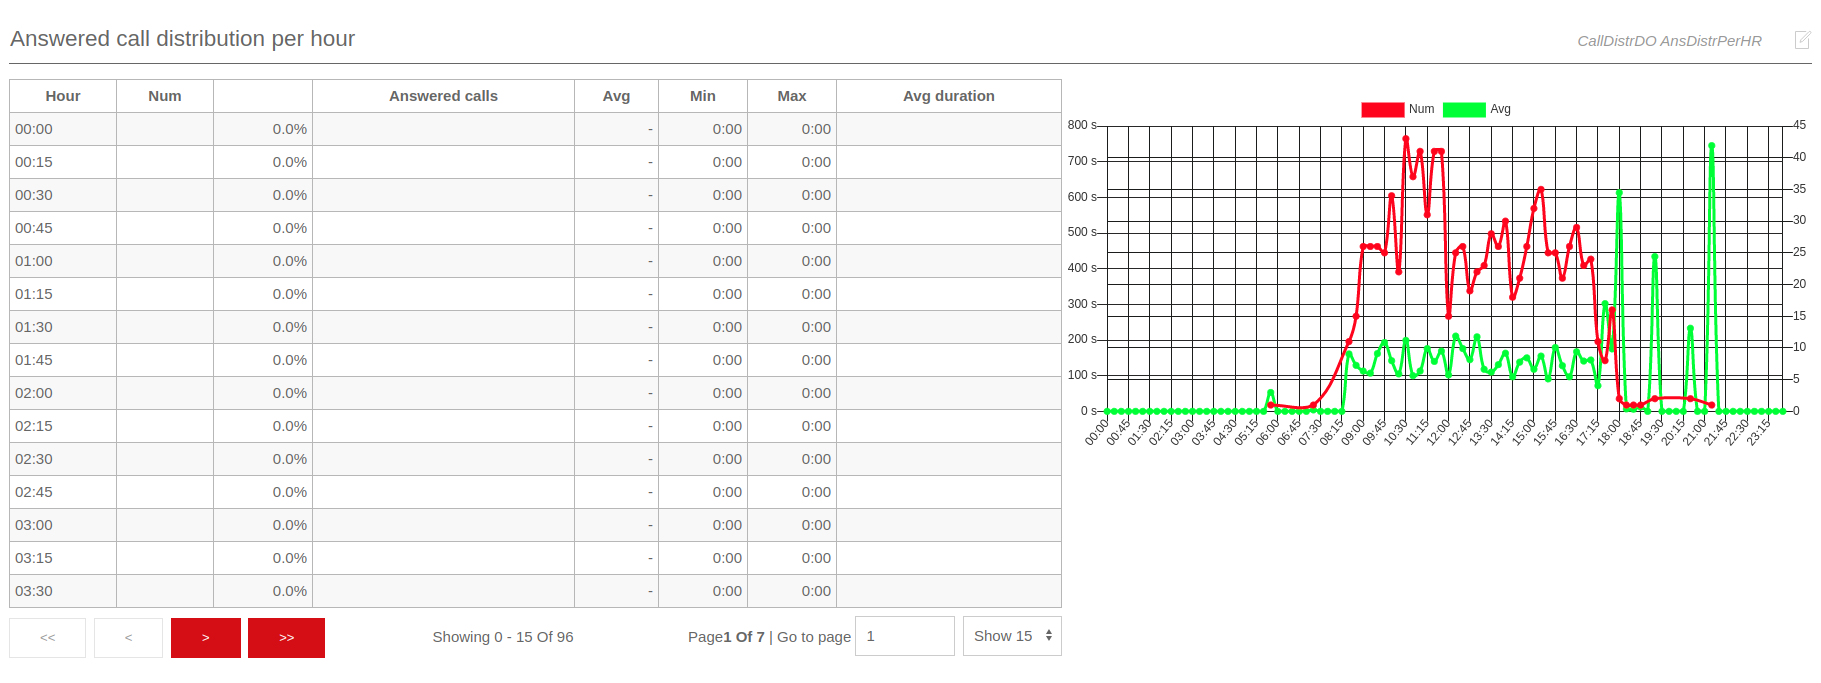
The call distribution report shows when calls were handled, when calls were lost and the average wait times broken down by period.
All percentages are calculated on the call class they belong to, i.e. a 50% of "Unanswered calls" on one day means that 50% of all unanswered calls for the period happened during that day, not that 50% of calls were lost.
For each metrics, the total number of calls is shown, together with average, minimum and maximum times. Graphs are plotted on the total number of calls broken down and on the averages.
It is possible to change the interval in the Hourly graphs, so that you can have reports break down calls e.g. by half-hours or hour quarters, by changing a value in the QueueMetrics Report Settings (Hourly Slot).
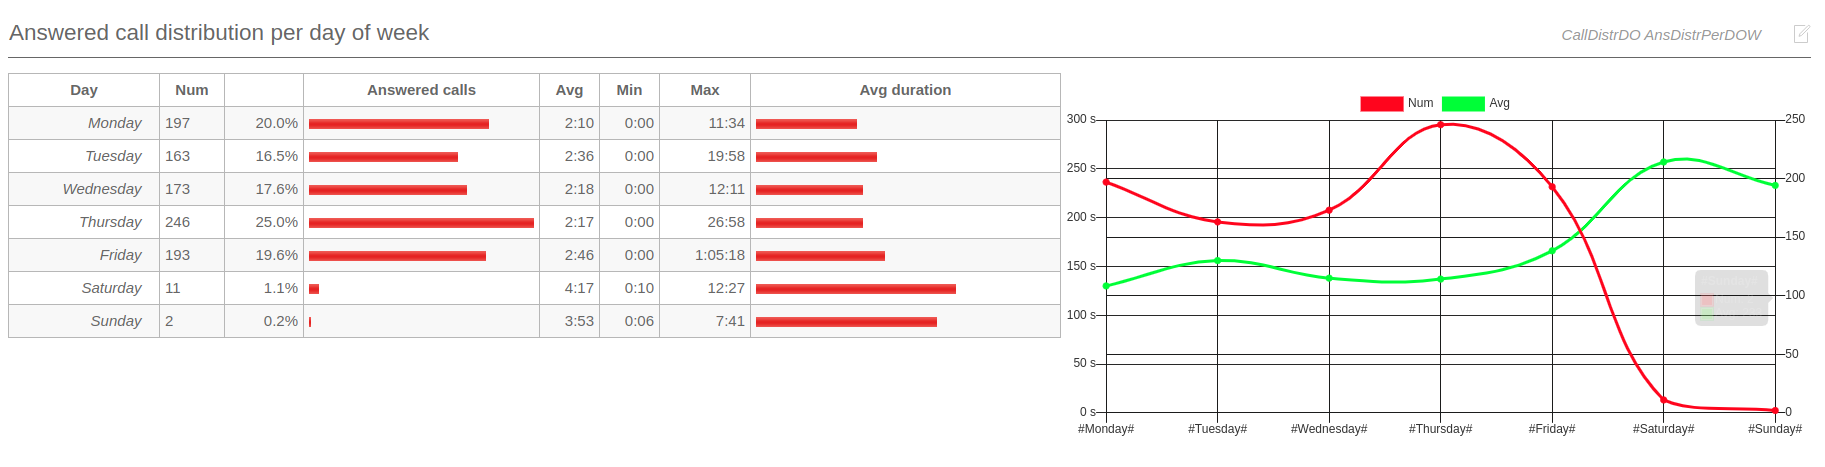
Call distribution per day
Calls, both taken and lost, are shown per specific day. Days with no events are not shown. The total numbers of call lengths, wait time for answered calls and wait time for unanswered calls are plotted for each day. Sales and contacts are also shown on a daily basis.
The Schedule Adherence report shows the number of distinct agents that were detected during the given period. This makes it possible to detect the number of different people that had been working on a given moment.
The Queue Length report shows the average length of the queue for each period, giving minimums and maximums. The Steps computation shows how fast each queue progresses during the period, expresses in steps per hour. Note: giving a meaning to the Queue Length reports may be hard in the case of composite queues.
Call distribution per hour
Events are shown on a 24-hour distribution.
The total numbers of call lengths, wait time for answered calls and wait time for unanswered calls, together with sales and contacts, are plotted for each hourly interval. The size of hourly intervals can be controlled by the default.hourly_slot configuration property, making it possible to run this reports based on 30-minute, 20-minute or 15-minute intervals.
Understanding results: Agent activity
Agent activity refers to the behaviour of Asterisk defined agents. If you connect you queues straight to telephone terminals, this section will always be empty.
Each agent may be flagged as being a member of four priority groups:
-
Main: the agents usually answering the queue
-
Spill: the agents answering the queue if all "Main" agents are busy or unavailable
-
Wrap: the agents answering the queue if all "Main" and "Spill" agents are busy or unavailable
-
Undefined: this agent is not a member of any priority group for this queue
This feature is useful if priority groups are used in the queue configuration. If they are not used, just assign all agents to "Main" for each queue.
If an unknown agent appears on a queue, it will be marked as "Undefined", written in red.
Agent names are written in blue and are clickable, if you click on them in any of the graphs, you will be lead to a popup that detail the logon and pause history for that agent.
As a default, QueueMetrics will show and count an agent session if and only if the agent handled at least one call during this session. This may not be what you want when you use pause codes - an agent may log on and immediately go on pause to do some back-end activities. If this is the case, you should set the configuration option default.useRawAgentSessions to true to see all agent sessions.
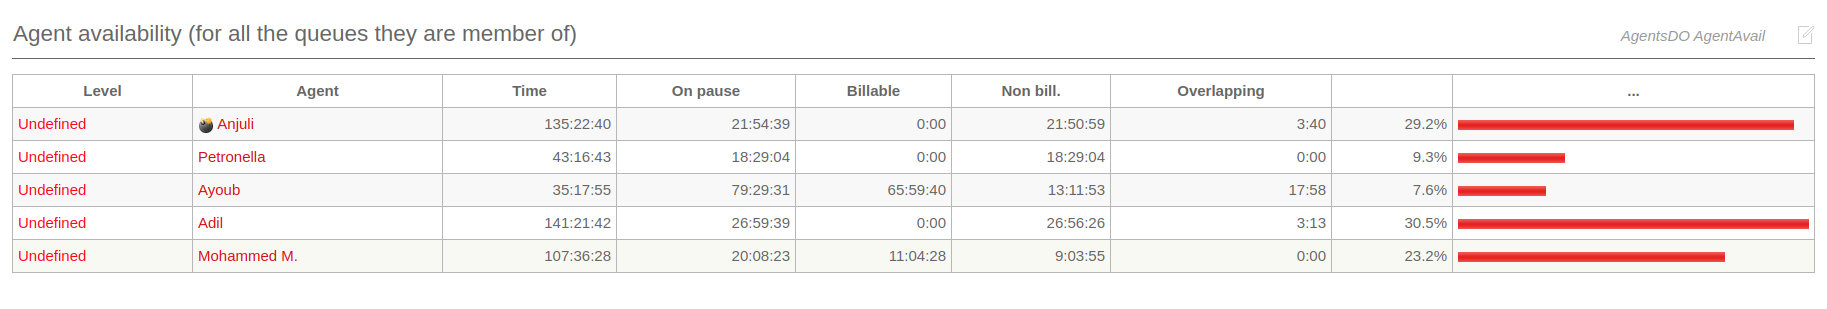
Agent availability
This graph shows which agents were available during the specified time frame and the percentage of agents' available time each one cumulated.
This time is calculated per all queues any agent is a member of, as the act of logging on is in general for the whole system and not specific to one single queue.
For each agent, the total time on pause - if any - is computed and broken down as "Billable" or "Not billable" - see the section on Pause Codes.
The "overlapping" is the amount of time that an agent was paused BUT taking calls. As you can pause in the middle of a call (maybe your system doesn’t allow this, but it is conceivable) you could have a period where you are paused BUT on conversation as well.
The '%' written next to the graph is the percentage of the pause time.
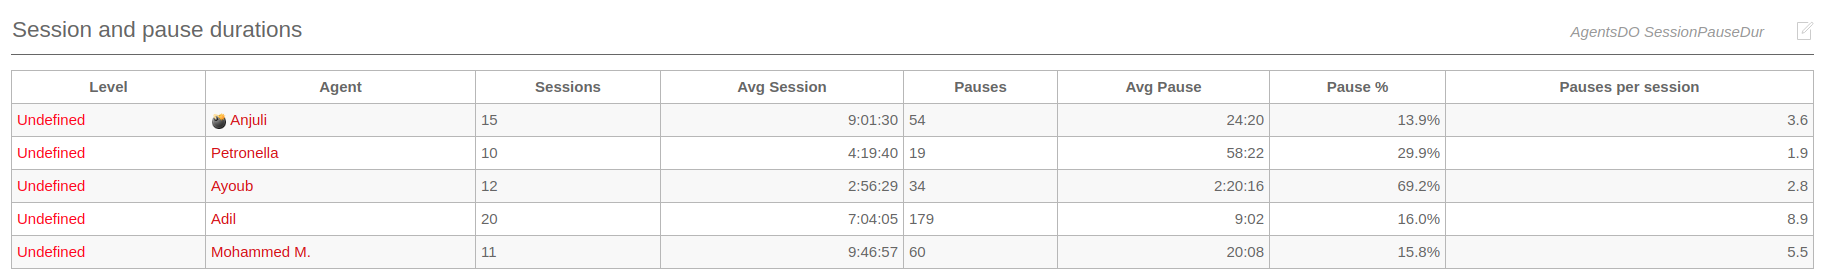
Session and pause duration
For each agent, the total number of sessions and pauses is computed (session time is already deducted of pause time). For both sessions and pauses, an average length is computed.
The "Pause percentage" is how much time an agent was on pause compared to available time.
The "Pauses per session" computes how many pauses - on average - each agent makes for each log-in session.
These metrics should be considered according to your call center rules on pauses and time-out.
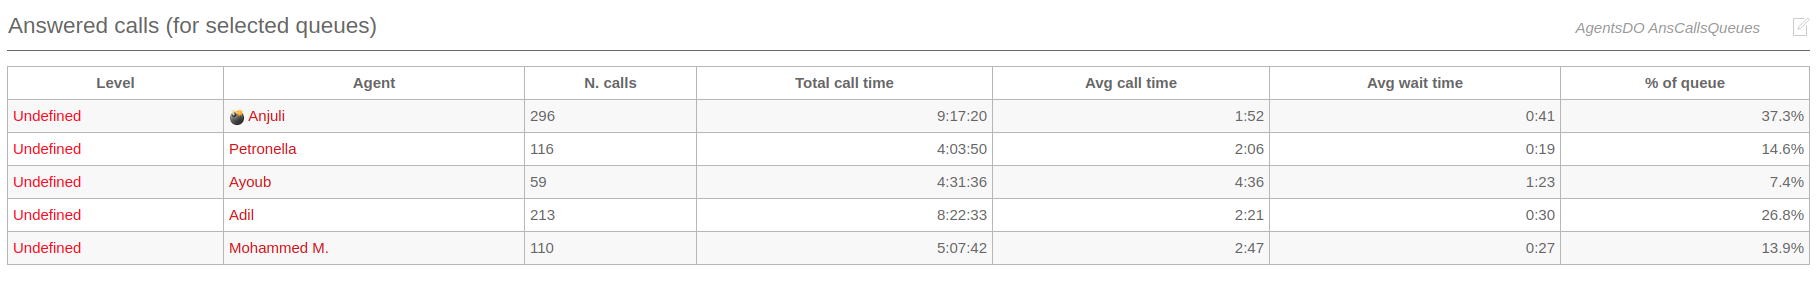
Answered calls for selected queues
This graph shows who of your agents answered calls for the queues you selected. The number of calls, together with total and average call durations are computed accordingly.
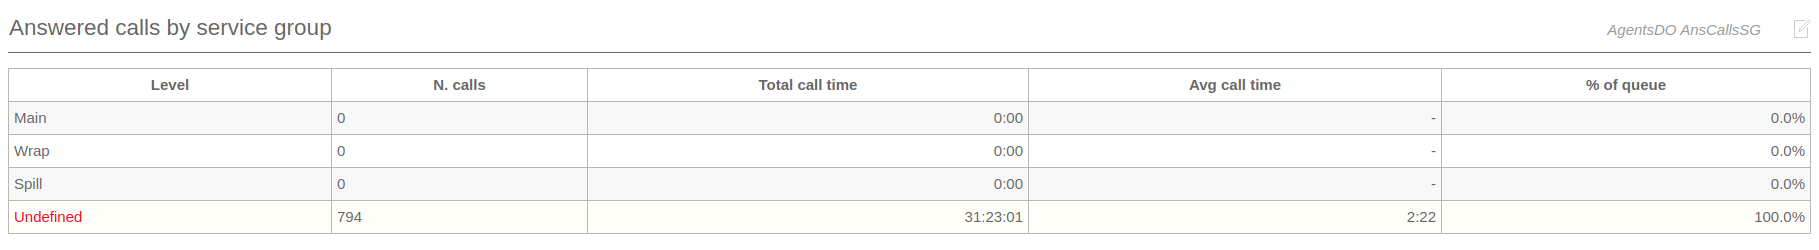
Answered calls by service groups
This graph show which priority levels handled calls for your queue. This shows whether your main line is staffed enough to handle the load of incoming calls.
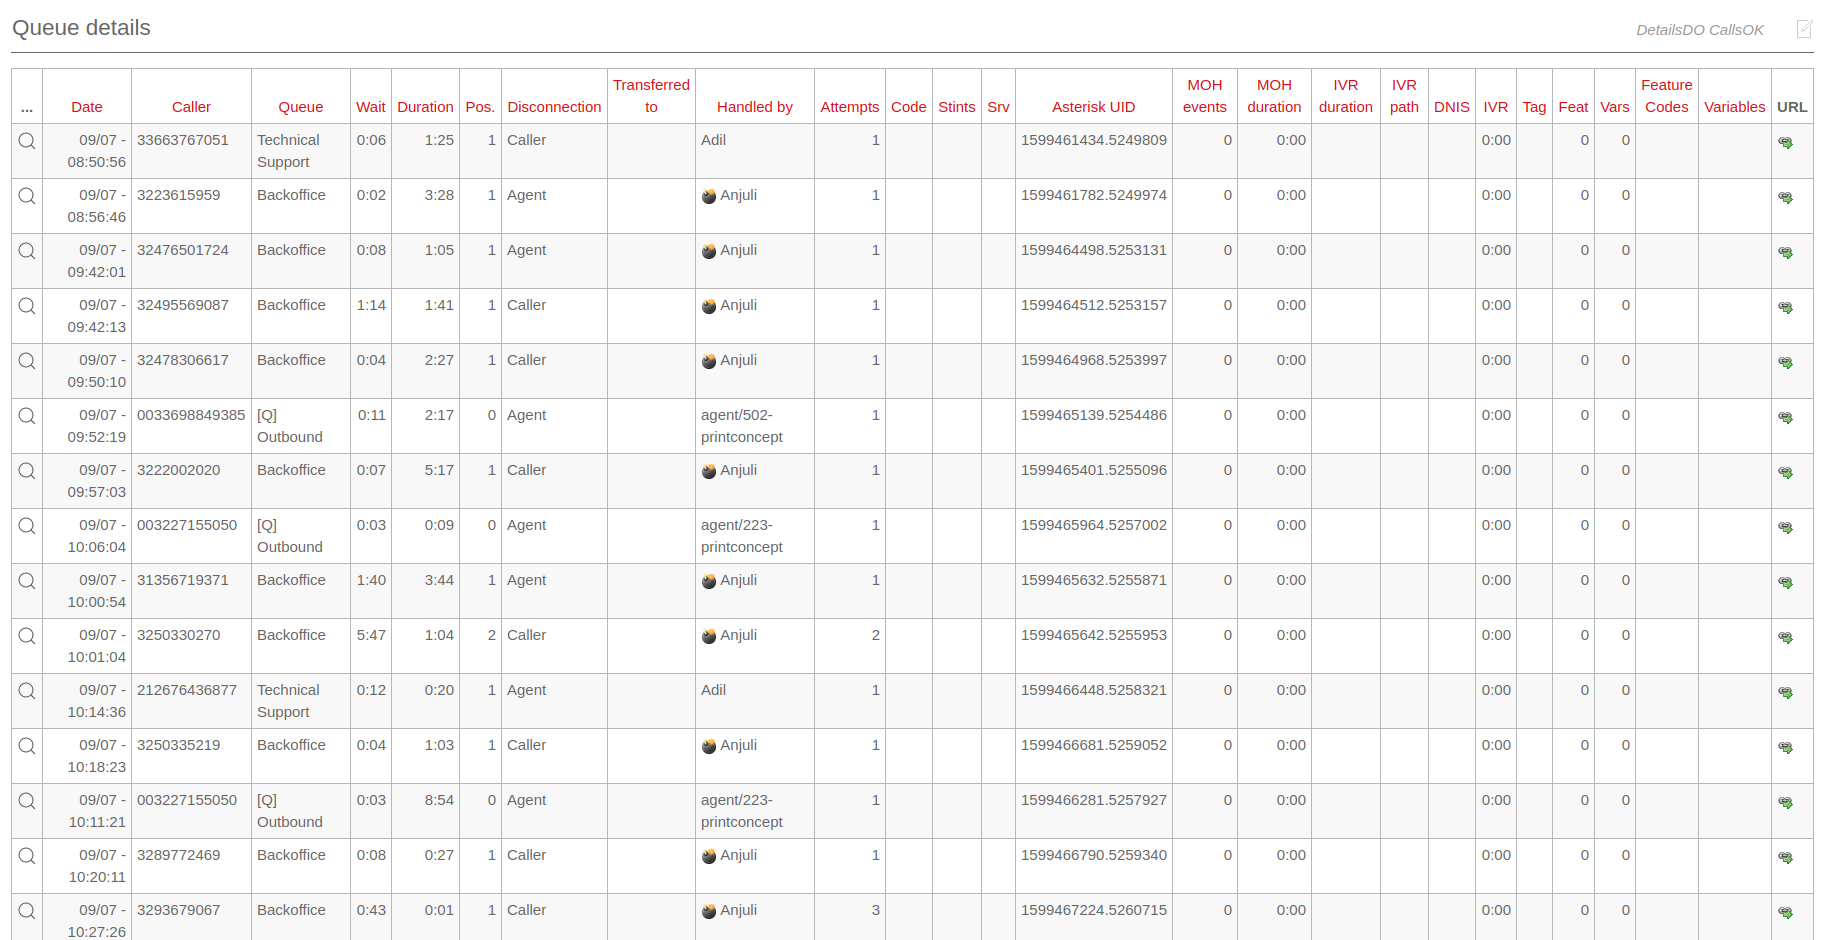
Session details
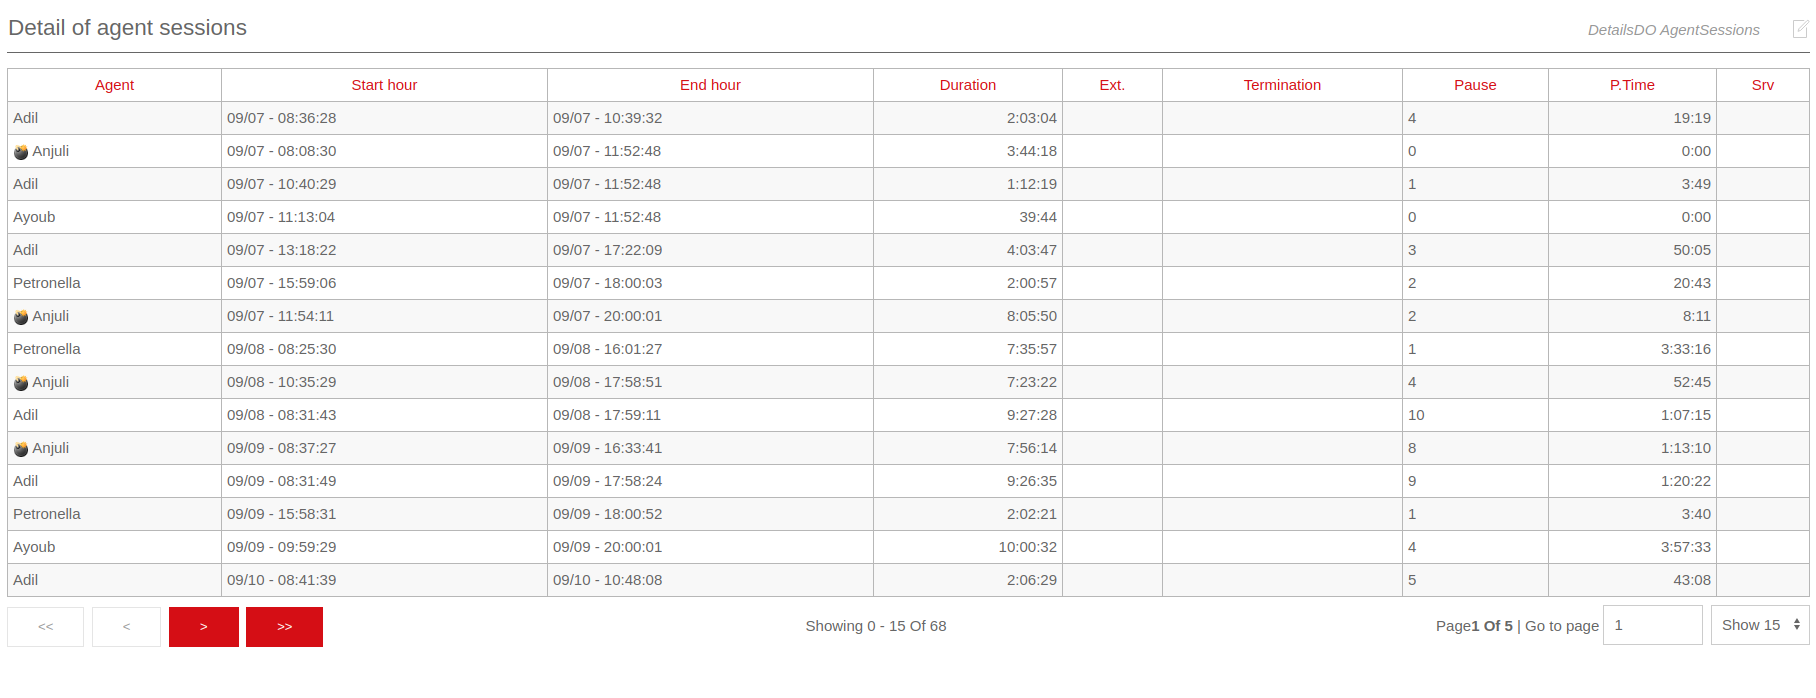
For each agent session, the start and end times are recorded, together with the total duration in seconds.
If the agent logs on via the call back function, the designated call back extension is shown.
The number of pauses and the total pause time in seconds is shown.
The "Srv" column tells you on which server an agent was working in case you set up a cluster of Asterisk servers.
It is possible to sort the table for each title, in either descending and ascending order. To do this, click once on the desired title for descending sort, and twice for ascending sort. Once the table is sorted, an arrow symbol will appear close to the title, so you know on which column it was sorted last. As the sorting is done on the client machine, it may take a while with very large tables.
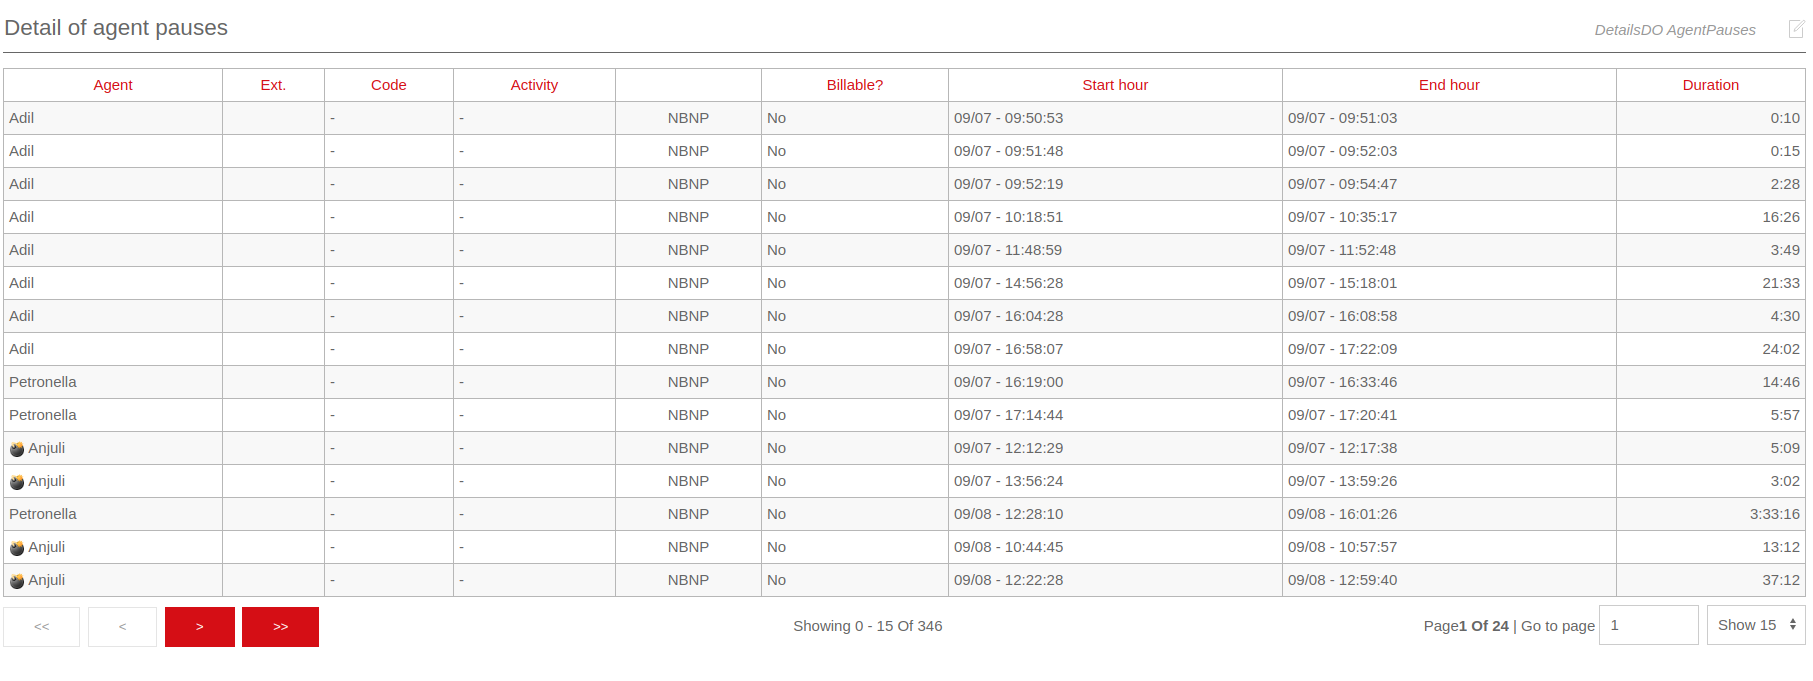
Pause activity details
This table shows the specific pauses that each agent took and the pause code that was entered for each pause. It also shows whether the pause taken was considered to be billable or non-billable.
Agent history popup
If you click on an agent’s name, a new popup will appear with full history for that agent. You can scroll in it as needed by using arrow keys or the wheel of your mouse.
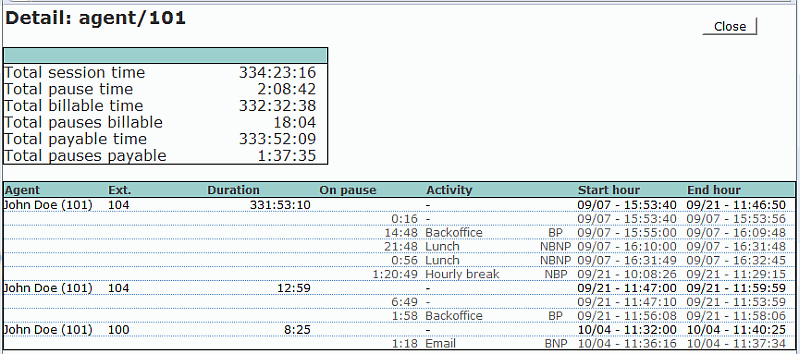
A complete description of the popup is available in the Report Details: Popup of agent activity .
Understanding results: Call outcomes
If your agents are entering Pause codes or Call outcomes, the "Outcomes" tab will let you report on the information they just entered.
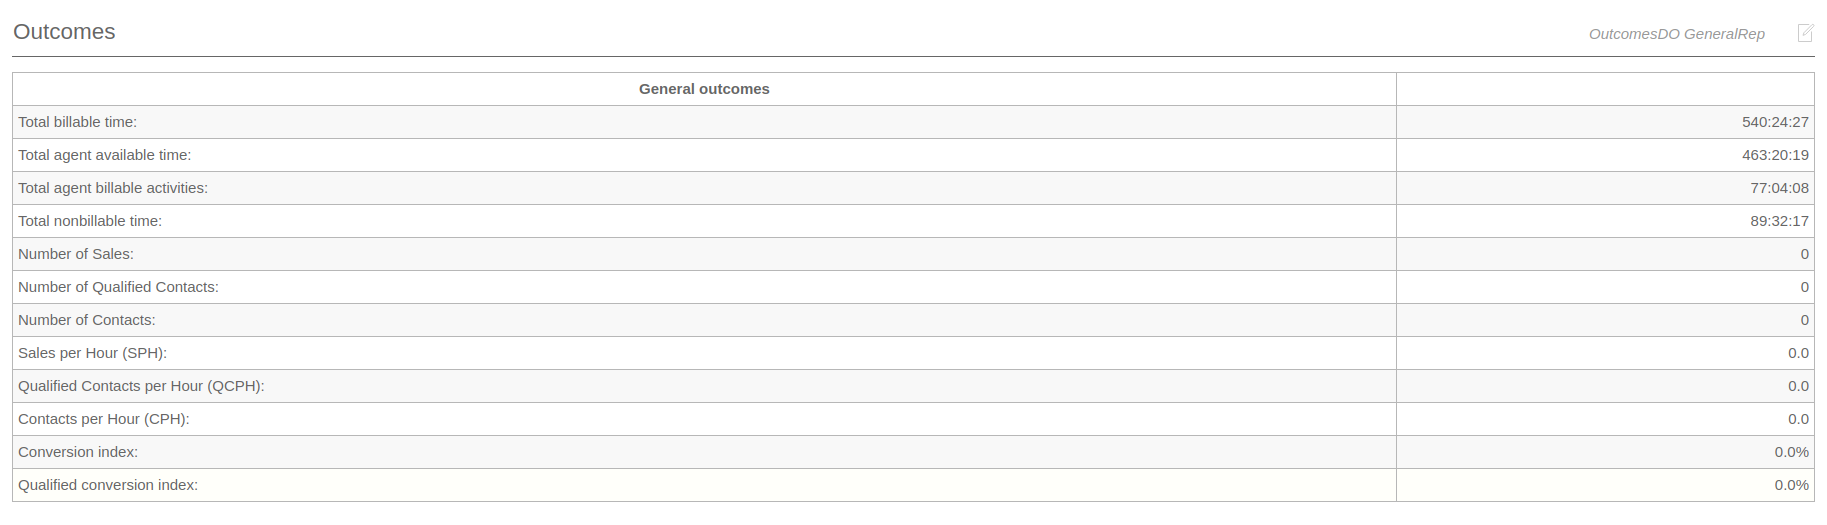
The top panel will display an overview of the situation, showing:
-
How much billable time there has been on this system, broken down by ACD/call time ("agent available time") and billable activities (agent on pause)
-
The total non billable time (e.g. lunch, breaks)
-
The total number of Contacts, Qualified Contacts and Sales, as defined by call outcome codes
-
The Sales per Hour (SPH), Qualified Contacts per hour (QCPH) and Contacts per Hour (CPH) ratios
-
The Conversion index, that is the percentage of sales over the total number of sales and contacts.
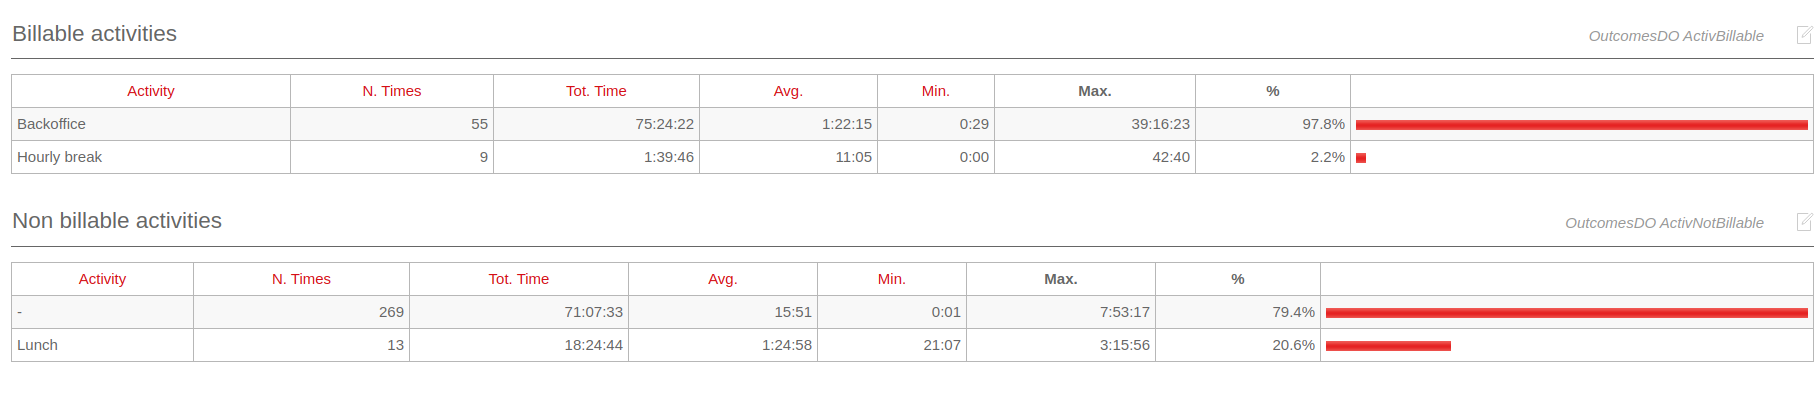
Further down the page, you can find details explaining Billable and Non-billable activities, with average, minimum and maximum session durations, and a percentage on all activities of the same kind.
The Detailed Agent Report will show, for each agent:
-
The Available (ACD) time, as an absolute value and a percentage of its total time logged on
-
The Billable time, as an absolute value and a percentage of its total time logged on
-
The Non-Billable time, as an absolute value and a percentage of its total time logged on
-
The number of Sales And Contacts the agent had (if a sale is counted a s both a Sale and a Contact, it’s counted only once as a Sale)
-
The Sales per Hour (SPH) and Contacts per Hour (CPH) ratios for this agent
-
The Conversion ratio, that is the percentage of sales over the total number of sales and contacts.
How are Call Outcomes calculated?
The idea is that a call can be a Contact, or a specialized contact that is a Qualified Contact, or a specialized Qualified Contact that is a Sale
This is needed because all the SPH, CPH and QCPH are calculated not on the totals of each class, but on sums of that class and generic types, like:
S = Number of Sales
C = Number of Contacts
Q = Number of Qualified Contacts

CPH = C / (logon time - not billable pause time)
QCPH = Q / (logon time - not billable pause time)
SPH = S / (logon time - not billable pause time)
Conversion indexes are calculated as:
CO% = S / C
QC% = S / Q
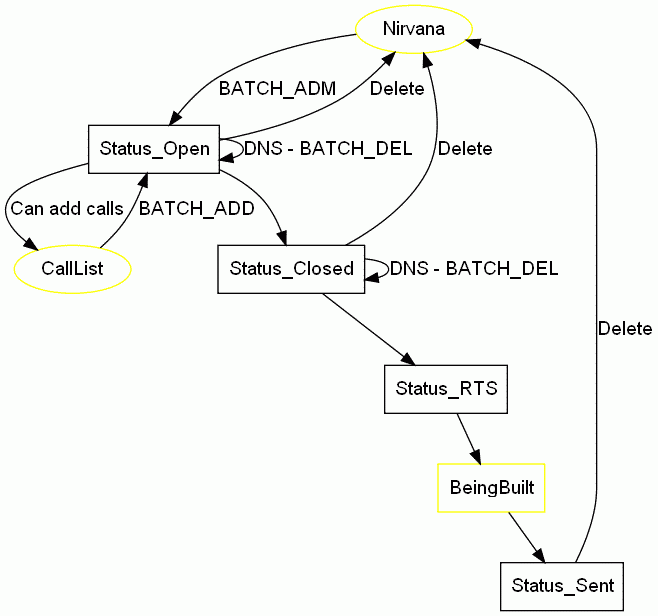
Multi-stint calls
In QueueMetrics, we define a multi-stint call as a call that was processed on more than one queue, with one or more queue terminating it for timeout, transfers or key exits.
In the standard QueueMetrics reporting mode, this call would be seen as a series of "lost calls" on one or more queues, possibly followed by a taken call if the call was answered at all; the system does not notice that those events happened on the same call.
Running QueueMetrics in multi-stint mode, calls will be grouped together based on the call’s Unique-ID, and a single call will be rebuilt as a multi-stint call so that:
-
The call looks like it was handled on the first queue it was presented on; the queue enter time and queue position are those of the first queue.
-
The call will be considered "answered" if the last stint is an answered call, "lost" in all other cases
-
The wait time will be the sum of the wait times on different queues (if there are intermediate wait times, like those for IVR menus, they will not be counted)
-
The talking time and agent taken the call will be taken from the last taken call
-
All stats (number of call, call distribution, etc) will be counted on the new multi-stint calls.
Limitations and side-effects
Multi-stint calls aren’t for everyone. There are a number of limitations and side effects you should be aware of before attempting to run QueueMetrics in this mode:
-
Calls are grouped by the Asterisk Unique-ID code; this means that if different call stints happen on different servers in a cluster, they will not be grouped together
-
All queues the call passed on must be included in the report. If you include only the master queue, stints on other queues will not be seen.
-
Because of the previous bullet, it is usually better to configure separate "wrap up" or "timeout" queues, that is, instead of having both a Sales and a Support queue that will send people to the General queue on timeout, it would be better to have "Sales" → "General-sales" and "Support" → "General-support", even if "General-sales" and "General-support" are actually aliases of the same queue.
-
All stints of all calls must be included between the starting and ending report times. Stints that start before the start data or end after it will be ignored.
-
Run time and memory will be comparatively more than a standard analysis, as the grouping and additional data stored take their toll on the system
-
Stint-grouping does not work for real-time analysis.
| On versions of QueueMetrics up to 1.6.3, calls are filtered by search criteria before being aggregated in multi-stint mode. This may lead to problems when you want to use filtering criteria in multi-stint mode, where only some stints match the critera while others does not. T To avoid this issue, on newer versions of QueueMetrics calls are joined together in multi-stint mode before criteria are applied to the aggregated results. |
Multi-stint calls in QueueMetrics
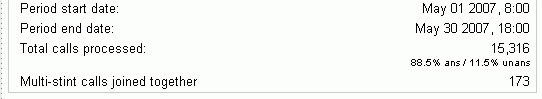
If you run calls with multi-stint mode enabled, the string "Multi-stint calls joined together" will appear on the top panel, and the number of joined together calls will be shown.
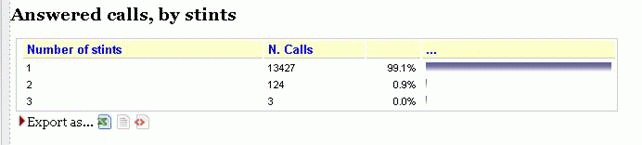
The distribution of taken calls by stints will be shown in the "Answered calls" tab:
The distribution of lost calls by stints will be shown in the "Lost calls" tab; aggregate calls by stints will also be shown in the "Lost Calls" page:
Details of multi-stints calls are displayed in the call details pop-up, in a separate tab. See Showing call details.
Displaying calling/called numbers
By default, QueueMetrics will display numbers with the format they are in as reported by the PBX. This may or may not include a relevant name for the caller.
If the number is known to QueueMetrics, as defined in Known Numbers, then it is rewritten as to display the name that was set up in Known Numbers, and if the number is earmarked as VIP or BLACKLIST, a special icon is added by the name. If you do not want this behavior, you may switch it off through a configuration property.
It is also possible to hide the display of numbers from some (or all) users, on an user-by-user basis. This behavior is sometimes needed in secure environments where you do not want agents to see the caller.
To turn this on for some user, you need to add the security key HIDE_NUMBERS to their profile.
At this point, QM will hide all numbers, according to an hiding policy, as specified in the table below,
that is to be set in the property default.hiddenNumberPolicy:
| Policy | Description |
|---|---|
|
Number is replaced with a value, as to make it unreadable. Different numbers will have different values. All computations based on numbers (eg FCR) are preserved. |
|
Number is replaced with three stars. |
|
Number is replaced with as many stars as the number has characters. |
|
The last three digits are replaced with stars. |
|
The last five digits are replaced with stars. |
|
Number is unaltered. |
Some special numbers (e.g. blank, "none", "unknown", etc.) are not replaced.
| When hiding numbers, features that depend on the hidden numbers (e.g. FCR, area codes, AMO dialing, etc.) may not work or produce partially unreliable results for users with hidden numbers enabled. |
Exporting calls - an overview
The main problems that arise from exporting calls are:
-
Selecting the set of calls that have to be exported, and
-
Retrieving all audio calls for export
We need to be able to select freely a number of calls for export, given one or more export criteria; we want to be able to review the results before they are final, and we want to exclude specific calls when reviewing.
The retrieval of audio causes a similar problem; first, audio retrieval was not really made for batch access, so seek times for individual files may be in the order of one per seconds; secondarily, those files may well require a large disk space when preparing the batch.
The call export feature works in batches, that is, at any given time there are a set of batches that an administrator creates and that are to be exported. Each of them has a name and a status.
This is the life-cycle of a batch:
-
An administrator creates a batch for a given data export needed and gives it a meaningful name, e.g. "Client X week 02/10". The batch is now in state Open.
-
Users holding the correct key will be able to add calls to the batch, that is, when they run a report in QM, on the "Taken calls" page they see a button that invites them to add the selected set of calls to the open batches. They can repeat this process as many times as it is needed. If the same call is added multiple times to the batch, it only appears once.
-
When the batch is ready, the administrator closes it. When the state is Closed, it is not possible anymore to add calls to that batch.
-
When the batch is Open or Closed, it is possible for the administrators to see the list of calls in the batch and to listen to their audio/video attachments. Individual calls may be flagged as "Do not send" - those calls will appear in the batch but will not be show in the outgoing records.
-
When the batch is finalized, the administrator will flag it as "Ready to send". Batches that are "Ready to send" are actually being built by QM - it may take a while to create them and download the audio files required.
-
When the batch is finished processing, it will appear as "Sent".
-
A batch can be deleted at any time by the administrator, unless it is in status "Ready To Send".
The graph provides a visual representation of the whole process:
The process of building a batch may take a while - therefore there is a transaction that simply keeps displaying a page in a browser that shows a progress bar while the project is being exported.
Exporting calls in practice
In order to export calls, an administrator must first create a batch. To do this, they go to the Home Page → Import/Export calls:
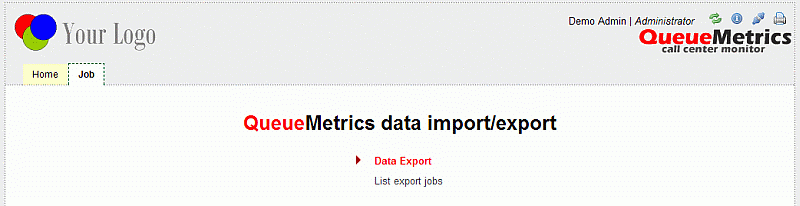
From here you select List Export Jobs.
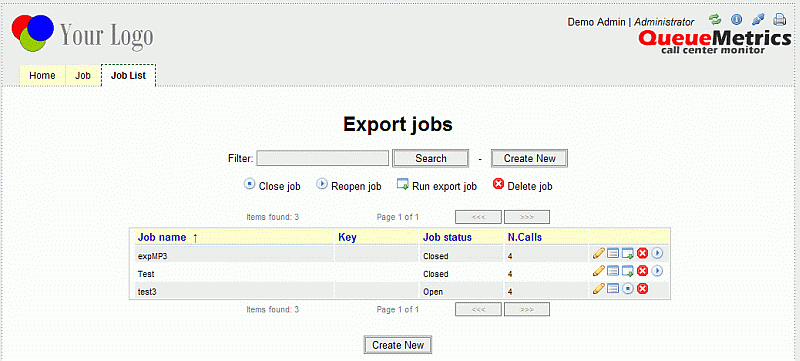
You can then create a new job.
When configuring the job, you have to specify:
-
A name for the job. This will be the name of the folder that will be created including the call details and the audio files.
-
A security key so that only some agents can add calls to this job.
-
An export folder - it can be the same for all jobs, and be on the server QM is on. It should be writable by the java process that runs QM,.
-
An implementor, that is, a data format for Manifest file of the job. See below for more details.
-
If the implementor requires them, you can specify a set of parameters.
These properties can be changed through the lifetime of the job.
From now on, users accessing the Detail of Taken Calls will see a gadget by the end of the page like the one shown here:
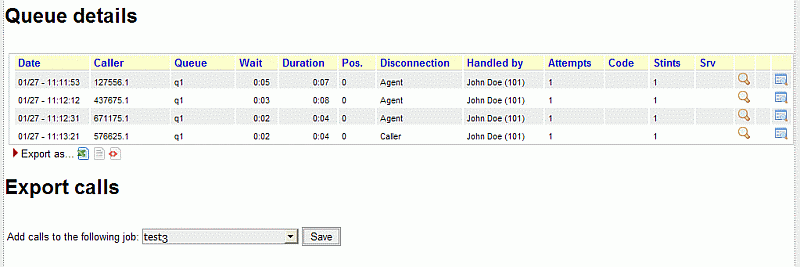
This basically lets you add all the calls above to the export job you select. If the export gadget should not be visible, you have to add it manually to the current report (its code is OD02 - see Block OD02 ).
After you add sone calls to a job, the import transaction will confirm the add through a popup screen that displays the number of calls imported and the number of calls rejected (because they were already a member of this job). Only jobs in state Open will be availble for adding calls.
You can now see a list of calls from the Export Jobs page:
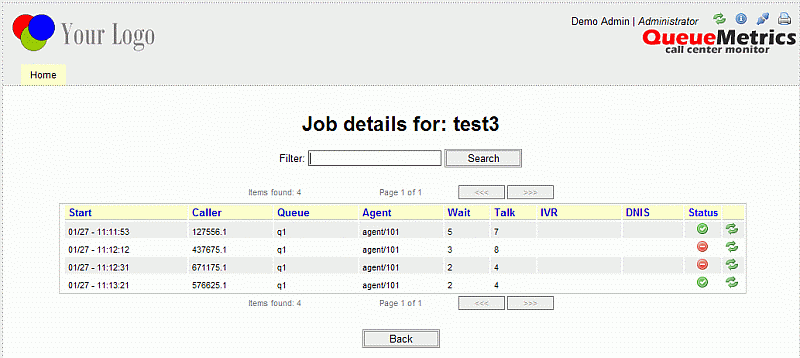
You can search calls within the current job and toggle their inclusion in the exported list by clicking on the reload icon next to each call.
When the job is ready for shipment, the administrator first has to Close it and then to Export it. This will take a while. Audio files will be retrieved through the curremtly configured Pluggable Module for audio records and will be saved in the job folder.
Output format
Thought the actual attributes used are based on the Implementor module used, the following are common attributes.
Batch attributes
-
Name
-
Disk path (must be accessible to Java)
-
Created by, on date
-
Closed by, on date
-
Sent by, on date
-
Video (yes/no)
-
QA (yes/no)
Each call in the batch has the following attributes:
-
Type: "T" taken "L" lost (initially we will only have Taken calls)
-
Cluster-ID
-
Server-ID
-
Entered at
-
Wait time
-
Talk time
-
Caller
-
Agent
-
Queue
-
Call status
-
Call status type (e.g Sale)
-
N. of audio pieces
-
Names of the audio pieces, comma-separated ( a single call may have multiple recordings)
Batch disk format
A call batch appears on disk as a folder under the system call batch folder. The folder is created if not present (it must be in a Java-writable location). When the batch is in status "Ready to send", the audio files are copied to this folder; at the end of it all, a manifest file that includes the details is written. Each downloaded audio file is renamed in order to be unique and coherent, typical file names may be:
0000123-1.wav
0000123-2.mov
Both files are about the 123rd call, the first one being an audio recording and the second one a video recording.
When the batch is in status "Sent" QM no longer cares about the disk representation - it can be moved, sent as FTP, compressed and encrypted, whatever.
Manifest file format
The manifest file format should be chosen by the sysadmin - it is implemented as an abstract class for ease of change.
-
It will be called Manifest.xml
-
It will include a set of <call> entries including all data as per the previous section "Batch attributes"
Available implementors
HTTP file transfer
This is the basic implementor and produces an XML file.
HTTP MP3 file transfer
This implementor does two things:
-
produces a basic manifest
-
retrieves QA valuation data if present
-
if audio files are in MP3, will insert or set ID3v2 tags so that the title of the MP3 contains information about the call.
The following ID3 tags are created:
-
Call details
-
caller id
-
queue
-
dnis
-
call lenght
-
start time
-
lenght
-
agent
-
-
Call status
-
Date of Grading
-
Time of Grading
-
Grader ID and/or Name
-
Overall Grade
-
Graders Comment
| this implementor DOES NOT transcode files to MP3 - they must already be in MP3 format or you should provide an external batch script to do the conversion. More details are provided in the following paragraph. |
MP3 conversions on the fly
QueueMetrics lets you able to perform an external batch script call in order to convert call files to different format like, for example, wav files in mp3s. This feature is applied only for export jobs implemented with the "HTTP MP3 File Transfer" object. No external calls will be made for "HTTP File Transfer" enabled export jobs.
Assuming to have this type of export job parameters: Job name: MyJob Export folder (on server): /var/spool Implementor: HTTP MP3 File Transfer
the work flow followed by QueueMetrics, for HTTP MP3 File Transfer enabled jobs, will be like depicted below.
For each call in the job and for each file associated to a specific call:
-
The file will be stored on server folder /var/spool/MyJob folder
-
A new temporary folder will be created on /var/spool/MyJob folder
-
An external bash script will be called. The script will receive, as parameters:
-
The full file name of the file to be converted
-
The full name of the temporary folder created
-
The name of the job as defined in the job definition page
-
The parameters string as defined in the job definition page
-
-
The script should convert the file in the preferred format and should place the result in the provided temporary folder. QueueMetrics will wait for the conversion termination
-
QueueMetrics will move (not copy) the full conversion result it will find in the temporary folder to the original destination folder (in this case /var/spool/MyJob). Please note that there should be more than one file resulting in the conversion (like, for example, a preview quality and a hi-res quality .mp3 files) and QueueMetrics will copy all of that.
-
The temporary directory will be removed by QueueMetrics
-
QueueMetrics will publish in the manifest all the files found in the temporary folder. These files will be associated to the specific call and the number of chunks published in the manifest will reflect this.
When all files in the job are properly downloaded and converted, QueueMetrics will add all relevant QA information only to files with name ending with .mp3
Please note that:
-
The external script to be called by QueueMetrics should be specified in the configuration.properties files through the key "export.conversionCommand". It should be executable by TomCat. If no key was defined, the HTTP MP3 File Transfer will skip all actions specified in the 2, 3, 4, 5, 6 steps above described (i.e. it will simply download the files and apply QA informations to eventually present .mp3 files)
-
If the external script is not present in the server and/or QueueMetrics is not able to run it, this will be signaled in the <errors> field present in the manifest (one for each call). In this case QueueMetrics will publish in the manifest the original file name.
-
QueueMetrics will not delete the original file from the /var/spool/MyJob folder. If you need to have it deleted, your conversion script should do it.
-
QueueMetrics will not publish the original file name in the manifest, unless if exceptions were raised in the conversion/move process. If you need to have the original file published in the manifest, your script should move (not copy) it to the temporary folder.
-
If some exception is raised when moving files or calling the external bash script, QueueMetrics will publish the original file name in the manifest.
-
If the conversion script generates a (set) of filename with name(s) already present in the /var/spool/MyJob folder, QueueMetrics will rename it (them) prepending the name(s) with a random 5 digit number followed by an underscore sign. The new name(s) will be published in the manifest
To summarize the overall process, a simple example of working environment is provided:
In the configuration.properties is the key:
export.conversionCommand=/usr/local/apache-tomcat-5.5.25/webapps/ROOT/testbatch
and in the /usr/local/apache-tomcat-5.5.25 is an executable testbatch script:
[root@qmmachine ROOT]# ls -la testbatch
-rwxr-xr-x 1 root root 87 Mar 10 05:17 testbatch
In this simple example, the batch script copies the original file in the temporary folder (with a not unique name in this example)
#!/bin/bash
# $1 is the source file
# $2 is the output directory
# $3 is the job name
# $4 is the parameter field defined in the job definition page

cp $1 $2/testresult
The resulting working folder will contain something like:
....
-rw-r--r--  1 root root  408516 Mar 10 05:18 17619_testresult
-rw-r--r--  1 root root   50110 Mar 10 05:18 18542_testresult
-rw-r--r--  1 root root  884372 Mar 10 05:18 18795_testresult
-rw-r--r--  1 root root    4740 Mar 10 05:19 20110304_084640-99.wav
-rw-r--r--  1 root root  419784 Mar 10 05:19 20110304_084640.wav-99-1.avi
....
And the manifest something like:
....
<call>
<files>testresult,2071_testresult</files>
<errors></errors>
<chunks>2</chunks>
<uniqueid>3033212900899824</uniqueid>
<videocall>true</videocall>
<callid>4006</callid>
....