The real-time status panel
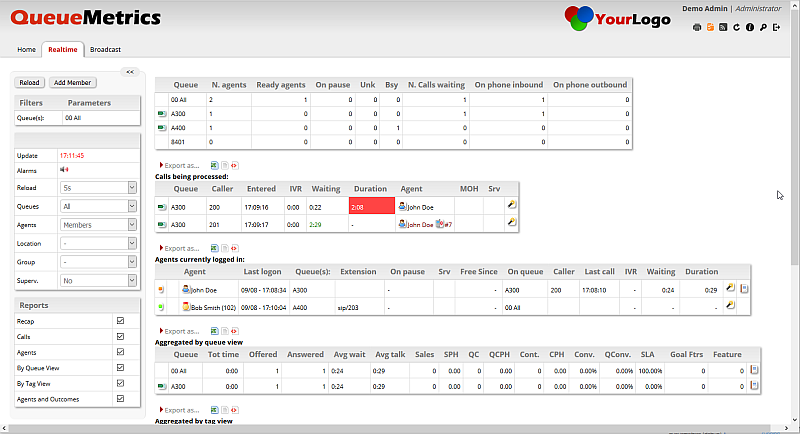
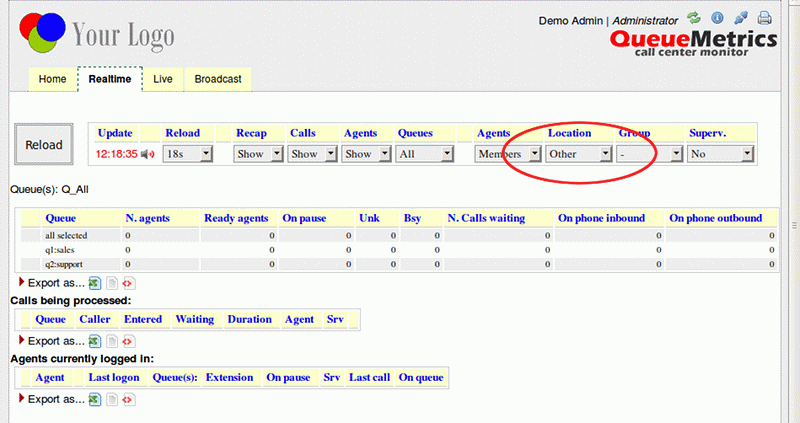
The real time status panel can be accessed by clicking the "Start real-time monitoring" label from the home page. It will show a page similar to the one below:
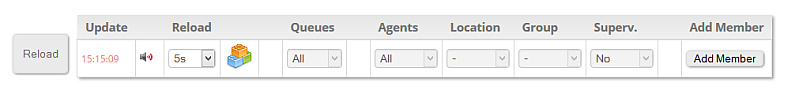
On the top of the page there is a control table showing the last update timestamp and other dropdown selectors as specified below:
-
Reload: It defines the update period will be used to refresh the shown data
-
Agents: Shows or hides the Agents currently logged in table
-
Queues: Shows all queues or only active queues
-
Agents: Toggle between all agents or members only agents
-
Location: If granted by user permissions, defines which location is shown
-
Group: Defines wich agent group is shown
-
Superv.: Filter out agents not supervised by current user
The page is able to auto-refresh in background at the period specified in the first dropdown but you can anyway force a faster reload by clicking the "Reload" button.
| If you enable filtering by Agents, Location or Group, statistics depending on lost calls (especially Lost attempts) may be undercounted in the view, as lost inbound calls will not be included in the data set to be considered, as they "belong" to no agent. |
Next to the control table, there is the data section. Depending on the status of previously mentioned dropdown, three sections could be shown.
The first is a table showing a summary of all calls flowing through queues. Following that summary, there is a table showing which calls are currently handled by the queue system, then the agents logged in at the moment.
This page is invaluable because can tell you in a glimpse what’s happening in the call center; it is meant to stay open in a window on the CC manager’s workstation to have the exact feeling of what is going on at the moment.
On the sample page above, you can see two calls and two connected agents. Just like in the main analysis, you can choose which queues you want to monitor to avoid being overwhelmed by data.
You can also see that the current call environment has triggered a number of yellow and red alarms, as specified in the queue definition. You can configure red an yellow alarms for most numeric values that appear on screen - see the chapter Setting attention levels (Red and yellow alarms). You can also set sounds linked to yellow or red alarms, that will be played if a red or yellow alarm is present.
The "Add Member" button allows an administrator or supervisor to add an agent to a queue, as required. Users holding the RT_ADDMEMEBER key will be able to add agents directly from the Realtime page.
| In order to change the default audio files, see "Appendix D: System Preferences". If you want to turn them off completely, just set them to blank. |
| The top menu bar shown in the above picture has been replaced by a left menu panel since QueueMetrics 15.10. |
Since the release of QueueMetrics 15.09, the top panel contains a three bricks icon. Flying over with the mouse allows the user to select the report blocks will be shown in the realtime page. The number of available blocks is dependente by a set of configuration keys.
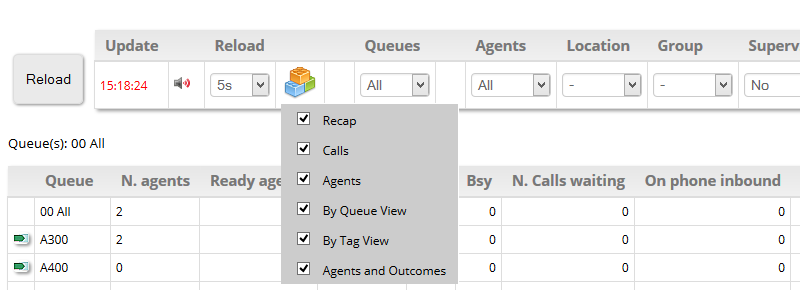
Thre three bricks icon has been replaced since QueueMetrics 15.10 by a checkbox list located on the new menu bar located on the left side, as reported below.
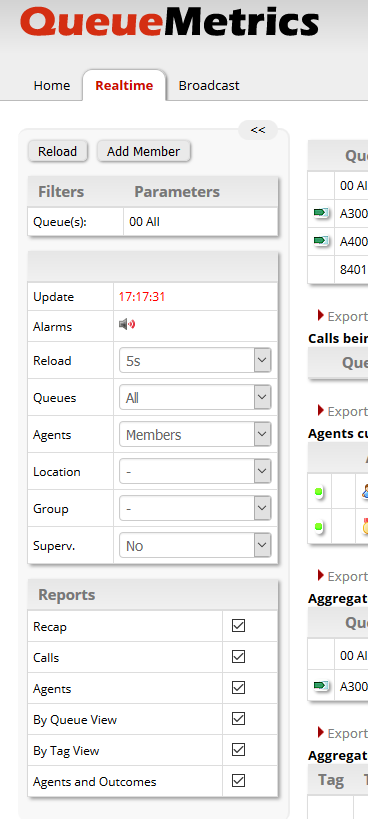
The menu bar can be optionally collapsed clicking on the << button to best fit realtime panel blocks.
Top status panel
The top status panel shows a quick status report for the current situation.
The first line shows information for all selected queues as a sum, while if there is relevant information for a specified queue it is displayed in a separate line. If an alarm is triggered for one of the numeric values displayed, the relevant cell turns either yellow or red.
The displayed fields have the following meanings:
-
Queue: The name of the queue. Inbound queues are marked with the symbol
 while outbound queues use the symbol
 .
. -
N. agents: how many agents are logged on to the system, in total
-
Ready agents: how many agents are ready to take calls, i.e. are logged on and are not in conversation or on pause
-
On pause: how many agents are currently on pause
-
Unk: how many agents are currently in conversation, but are not currently known as member of this queue
-
Bsy: how many agents who are both members of the given queue and some other queue are currently busy because they are on call on the other queue.
-
N. Calls Waiting: how many inbound calls are currently waiting in the selected queue. Outbound queues never have any call waiting.
-
On phone inbound: how many agent are talking on the selected inbound queue
-
On phone outbound: how many agents are talking on an outbound queue
Please note that, as agents are not linked to a specific queue save for the moment they are actually talking to a caller on the queue, the agent information is computed for all agents on the Asterisk server and not for specific queues, unless the "Members" option in the "Agents" dropdown is selected.
Calls being processed
A list of calls flowing through the selected queues is presented on the middle table. If no call is present the table is displayed empty.
When a call is processed, the following fields are shown: - Queue: the queue that is handling the call; - Caller: The Caller-ID, if available; - Entered: The date and time the call entered the queue system.
If the call is not answered yet, the "Waiting" field is displayed in red and is calculated according to the current date and time of the server. Depending on what type of information is present in the database (ATTEMPTS or RINGNOANSWER), is possibile to have information about the last agent not picking up the call or the actual ringing agent’s phone. The default configuration works with a standard Asterisk configuration and lets able to have RINGNOANSWER information. Please refer to Configuring Asterisk for QueueMetrics for the how to configure Asterisk generate ATTEMPTS information.
When a call is answered, the "Waiting" field tells the time that the caller had to answer; the "Agent" field shows the agent (or terminal) the caller is talking to and the "Duration", in red, is the current call duration.
If the call is ongoing and connected to an agent, moving the mouse on the wizard icon at the end of the line, some icons, like Call Monitor and VNC Monitor icons may be present. By clicking on one of these icons you activate the specified monitoring (see below).
If the call is ongoing and you have the special grants to do so, a red scissor icon might appear, moving the mouse on the wizard icon, to allow for brute-force call closure. See the section Closing ongoing calls for further details.
As soon as a call is completed or hung up, it exits the Calls panel.
This panel can be turned on or off through the "Calls" dropdown on the top of the page.
The "MOH" field shows the amount of time a customer is on hold with music, during a call. If multiple HOLD instances took place during the call, this filed will show the total "on hold" time.

As Asterisk does not natively provide Music On Hold events on the queue_log, you need to run uniloader with
MOH tracking enabled.
|
The "Srv" column is used only in cluster-based environments to tell you on which server the call is being handled.
The last field contains a "wand" that on mouse-over displays a drop-down menu which allows to perform the following actions:
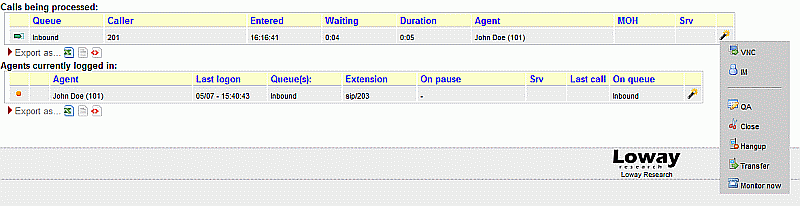
-
VNC: Monitor agents via a VNC remote session
-
IM: Begin an Instant Messaging session with an agent
-
QA: Access the QA Form for the specific call (must have the QA_TRACK key enabled)
-
Close: Close the call in the QM log, but not in Asterisk (must have the CLOSECALLS key enabled)
-
Hangup: Close the live call in the PBX (must have the RT_HANGUPCALL key enabled)
-
Transfer: Transfer the call to another extension (must have the RT_TRANSFERCALL key enabled).
-
Monitor now: Start a listen-in 'chanspy' Asterisk session (must have the MON_AUDIO key enabled)
To have precise realtime reporting a perfect clock synchronization is required. If your QM is on a different server, make sure the clocks are exactly aligned or you may see strange values in all fields. The NTP protocol offers excellent clock synchronization precision and is available on most operating systems.
Agents currently logged in
A list of available agents for all queues is displayed in this field. For each agent, the name, last log on and extension, if logged in via call-back, is provided.
A graphical indication of the status of each agent is shown using a coloured dot, where the following cases are possible:
-
Green dot: the agent is ready to take calls
-
Yellow dot: the agent is currently on a call
-
Red dot: the agent is currently on pause
This panel can be turned on or off through the "Agents" dropdown on the top of the page.
The Queue(s) field shows the queues an agent is logged on to. This is meaningful only for agents who log-in on a
queue-by-queue basis using the AddMember command in Asterisk. If an agent logs
on to all queues he’s enabled to work on, a small database
 logo may be shown, telling the viewer that the agent is linked to queues through the Asterisk’s configuration.
As the queue_log file usually contains no information on what queue(s) an agent is a member of, usually all agents are shown when they log on, no matter to what queue they will work on. This might be a problem for larger call centres, so it is possible to see only calls and log-ons of agents that are a member of the current queue. Membership is set by clicking on the "Agents" button of the queue settings page. Make sure your queue membership data is up-to-date before clicking this button!
If the "All" option was selected in the "Agents" dropdown , all agents logged in on Asterisk will be shown, no matter to which queue they belong. When "Members" is selected, instead, only agents defined for the selected queue will be displayed.
By turning on the property "realtime.show_incorrect_queue_sets", the Queues field will display each queue with a different color code:
-
in black: queues the agent is a known member of
-
in brown: queues the agent is currently working on but he’s not a known member of
-
as a down-arrow: queues the agent is a known member on but he’s not currently logged on to. In order to see the list of queues, fly over the down-arrow symbol with your cursor.
The On Pause field will contain the time the agent went on pause; if the agent is using a pause code to mark the reason for going on pause, the decoded pause code is shown as well. A switch can be used to show the pause start time either as an absolute hour or a time increment.
The Srv field will contain the server identifier for QueueMetrics running in cluster mode.
The Free Since field will contain the length of period since the last taken call.
The Last call and On queue fields show the start time of the last call the agent handled (which is latest) and on which queue the last call was. This can be useful to diagnose queue strategy problems that lead to unfair call distribution, or agents having problems with their telephones and therefore not taking calls correctly.
The IVR field shows the call time spent on the IVR process before the call enter in the queue.
Waiting time and Duration fields are related to the last call taken.
The "wand" icon mouse-over displays a drop-down menu which allows to perform the following actions:
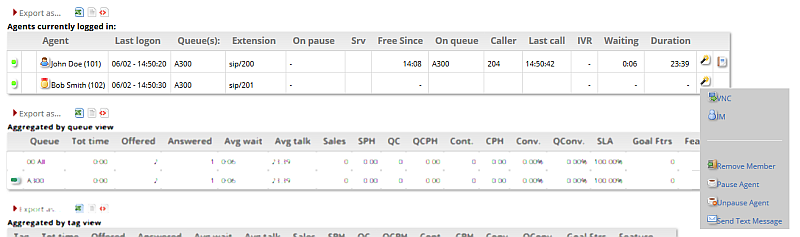
-
VNC: Monitor agents via a VNC remote session
-
IM: Begin an Instant Messaging session with an agent
-
Remove Member: Remove an agent from a queue (must have the RT_REMOVEMEMBER key enabled)
-
Pause Agent: Put an agent in a Pause state (must have the RT_PAUSEAGENT key enabled)
-
Unpause Agent: Un-pause an agent so he/she is available to take calls (must have the RT_UNPAUSEAGENT key enabled)
-
Send Text Message: Send a text message to an agent (must have the RT_SENDTEXTAGENT key enabled). The SMS functionality works only with asterisk 10+ versions.
The last icon is a direct link to reports. Clicking on this icon will run an historical report by populating the query with parameters similar to what generated the realtime panel results.
Since QueueMetrics 16.10.17, a new optional field is available for the Agents Currently logged in table. This field is called Paused For and it shows the elapsed time of ongoing agent’s pauses. To enable this field one needs to enable the realtime.relativePauseTimes System Preference. See Appendix C: System preferences.
Since QueueMetrics 18.04.3 a new field is available, named "Since". This field is located right next to agent status colored icon. The number of seconds listed in this field represents the time that has elapsed since the agent entered it’s current state.
Aggregated by queue view
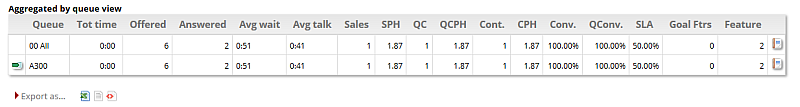
This block reports realtime figures related to each selected queue. All values are aggregated by queue except for the first row where calls for the whole selected queue set is reported. On each column a user could find:
-
An icon representing the queue direction (inbound/outbound)
-
The queue name
-
The total call time
-
The number of calls sent to the queue
-
The number of answered calls
-
The number of lost attempts
-
Average wait time for all calls in the queue
-
Average talk time for answered calls
-
Number of calls marked as sales
-
SPH: Sales per hour figure
-
Number of calls marked as qualified contact
-
QCPH: Qualified contacts per hour figure
-
Cont: number of calls marked as contact
-
CPH: Contact per hour figure
-
Conv: convertion ratio
-
QConv: qualified conversion ratio
-
SLA: percentage of calls matching the SLA time configured for the queue
-
Goal Ftrs: number of goal marked feature codes found in the call set
-
Feature: number of feature codes found in the call set
By clicking on the last icon, a user can start an historical report with query parameters matching the realtime page parameters that generated the selected row.
Aggregated by tag view
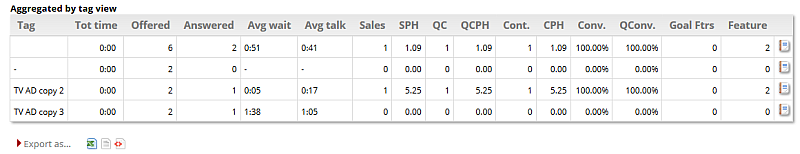
This block reports realtime figures related to tags associated to processed calls. All values are aggregated by tag except for the first row, where calls for the whole tag set is reported, and the second row, where only calls with no tag are counted. On each column a user could find:
-
Tag name (empty for all call set, dash for calls with no associated tags)
-
The total call time
-
The number of calls with associated tag
-
The number of answered calls with associated tag
-
The number of lost attempts for calls with a tag
-
Average wait time for all calls with associated tag
-
Average talk time for answered calls with associated tag
-
Number of calls marked as sales with associated tag
-
SPH: Sales per hour figure
-
Number of calls marked as qualified contact with associated tag
-
QCPH: Qualified contacts per hour figure
-
Cont: number of calls marked as contact with associated tag
-
CPH: Contact per hour figure
-
Conv: convertion ratio
-
QConv: qualified conversion ratio
-
Goal Ftrs: number of goal marked feature codes found in the call set
-
Feature: number of feature codes found in the call set
By clicking on the last icon, a user can start an historical report with query parameters matching the realtime page parameters that generated the selected row.
Agent and outcome view
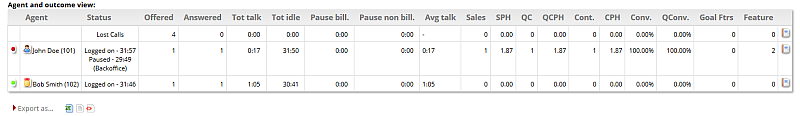
This block reports realtime figures related agent sessions and calls. All values are aggregated agent except for the first row, where lost calls are shown. On each column a user could find:
-
Agent status icon
-
Agent name
-
Agent status explained (Logged on time, pause status, pause time, pause code)
-
Offered call number (that is: all calls received by the agent plus any outbound call they made)
-
Answered call number (that is: all calls received by the agent plus any outbound call they made that was answered)
-
Lost attempts to that agent
-
Total talk time
-
Total idle time (counted as session time purged from talk and pause time)
-
Billable pause time
-
Non billable pause time
-
Average talk time
-
Sales: number of calls markes as sale
-
SPH: Sales per hour figure
-
Number of calls marked as qualified contact
-
QCPH: Qualified contacts per hour figure
-
Cont: number of calls marked as contact
-
CPH: Contact per hour figure
-
Conv: convertion ratio
-
QConv: qualified conversion ratio
-
Goal Ftrs: number of goal marked feature codes found in the call set
-
Feature: number of feature codes found in the call set
By clicking on the last icon, a user can start an historical report with query parameters matching the realtime page parameters that generated the selected row.
Using Locations
You can also assign each agent to al Location, i.e. a group of agents working together that you want to monitor as an unit. They might be a supervisor’s team, or people working in the same building, or maybe in the same location for big multinational call-centres. This way you can avoid being cluttered with information about all agents working on the selected queue(s)and only see those you are actually interested in.
Note that when you filter by agents or locations you may see calls being queued and then disappear. This happens because all calls that wait to be answered on a queue are shown, but answered calls are shown only if the answering agents is a member of your defined filter conditions.
Imagine you have two groups of agents, one working in NY and the other one in LA. You are the supervisor of the NY group, so you are filtering by location. You see a call entering your queue and then disappear. The reason why might be that it was answered by someone in LA, so QueueMetrics filters it out for you.
It is also possible to have QM ask for a location to be selected in any case for Real-time reports. As locations can be key-protected, this is a handy way to determine which agents can be seen by which supervisors. In order to enable this feature, you must set the realtime.assignedLocationsOnly property. When this is set:
-
When a user enters the real-time screen, the dash that means "Any location" is not shown anymore and the first location they have the grants to see is be selected.
-
If a user has no grants to see at least one location, an error message is raised and they are not able to enter the real-time screen
Unattended call and VNC monitoring
It is possible for you to set up both Unattended Call Monitoring and VNC Monitoring.
Unattended Call Monitoring makes it possible to listen to an ongoing call from an agent; by clicking on the small telephone-shaped icon, that will appear moving the mouse under the wizard icon, a popup will be shown where you may enter your current extension or PSTN telephone number.
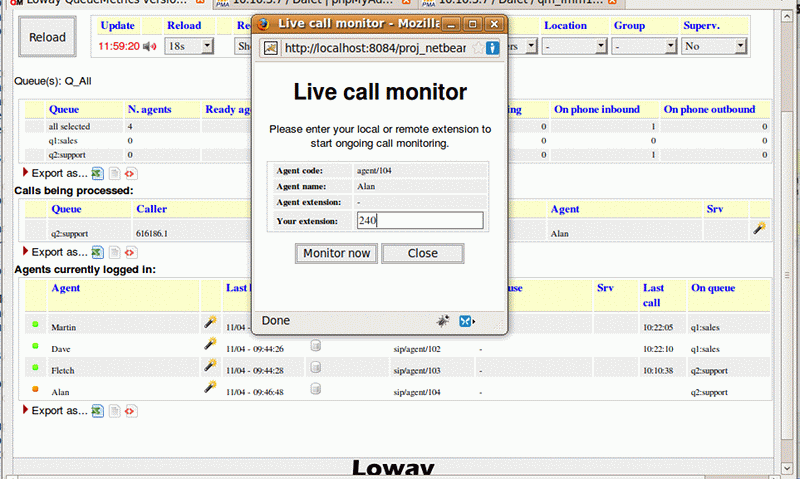
As soon as you confirm the entered data, your telephone will ring and you will start listening to the ongoing call between the selected agent an the caller.
Depending on the kind of PBX platform you run, you may have one or more of the following options:
-
'Spy': listen to the call, without interacting with it
-
'Whisper': you can listen to the call and speak to the agent; the caller will not hear the conversation
-
'Barge': you can "break in" into the call and be on a conference with both parties
In order to set up this behaviour, please see the section Listening to live calls: Unattended Call Monitoring. It is possible to use different PMs to handle different audio needs - see Listening to calls using Pluggable Modules (PM).
It is also possible to set up the system in order to allow the real-time monitoring of the agent’s screen using VNC. If this feature is enabled, a small screen will appear close to the agent’s name; by clicking on it, your selected VNC application will be launched and you will be monitoring the agent’s screen.
In order to set up this behaviour, please see the section Enabling VNC Monitoring of this manual.
Real-time performance considerations
Running a large set of real-time pages / agent pages / wallboards may impose a significant burden on a QueueMetrics system. But sometimes you have no choice. The best way to run them is to:
-
Set the beginning of the analysis to the minimum usable time. For example, QM usually runs the real-time report since the last midnight, but sometimes a sliding window of (say) 8 hours might be equally effective in your scenario and require a fraction of the load. You control this by setting the
realtime.startHourproperty -
Tune Java memory for maximum performance - see the Advanced Configuration manual.
In order to further reduce the load above, since QM 23.09 there is a new unified architecture (codenamed Presentialist) that aims to keep an up-to-date picture of the whole system and just send a snapshot to all interested parties. So, for example, an agent page and a real-time page sending in a status request at the same time would share the same underlying analysis.
This usually works seamlessly, but there is an important limitation - as all
calls are processed no matter on which queue they appear to be on, if the same call is erroneously
tracked multiple times (e.g. by a queue and by the Uniloader outbound tracker), the resulting logs happen
to be unreadable. In order to bypass this issue, a new property realtime.ignoredQueues was introduced -
it lets you blacklist a set of queues for display on real-time/agent-page/wallboard.
| You can still run a report on any queue or queues you blacklist, but they won’t be considered for real-time. |
On older systems, you may also want to make sure that you are using the following defaults:
-
Use SQL or CLUSTER storage types
-
Turn on row caching - this allows QM to keep cached and pre-processed copies of objects it needs to run the Real-time and Agents Page. This may offer a significant speed up, ofter by an order of magnitude, and will reduce database load. You turn on this feature by setting 'realtime.useRowCache' to true.
The real-time live page
| This feature is deprecated. |
The real-time live page can be accessed by clicking on the "Live" tab next to the "Realtime" tab.
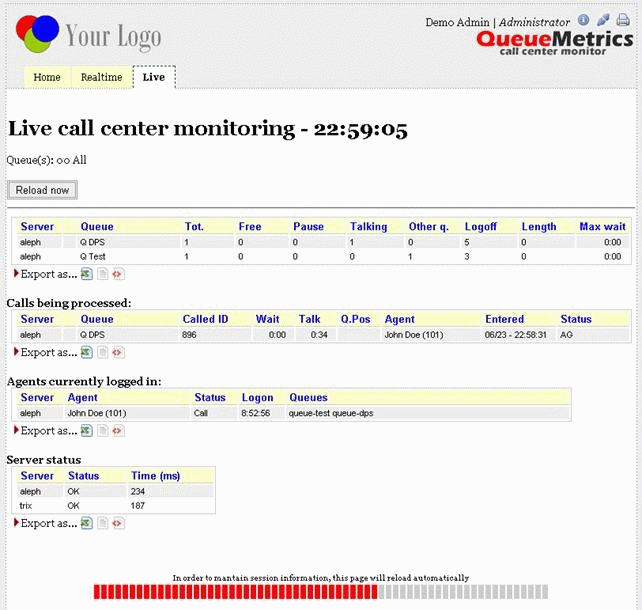
This page is not built from the queue_log data as all other information reported by QueueMetrics, but it' s read right from each Asterisk box’s Manager interface. So what you see in this page is the status of each Asterisk box, as reported by itself.
This feature is still less developed than the Realtime page, but still can be pretty useful.
The top panel
On the top panel, for each queue on each server, you will see the following pieces of information:
-
Tot: the total number of agents available for this queue
-
Free: the number of free agents
-
Pause: the total number of agents on pause
-
Talking: the total numbers of agents who are in conversation at the moment
-
Other q.: the number of agents that are logged in to this queue and some other queue, and are at the moment busy on another queue.
-
Logoff: the number of possible agents that are defined for this queue but are not logged on at the moment.
-
Length: the current queue length, i.e. how many calls are waiting in line before being connected to an agent
-
Max wait: the current maximum wait time for this queue.
Calls being processed
In the calls panel you see the following pieces of information, sorted from oldest to newest by call start-time:
-
Server: the server that is handling this call
-
Queue: the name of the queue
-
Caller-id: the caller-id of this call, if any
-
Wait: the wait time (if the call is not connected)
-
Talk: the total duration (if the call is connected)
-
Q.Pos: the queue position (if the call is waiting)
-
Agent: the agent handling this call, if connected
-
Entered: the time this call was queue
-
Status: the call status
-
Info: contains all the Feature Codes, Variables, Call Tags, IVR choices if present.
The Wait and Talk times cannot be distinguished at the moment.
Agents currently logged in
In the agents panel you can see the following pieces of information:
-
Server: the server your agent is logged on to
-
Agent: the agent
-
Status: if the agent is free, paused or on call
-
Logon: the time this agent logged on
-
Queues: to which queues is this agent connected at the moment
Server status
The last panel details the status of each server making up the cluster. If a server is not correctly set up, it will appear as KO.
-
Server: the server that QM is polling
-
Status: OK - the server answered correctly; KO - it was impossible to retrieve information from this server
-
Time: how much querying this server took. If this value goes up all of a sudden, your server is likely experiencing overload.