Report Page
Since QueueMetrics 20.10, the new ReportPage has been introduced.
The new Report Page offers a wide variety of functions, that allow the user to create, customize, publish and share their own report.
What is a Report?
In QueueMetrics a Report is a collection of different pages, each one containing a variable number of DataBlocks.
Unsaved vs Saved Reports
A newly created or cloned report will begin its life in the "Unsaved" state. You can easily spot when a report is Unsaved, because the report title will be "Unsaved Report".
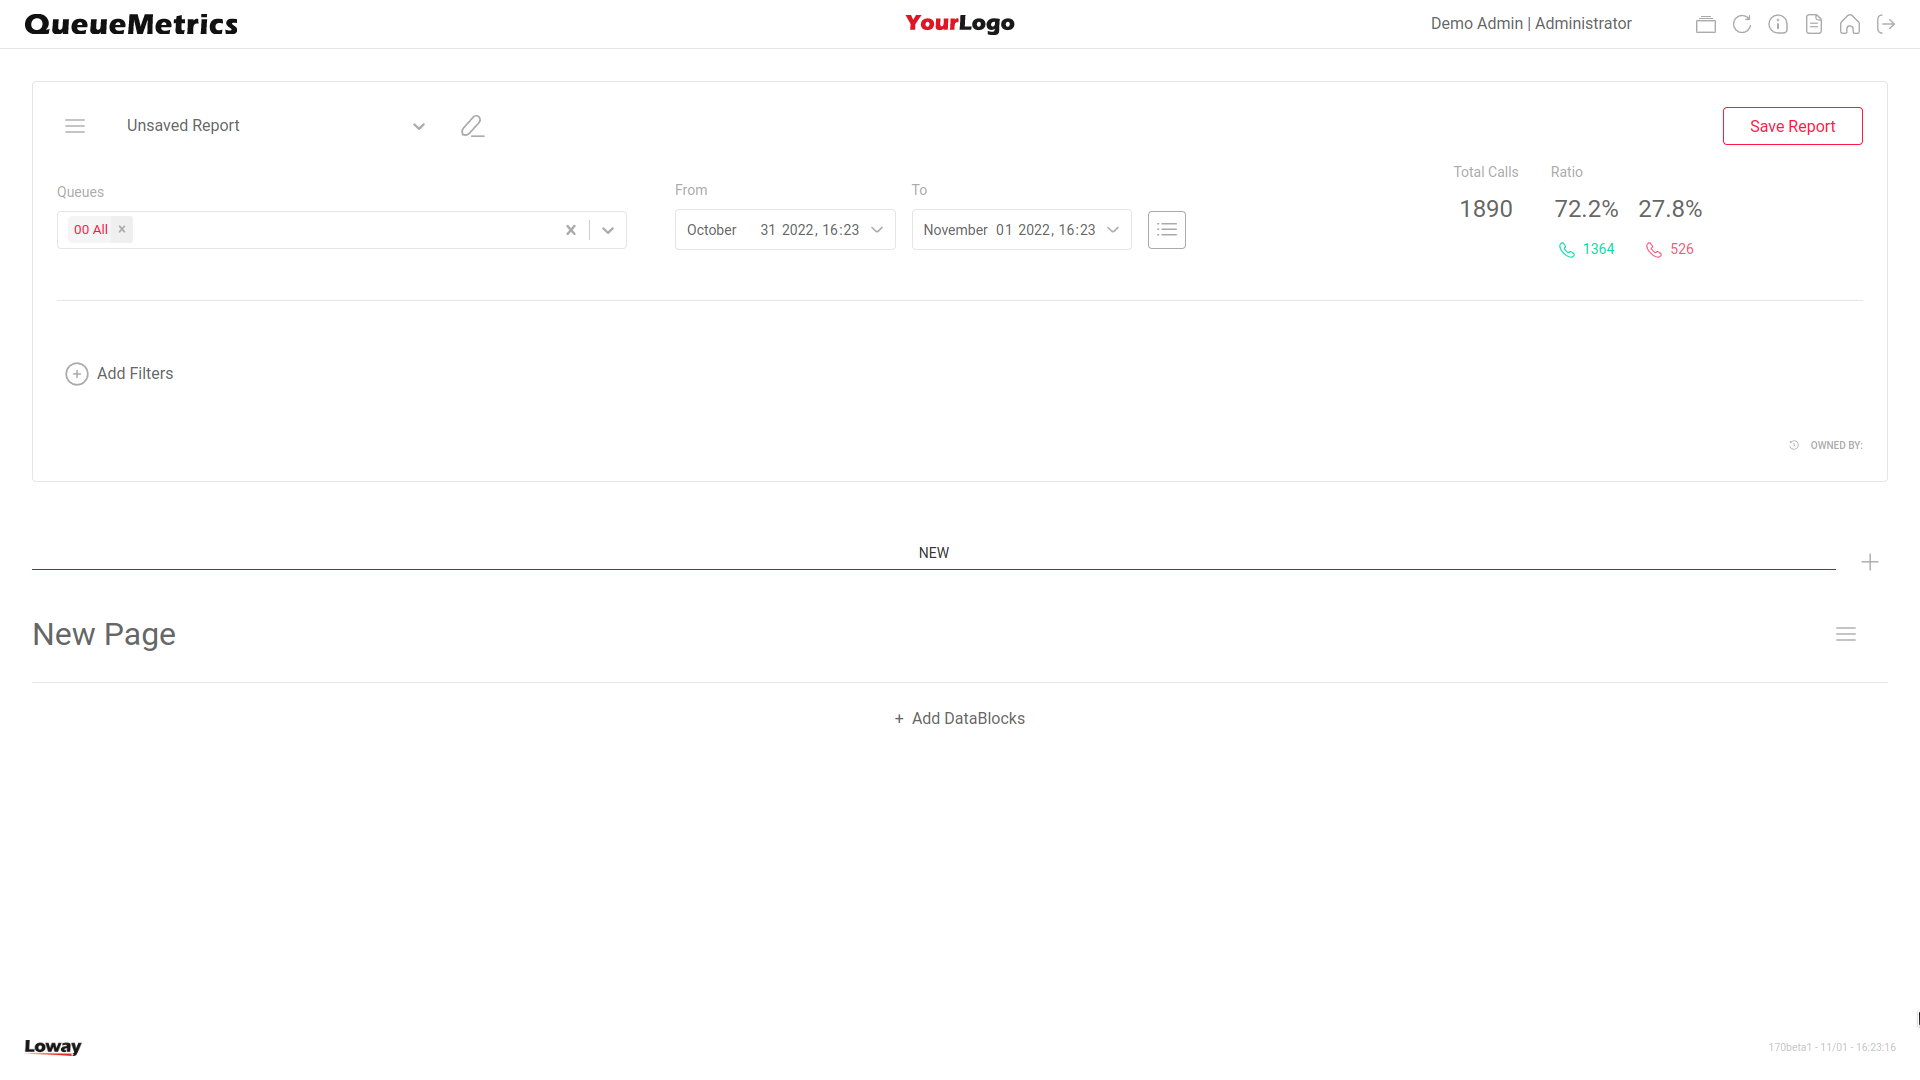
After making changes to the Unsaved Report, a Save Button will Appear in the top right that needs to be clicked in order to save the report. If the button is clicked, the user will be prompted to input a name for the Report.
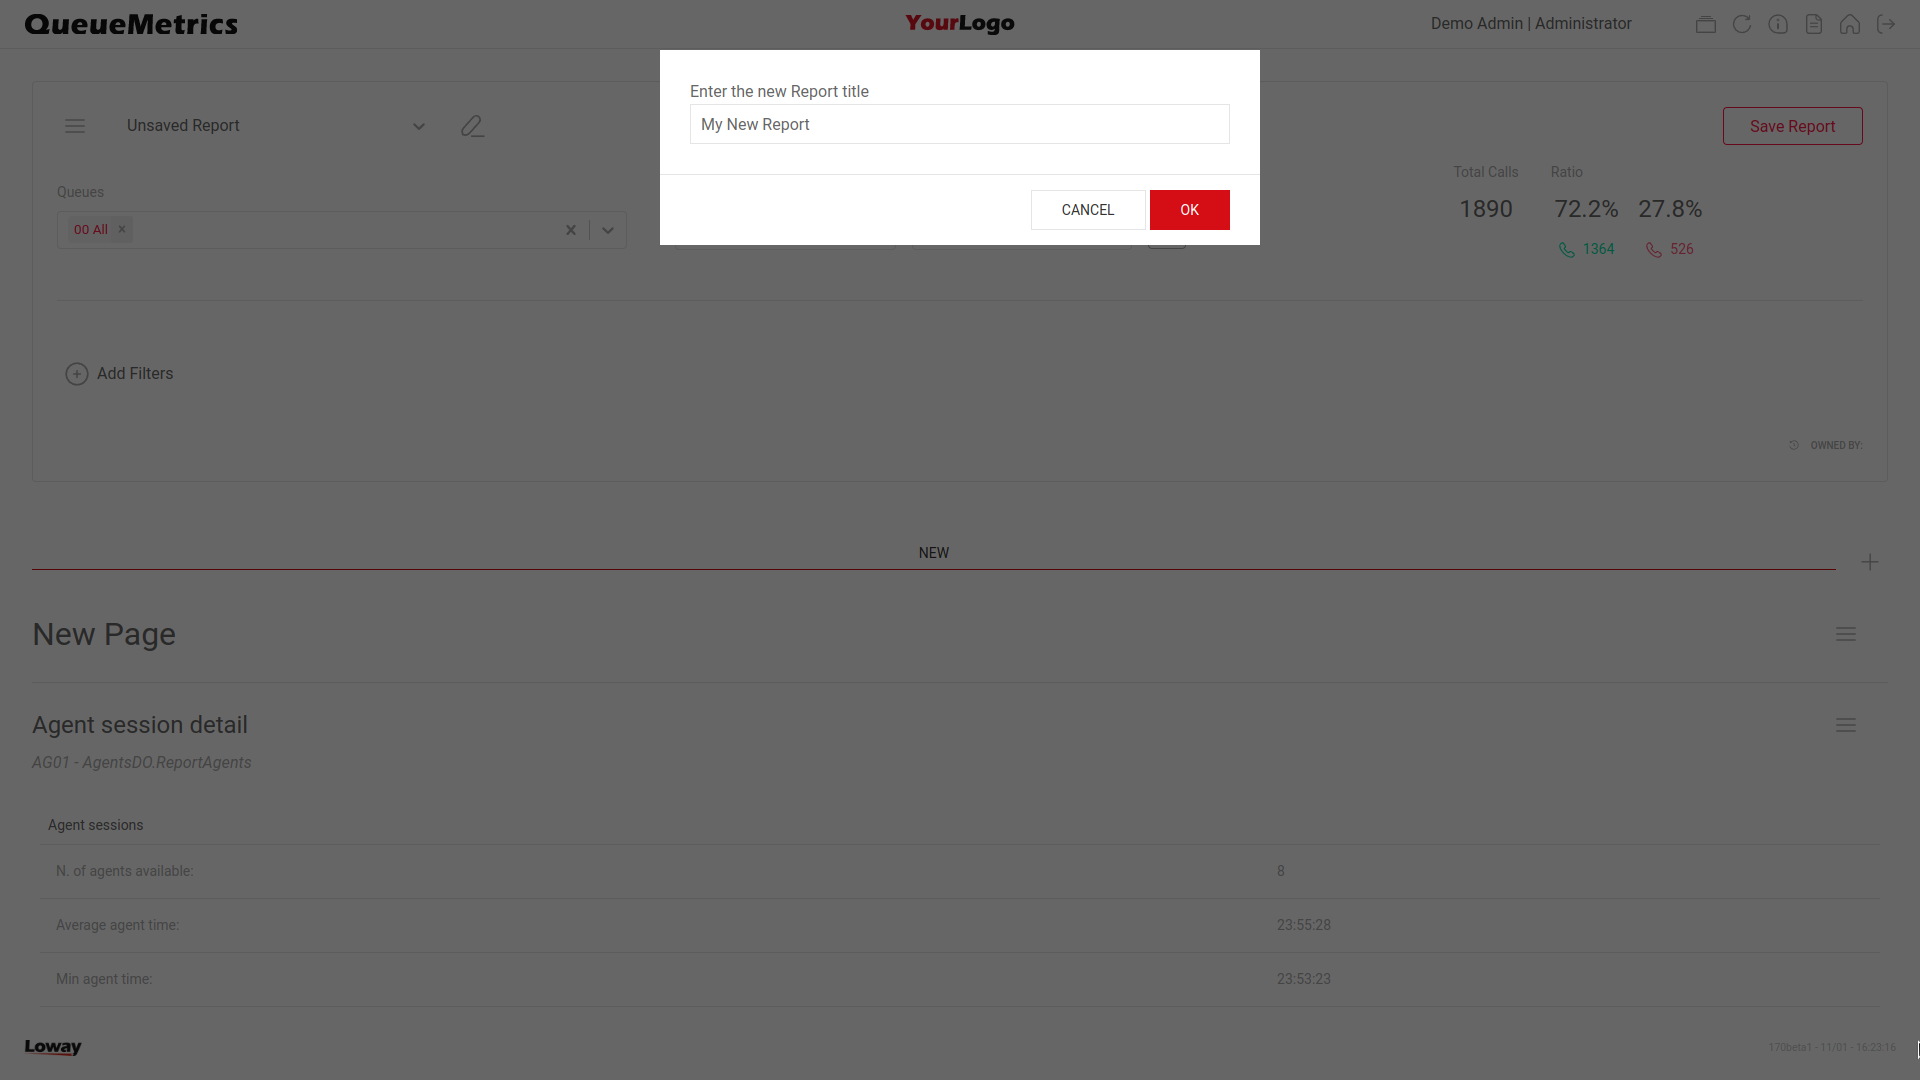
Once a report is saved to the system, the user can still edit it as per usual, but now the report will be accessible even after exiting the report page. If you leave the report page before saving a report - a system popup will warn you when you leave - the report you were working on will be lost forever.
| You cannot export nor share an Unsaved Report. |
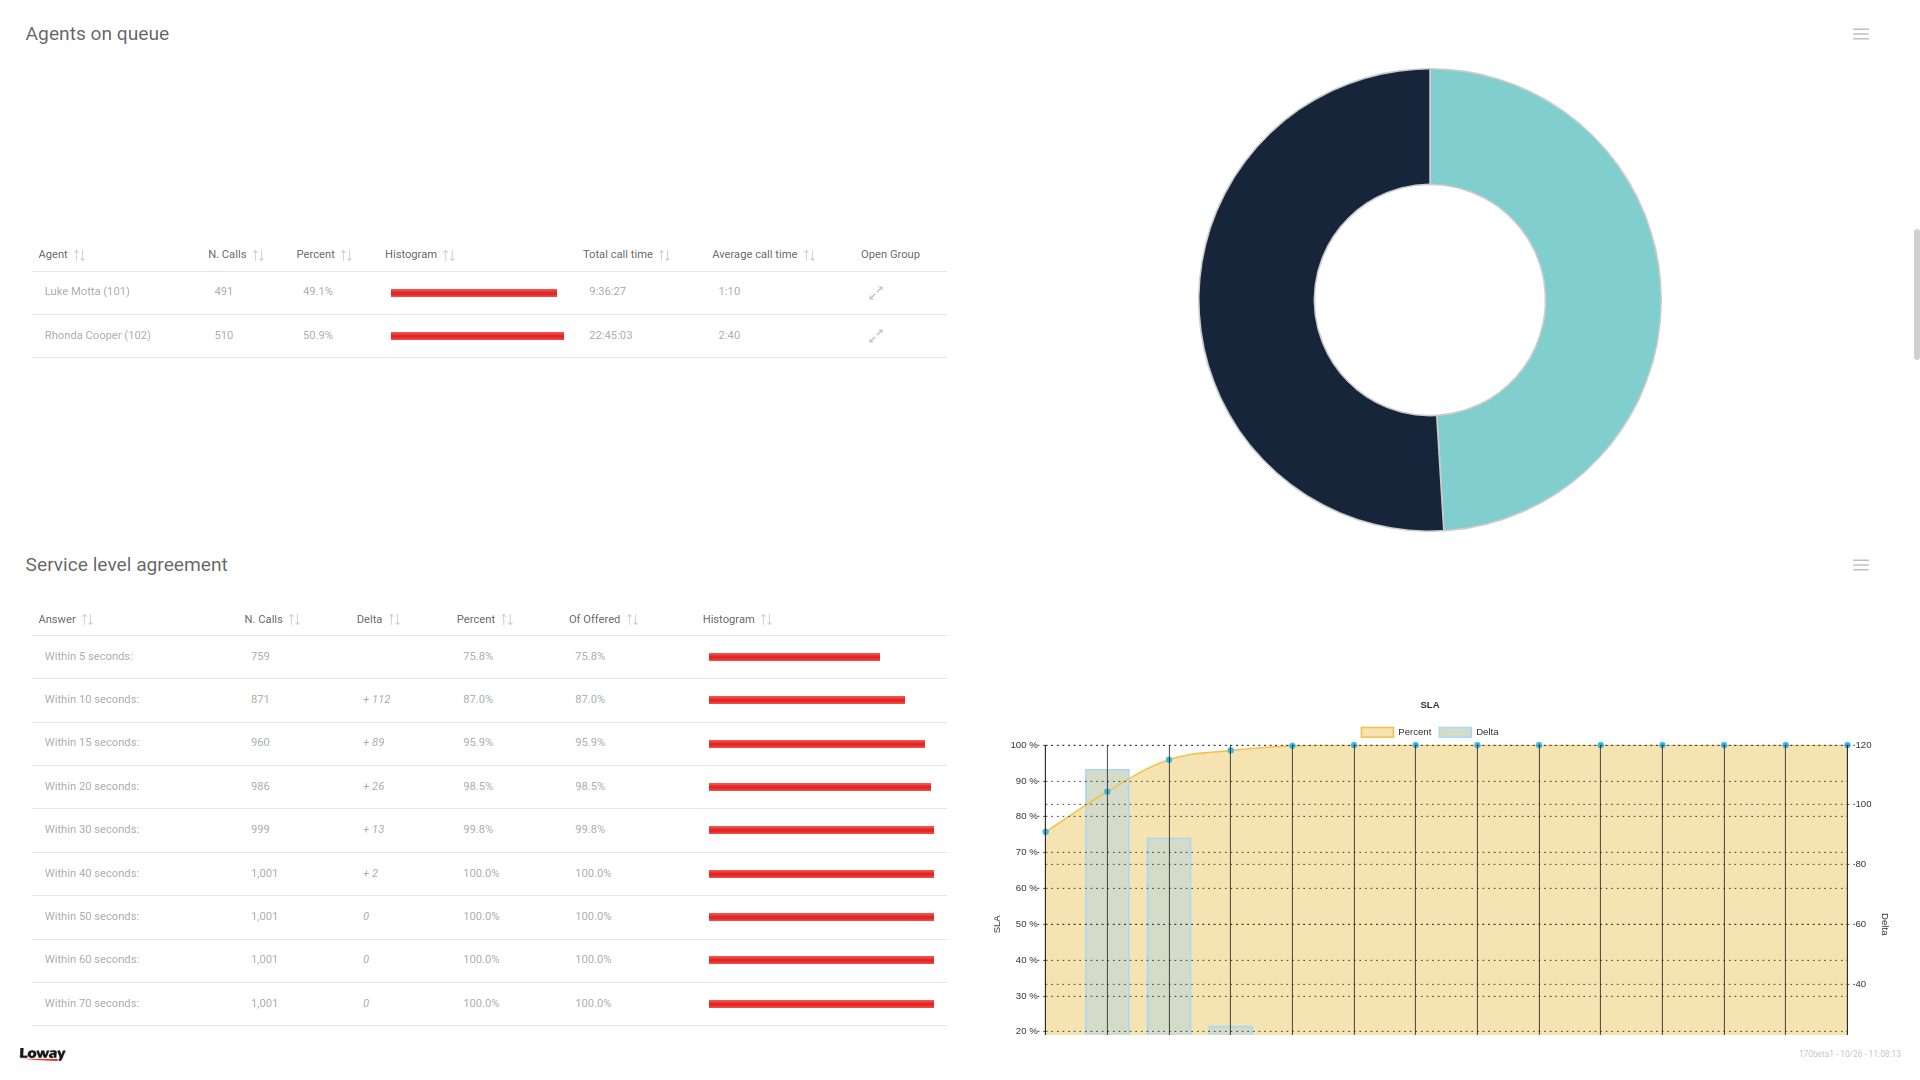
DataBlocks
A DataBlock is a block of information with a Title, a Subtitle, a Table and possibly a Chart.
QueueMetrics offers 150+ different DataBlocks, each with unique information and metrics. When building a report, the user will pick and choose the DataBlocks they are interested in, and add them to the current report. In doing so, the user is able to create a Report that perfectly matches their needs.
Users can access report that are created by them, or public reports created by other users, provided they hold the necessary security keys.
Pages
Each Report can contain any number of pages. The user can navigate through pages by clicking on the various tabs that are shown at the beginning of the page.

To create a new page, the user can click on the "plus" icon on the right
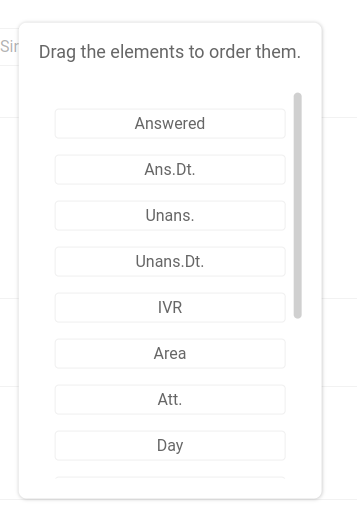
To edit the page order, the user can click on the Edit Tabs Order Icon next to the plus icon
This will open a panel where the user can drag and drop the Page names to reorder them
Icons
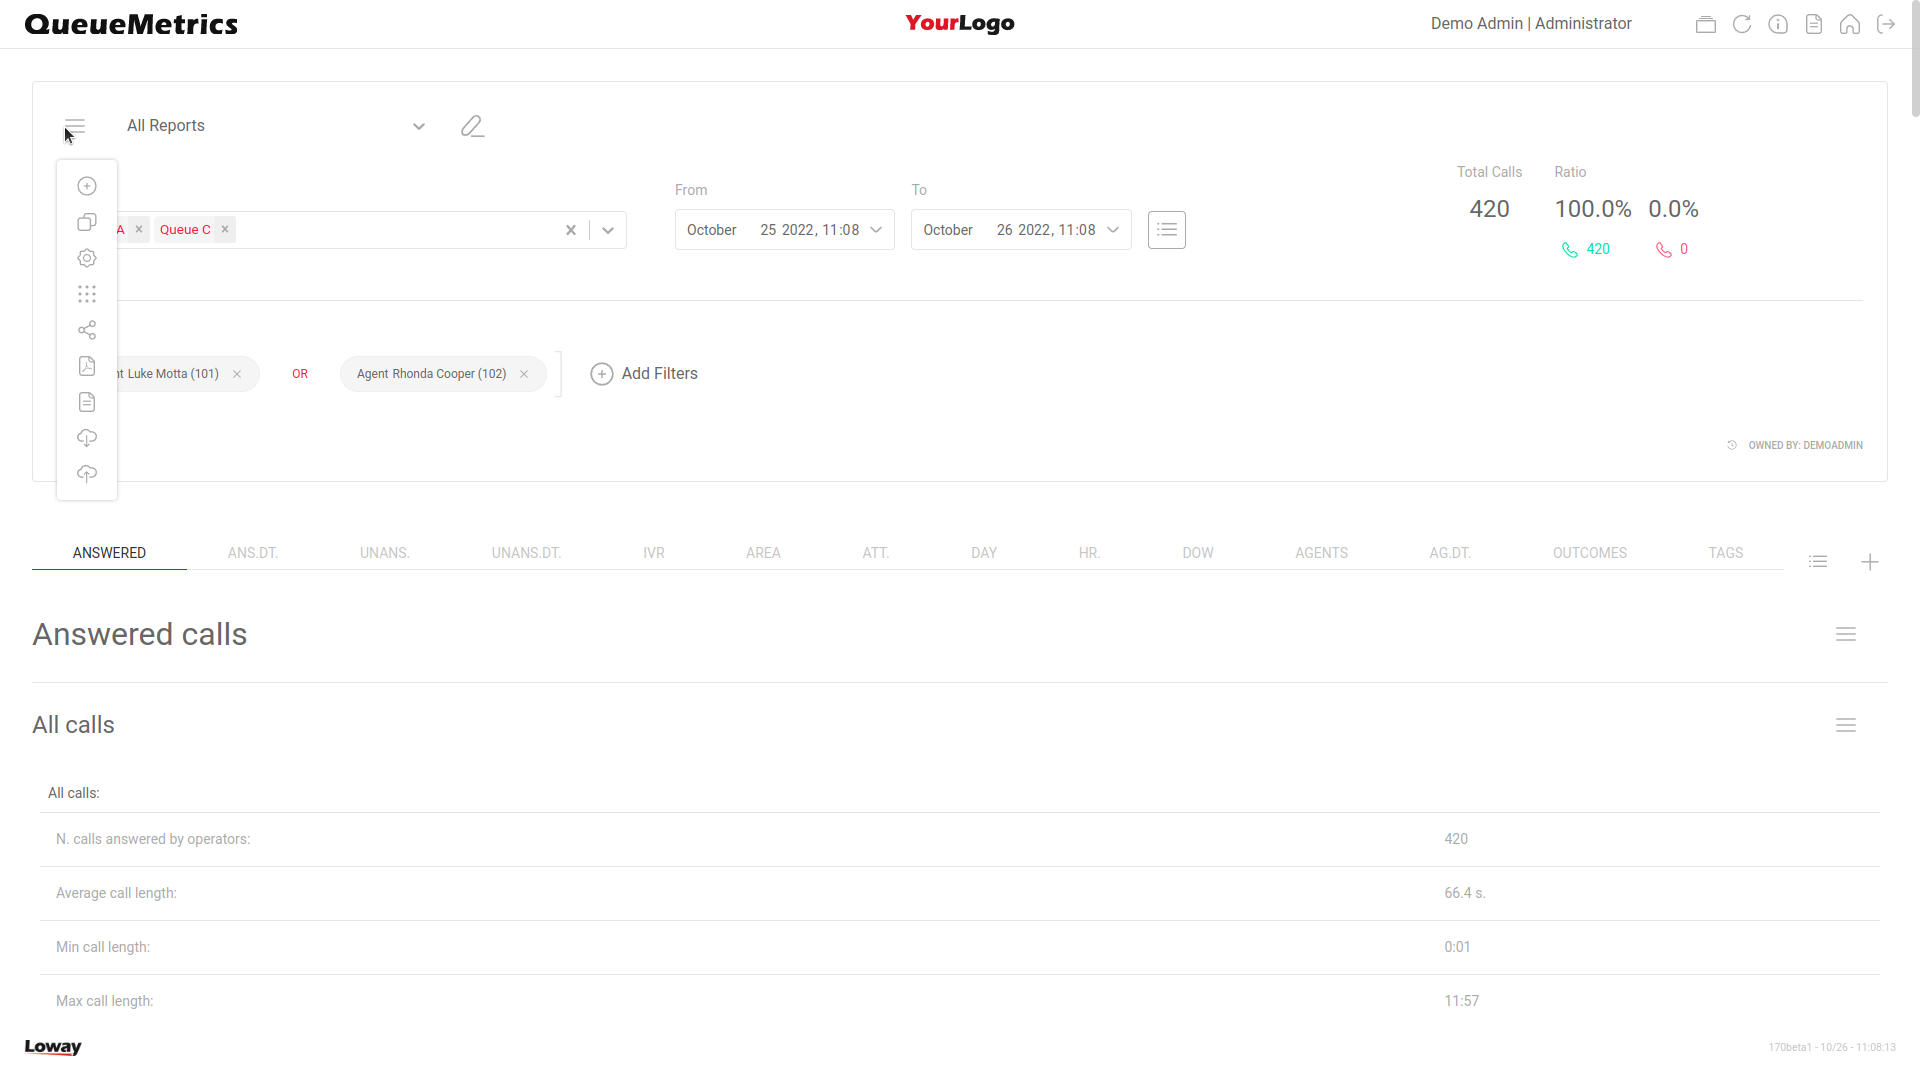
In the top left section of the screen, the user has access to a menu containing a series of icons, that allow for different actions to be performed.
Create Report
The "Plus" Icon, if clicked, prompts the user to input a name for a new report to be created. If clicked, a new report will be created with one empty page.
Export Report Schema
The "Download" Icon will export the current report in JSON Format, so it can be imported in a different QueueMetrics instance.
Import Report Schema
The "Upload" Icon will prompt the user to pick a QueueMetrics report schema (Exported from this QueueMetrics or another instance), to import it. The QueueMetrics report schema file should be in JSON Format.
| if the report contains some custom DataBlock that are not present on the importing QueueMetrics instance, QueueMetrics is going to follow this process: |
A) Look for a Custom DataBlock with the same ID. If it exists, go to step B. If not, go to step C. B) Checks if the existing DataBlock is the same as the one from the other system If so, it keeps it, if not, go to step C. C) Creates a new DataBlock with the same properties as the one on the old system. If the ID is already in use, it creates a new one.
| If you are looking for an automatic way to export a full analysis to one file, you should probably have a look at Automating statistics download: the ROBOT profile. |
Share
The "Share" Icon will copy a shareable link to the current report, in the user’s clipboard. This URL, if navigated to, will prompt an unauthenticated user to access QueueMetrics, then redirect him to the current report. If the user is already logged in QueueMetrics when he navigates to the link’s destination, then he will open the current report directly.
Filter Recap Panel
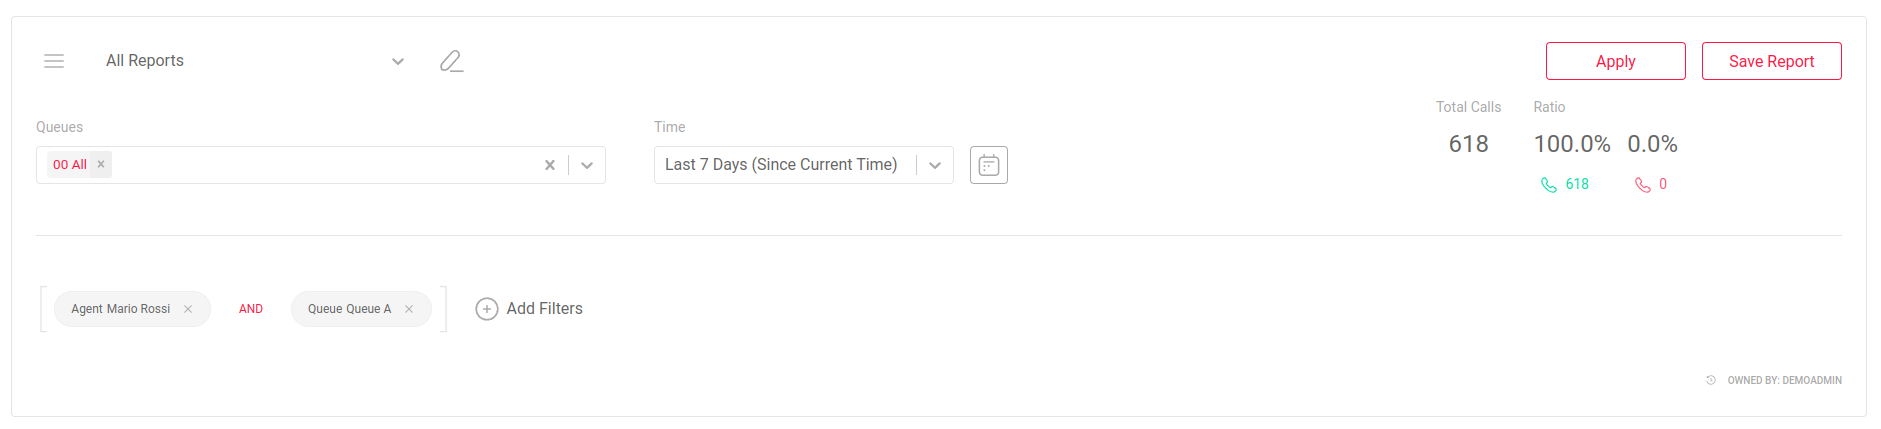
The area at the top of the Report Page, is the Recap Panel, that offers immediate insights about the current report and the applied filters.
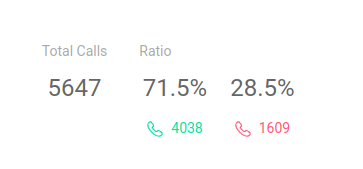
Call Stats
The right section shows the number of taken, lost and offered calls, together with their percentage ratio. They also show the number of process calls in the report.
Selected Report
The left section shows the name of the currently selected report.

The user can change report by using this menu and selecting one of the available reports.
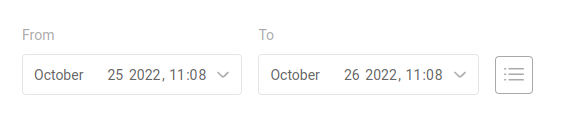
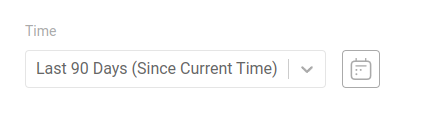
Time Period
Finally, a time selector allows the use to change the time period the report is considering when analyzing data. The user can pick a date range or a preset time period. To switch between time selection modes, the user must click on the calendar icon.
If needed, the maximum allowable time period for reports can be set system-wide and then overridden on a user-by-user basis - the default is that any user can run reports of any length, but this can be changed by the administrator. See Maximum reporing period for further details.
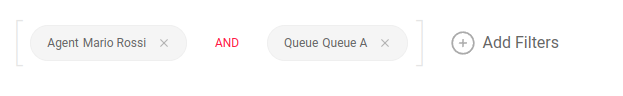
Filter Expression
If a filter expression is set for the report, it will appear at the bottom of the Recap panel.
Rename Report
To rename the current report, the user can click on the edit icon next to the report name
This will make the Report Name editable for the user.

Here the user can confirm the changes by clicking on the confirm icon or delete the report.
Delete Report
To delete the current report, the user can click on the delete icon instead of the confirm icon, when editing the Report Title
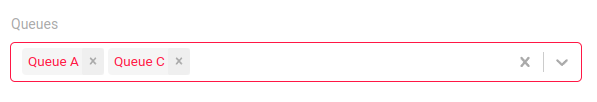
Change Queues
To change the queues to consider for the current report, the user can use the following menu. More than one queue can be selected at once.
Save or Apply
When the user makes some changes to the report, two buttons will appear in the top right of the screen. These are the Apply and Save button.
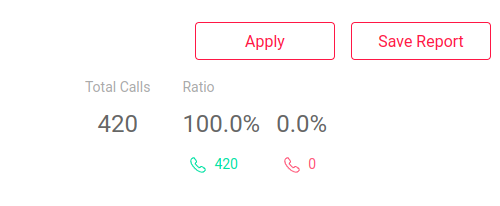
Clicking on the Apply button will apply the new changes to the report, and recalculate the report with the new parameters and filters. This will however not save the report.
Clicking on the Save button will first save the new report parameters and then recalculate the report, exactly as if the user had pressed on the Apply button.
Add/Edit Filter Expression
To further filter the current report, the user has access to an entire list of different filters that can be applied. These filters can be combined in an infinitely complex expression, that offers granular control over the data included in the current report.
To add a filter to the filter Expression, the user must click on the "Add Filter" button next to the current filters, at the bottom of the Recap Panel.
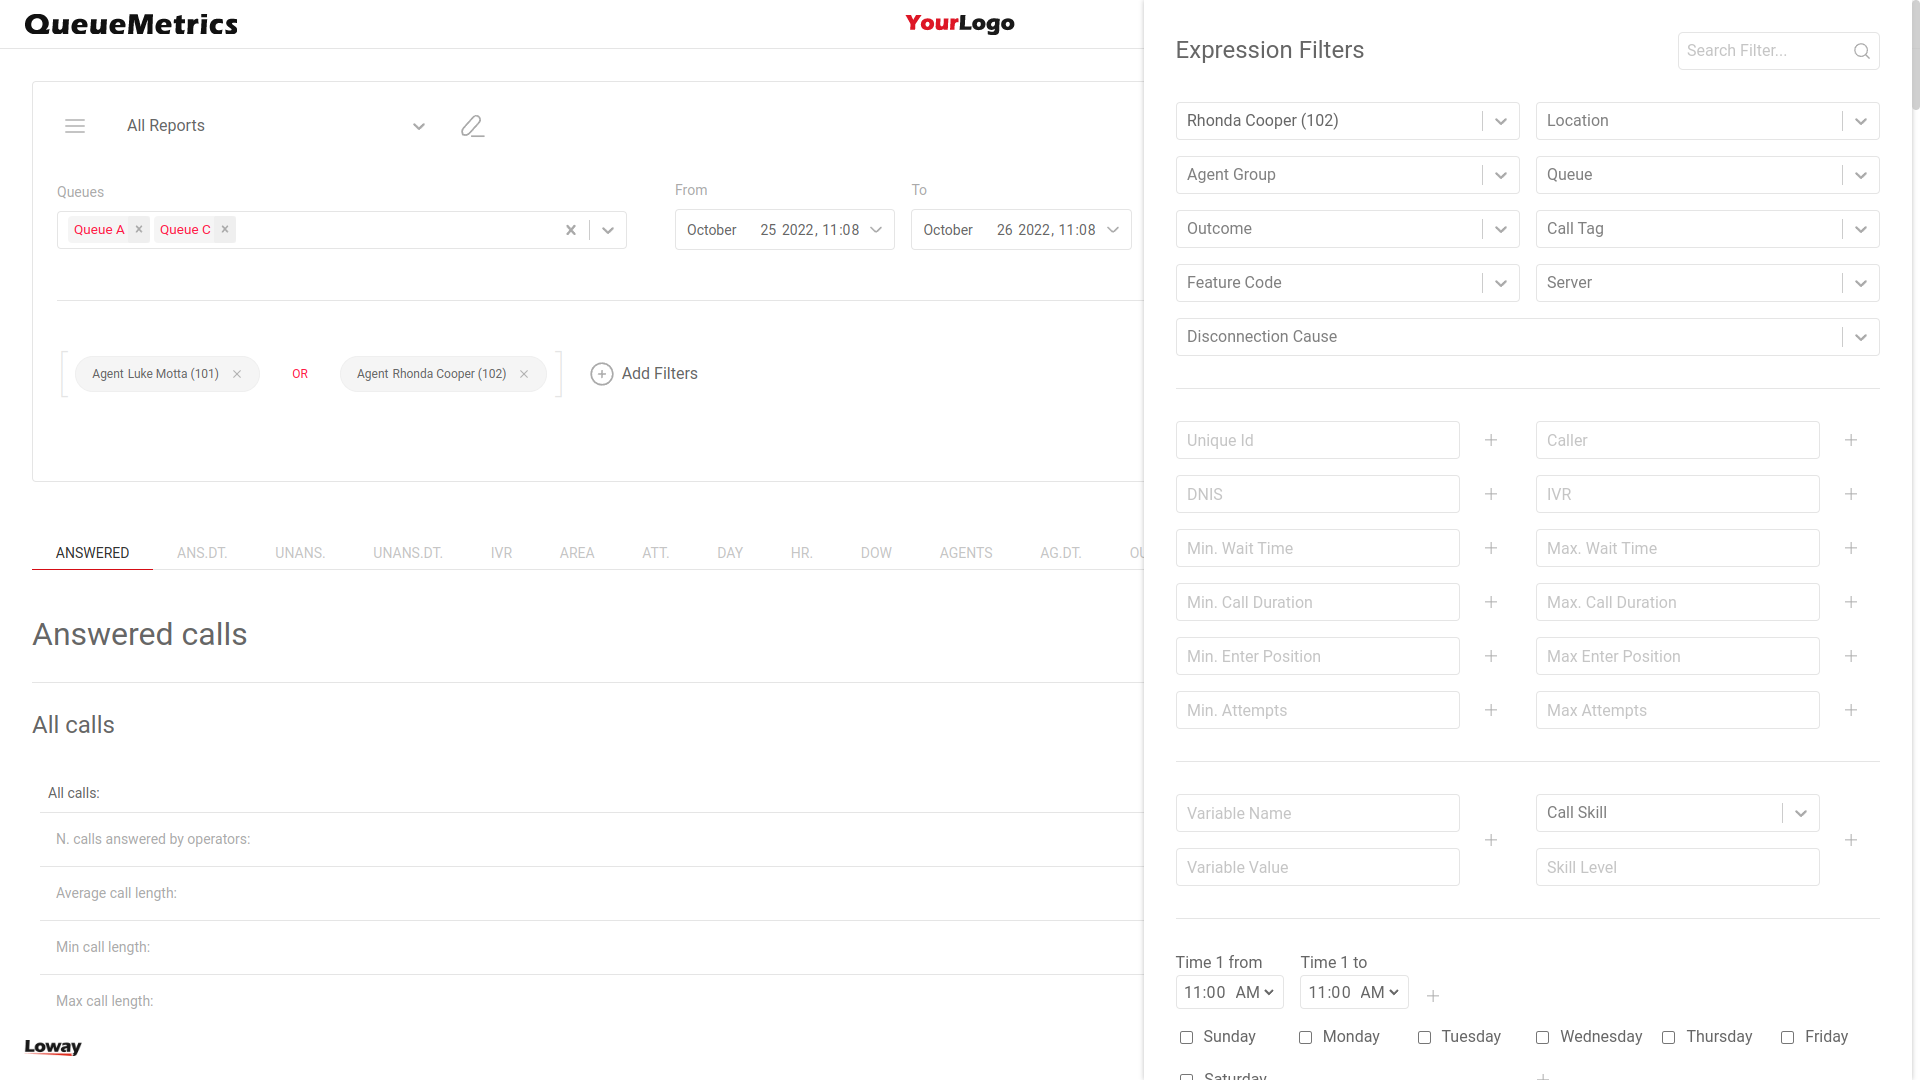
This will open the Filters Collection panel, where the user can add filters to the current report.
To easily access the desired filter, the user can use the search bar at the top.
Once the user inputs a new filter, it will appear in the Report’s filter expression.
Here, the user can add as many reports as they want, and combine them together with operators.
Type of filters
There are three types of available filters in the Filter Collection Panel.
Combo Filters
These filters show the user a series of options, and the user can only select one of the options. The user can search through the available options by typing a string with the menu open. This will filter the options to show only options containing the inputted string. An example of this type of filter is the "Agent Group" filter.
Combo Filters with Creatable Options
These filters are similar to Combo Filters, as they show the user a series of options and are searchable. The only difference is that if while inputting a string to filter the available options, no available option matches the inputted string, the user will be presented with an option to create a new option from scratch, with the inputted string as value. The Agent filter is an example of such filter.
Text Filters
These filters are simple text boxes that accept a value inputted by the user. Depending on the filter some values might not be valid. When the user inputs a value and the value is a valid value, a "plus" icon will appear next to the filters that needs to be clicked to add the filter to the expression.
Filter Expression
For more iformation about the available filters, please consult Call filtering criteria.
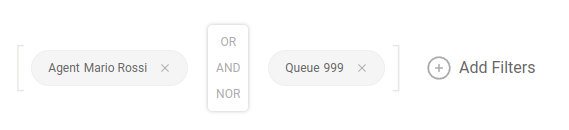
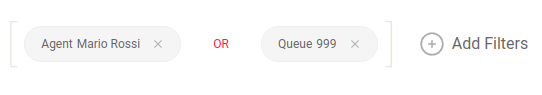
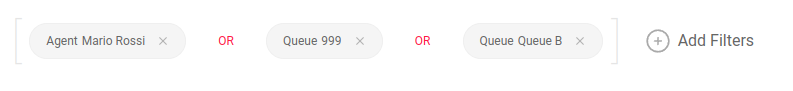
Add Filters
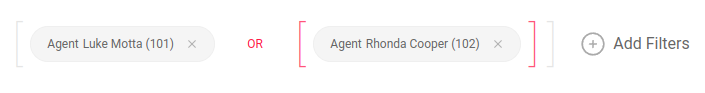
When a filter is selected, it is then added to the filter expression, at the botton of the Report Editing Panel

More than one filter can be added at once. They will be joined with the "And" operator by default.

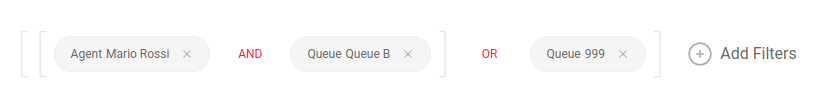
Change Operator
By clicking on the operator, the user can change the operator for the entire group of filters.
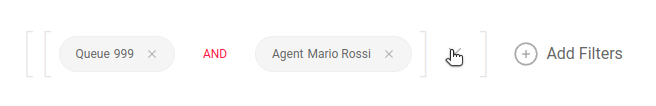
Deleting a Filter Group
The user can delete a Filter Group by hovering over a closing parenthesys with the mouse (or keeping it pressed while on mobile) and then clicking on the "cross" icon that appears.
Editing a Filter
Clicking on a filter’s value will open the Filter Editing Panel, where the user can edit the value of the current filter.
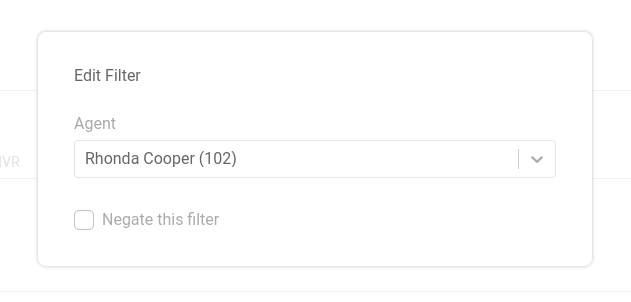
Negating a Filter
In the Filter Editing Panel, by clicking on the "Negate This Filter" checkbox, the user can negate a filter. If, for example, a report is filtered by Agent 101, by negating the filter, the report will show all agents except Agent 101.
| Negating a filter effectively means that the filter is in a NOR group by itself. If another filter is dragged on top of a negated filter, the two filters will be grouped in a group with the NOR operator between them. |
Editors
The Report Page offers different editors to allow the user to customize Pages and DataBlocks.
Page
To the right side of a Report’s page, you will find a drop-down menu that allows you to Edit, Delete, Print or Reorganize your report page.
![]()
By clicking on the Delete icon, you will delete the current page, after confirming your choice.
By clicking on the Edit icon, you will open the Page Editor.
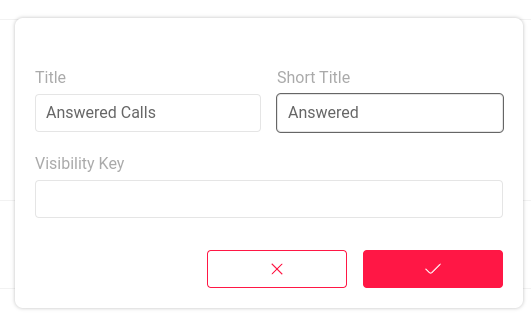
The Page Editor allows the user to edit the page information.
As shown, you can edit the following information:
-
Page Title
-
Page Short Title (Shown in the tab selectors)
-
Visiblity Key
QueueMetrics Print Report Page Feature
Now QueueMetrics allows users to print a report page. The printed report page, as opposed to a normal Report Export, contains all of the Report page’s charts as well as its DataBlocks.
Print mode
To effectively print a report page, QueueMetrics must perform a few operations before opening the print dialogue. Namely, parts of the usual QueueMetrics GUI must be hidden from view, while a print-friendly recap of all the filters and report parameters will be added at the top of the report page.
Most importantly, all DataBlocks must be shown without pagination. Please note that this means that if your report contains a lot of calls, it could take a while to load in print mode, and we recommend against printing reports with more than a hundred calls, especially if you’re trying to print the details of said calls.
Once QueueMetrics has completed all the necessary preparations, it will open the Print Preview panel of your browser, where you can finalize the settings for the printing of the current report page.
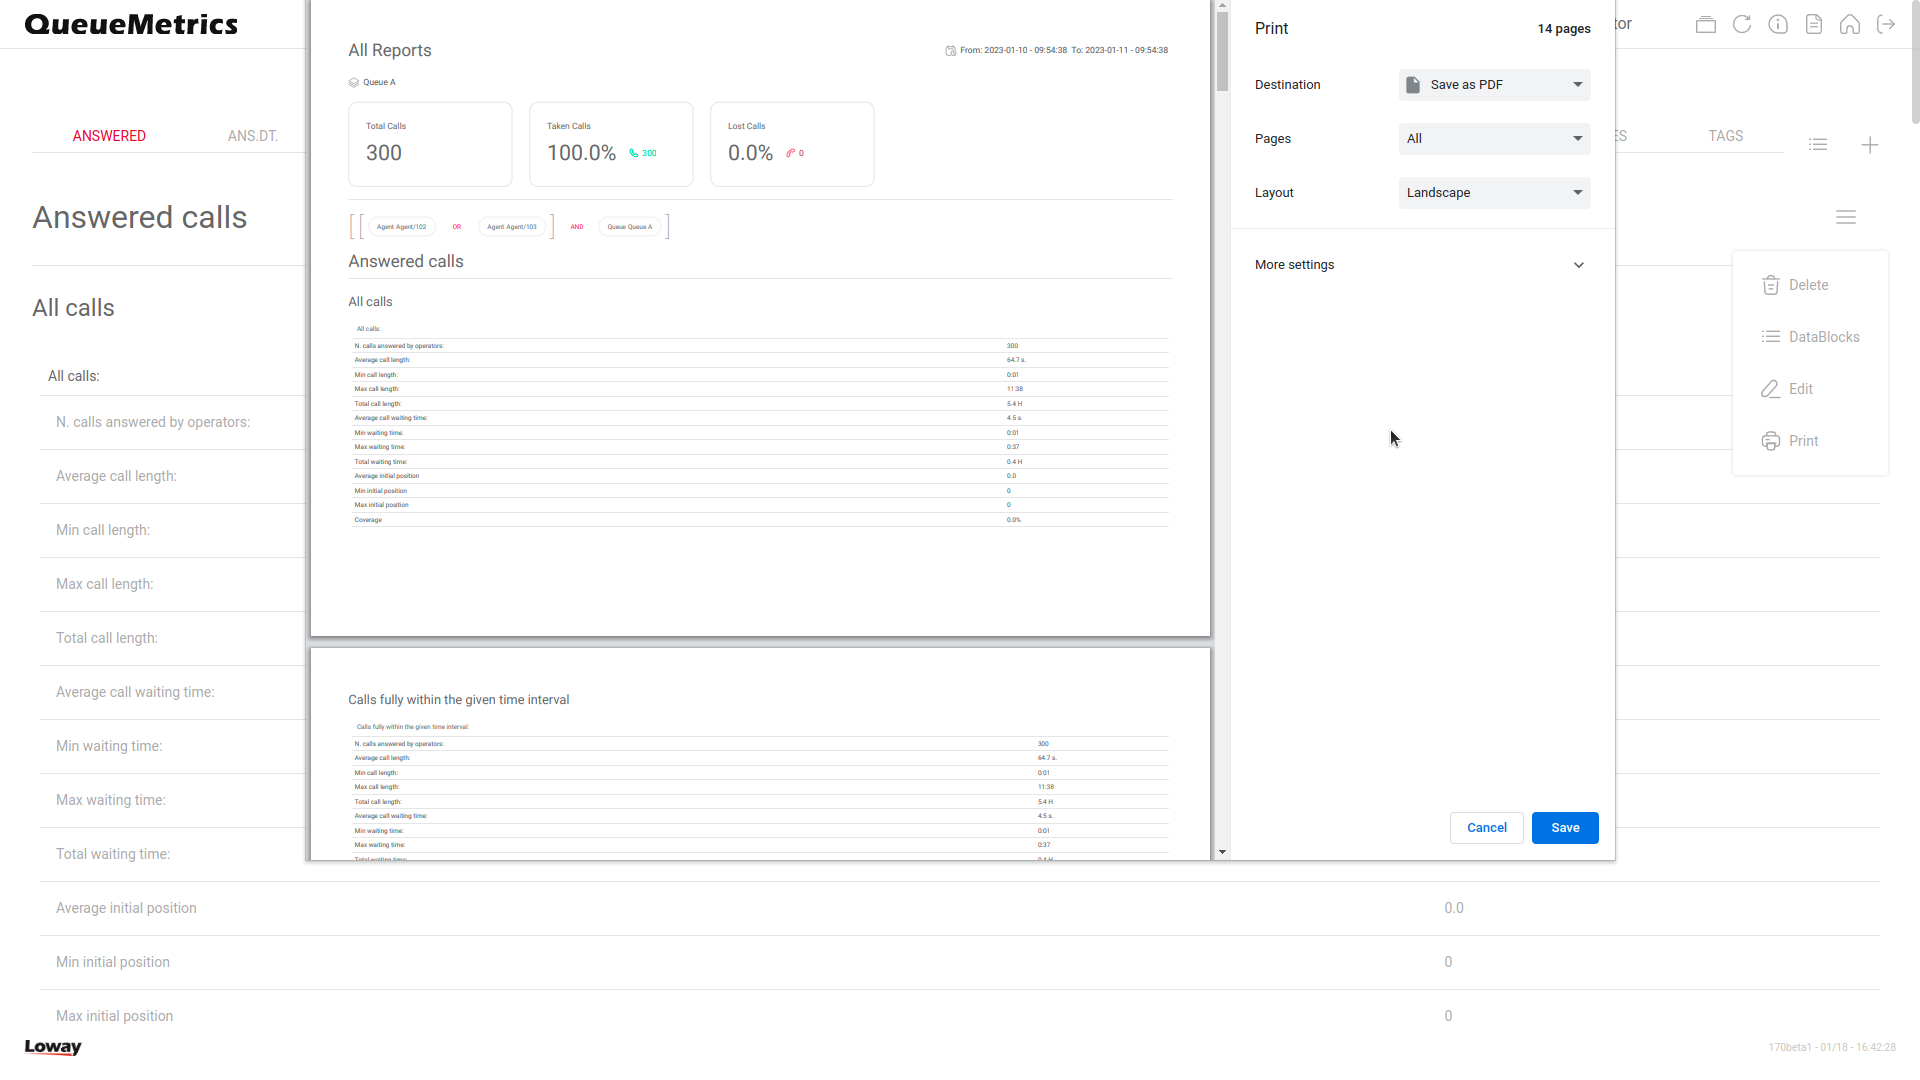
We recommend printing the document in Landscape mode instead of Portrait, for better readability.
Every DataBlock will break the current page and begin a new one, to avoid tables being cut in half as much as possible. The font-size is set at 12pt, following printed documents readability guidelines for Google Chrome and Mozilla Firefox.
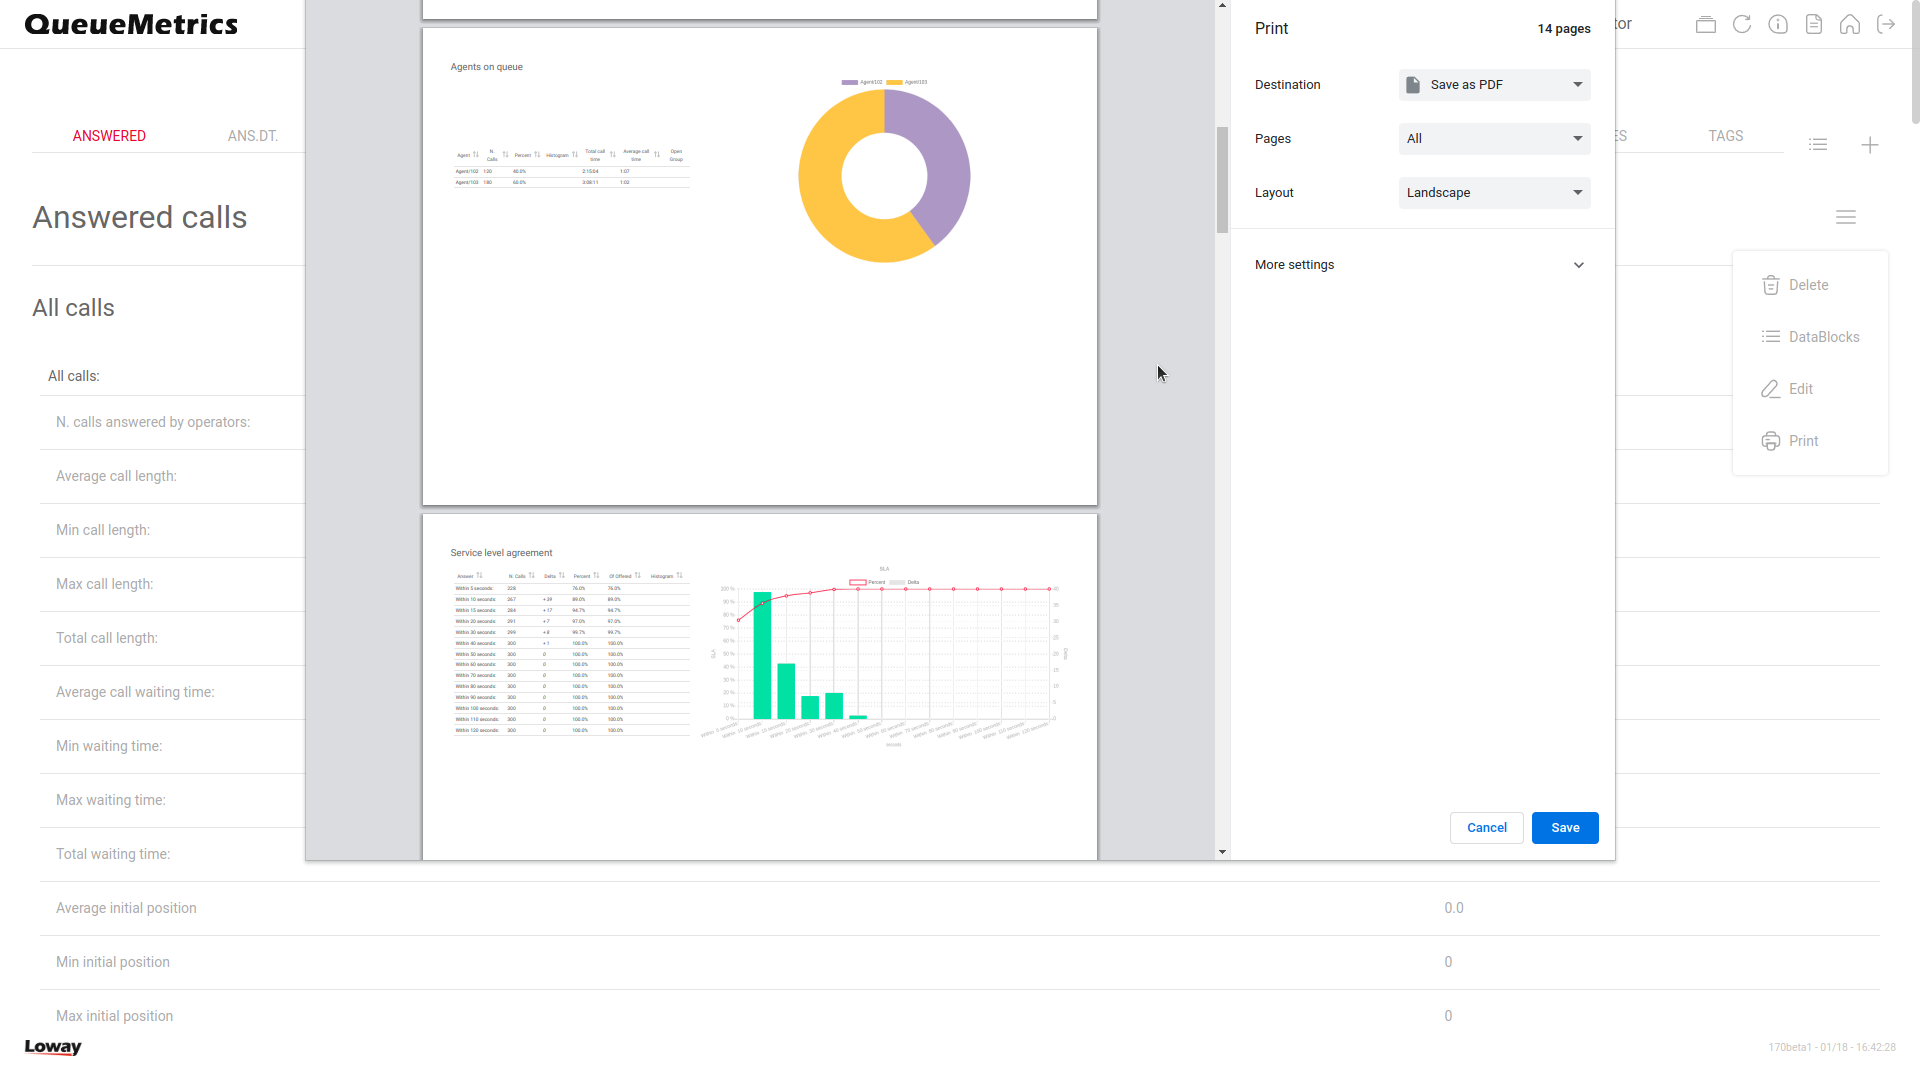
Due to Firefox’s issues with handling web pages that include Flexboxes during printing, the charts in Firefox will be displayed under the relevant table instead of on the side. Chrome will display them on the side instead.
Once the preview is generated, the document can be printed or saved as PDF.
Exiting print mode
After printing the document or cancelling the preview page, QueueMetrics will take a few seconds to restore the report to its original form. This is because every table must be reloaded in paged mode, and the GUI must be restored to its default state.
DataBlock Editor
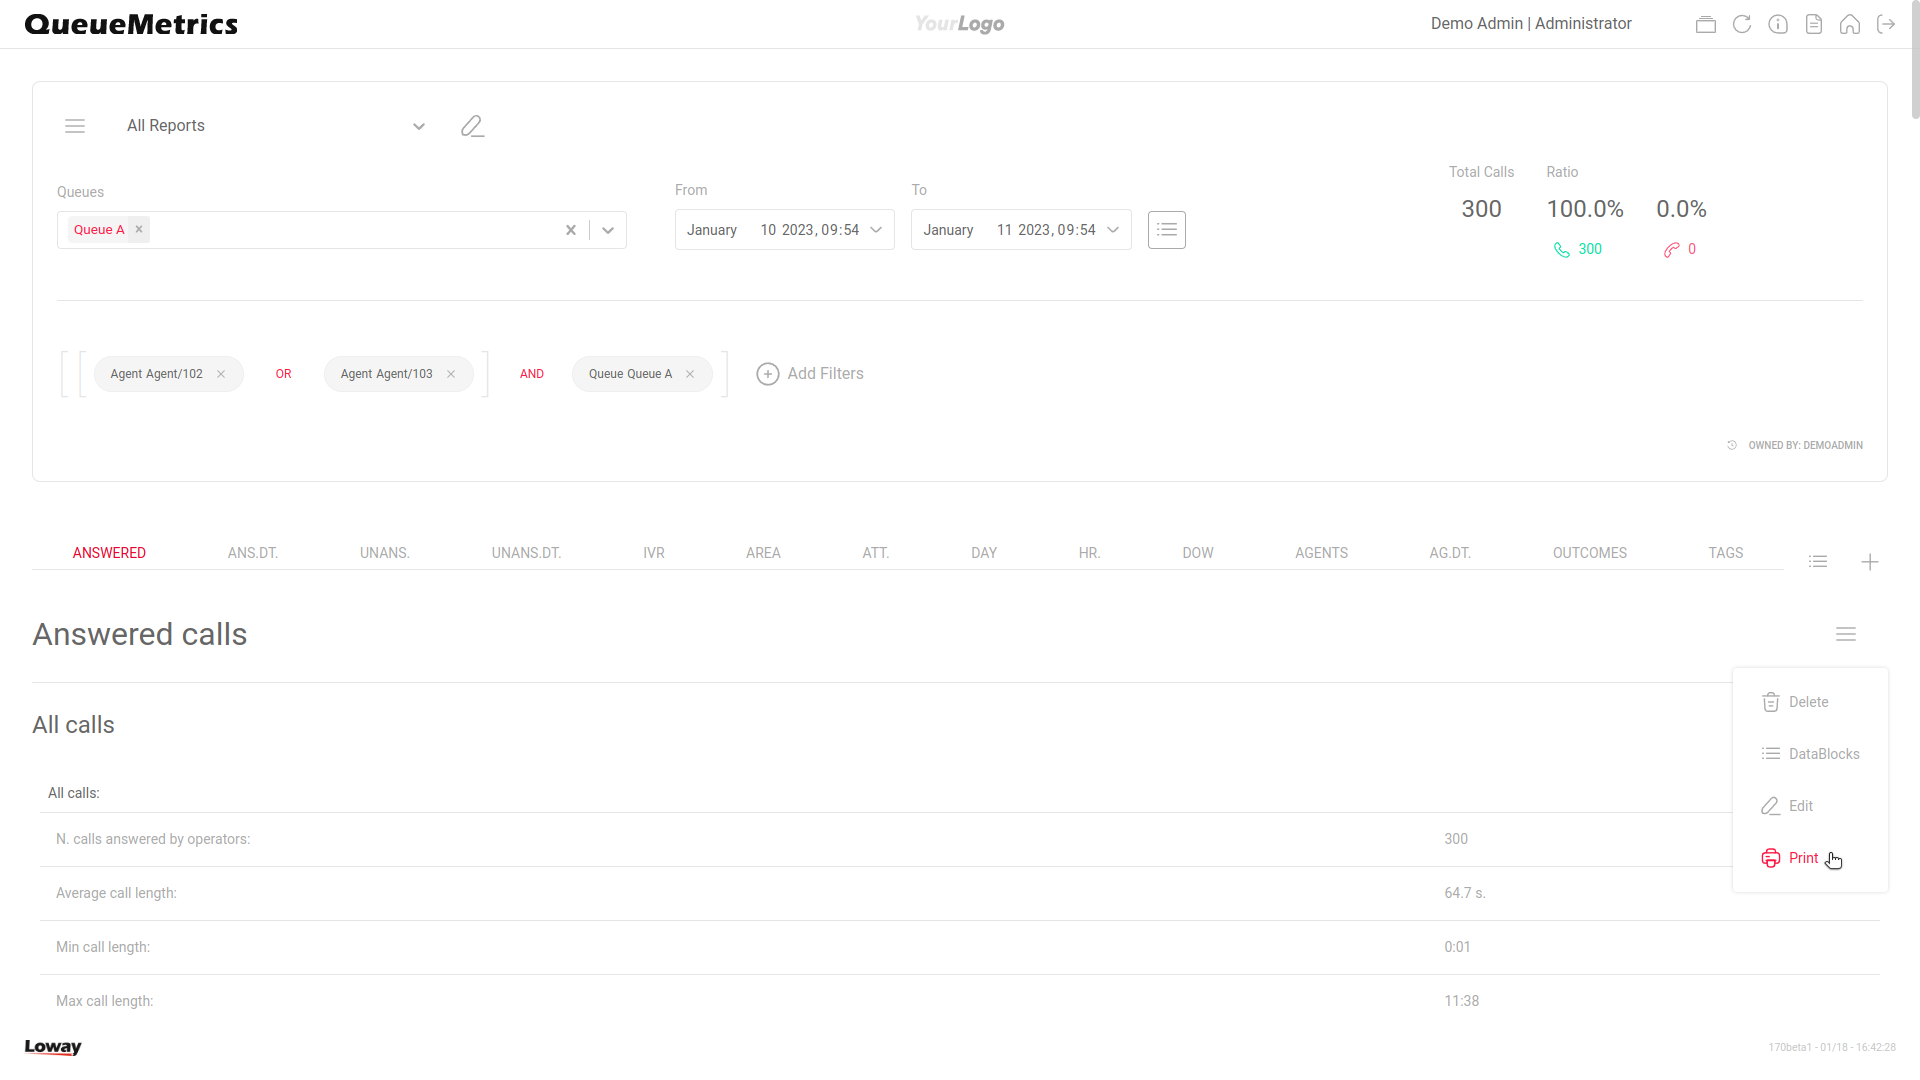
To the right side of a DataBlock, you will find a drop-down menu that allows you to edit, delete, export and reorganize a DataBlock.
![]()
By clicking on the Delete icon, you will delete the DataBlock from the current Report page.
By clicking on the PDF or XLS icons, you will export the DataBlock in the selected format.
By clicking on the Columns icon, you will open the DataBlock columns panel, where you can hide/show and rearrange the DataBlock’s columns.
By clicking on the Edit icon, you will open the DataBlock Editor panel, where you can edit the DataBlock’s information.
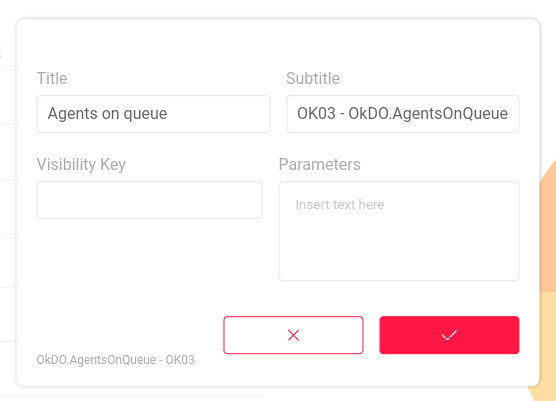
As shown, you can edit the following information:
-
Title
-
Subtitle
-
Visiblity Key
-
Parameters
Report Settings
To open the report settings, the user can click on the "Gear Icon" in the drop-down menu in the top left side of the screen.
This will open the settings menu
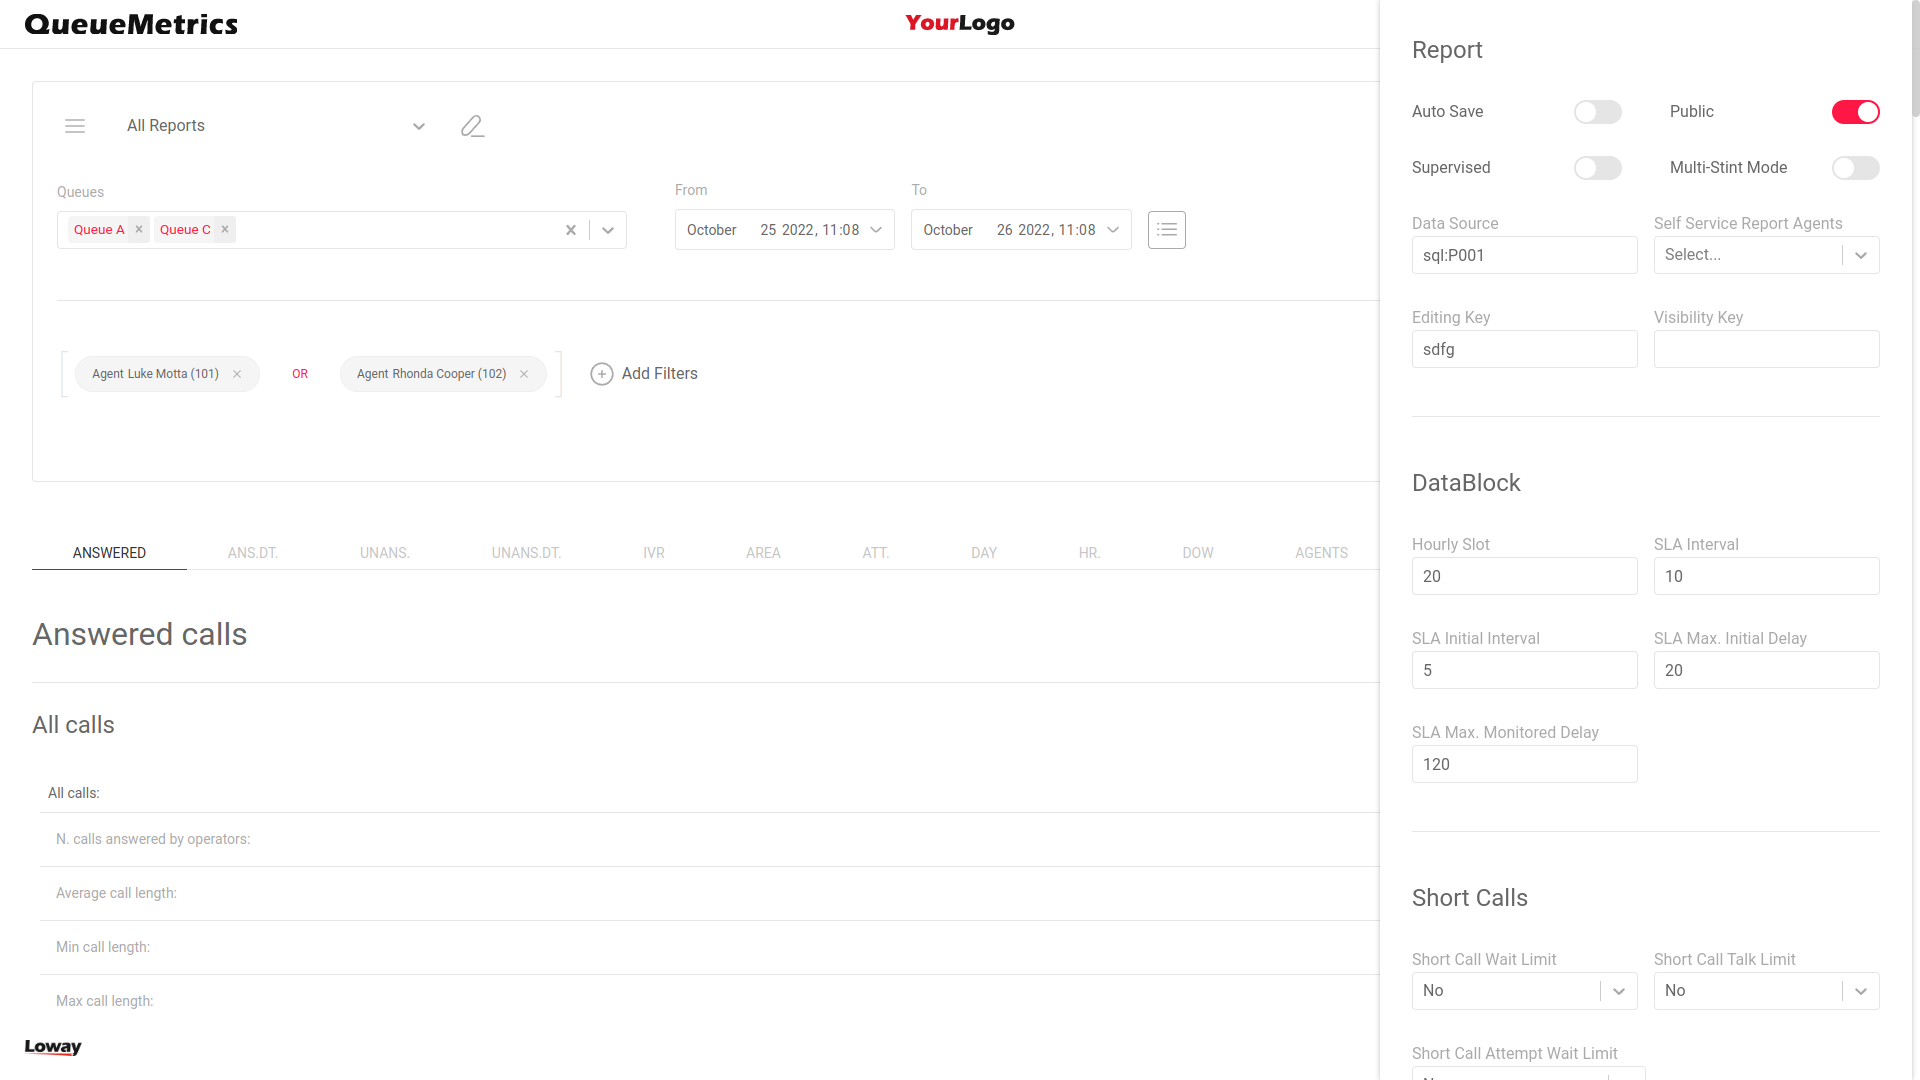
Here the user can change the following settings:
| Setting | Description |
|---|---|
Auto Save |
If set to yes, the report will be saved automatically after any relevant change. (Since QM 21.04). |
Public |
If set to yes, users other than the owner will be able to access this report. |
Supervised |
lets the user search only for agents that have the current user as their supervisor. |
Multi-Stint mode |
Enables/disables Multi-Stint mode, joining together all calls with the same Unique Id. |
Data Source |
The data source for the queue_log data. |
Visibility Key |
Visibility Key for the report. |
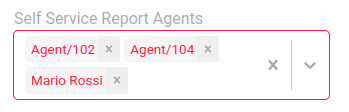
Self Service Report Agents |
Specifies the agent that can access this report in Self Service Agent Report (SSAR) Mode. |
Hourly Slot |
The time interval for time distributions in Hour distribution tables. |
SLA Interval |
The time interval for SLA Charts and Tables |
SLA Initial Interval |
The initial time interval for SLA Charts and Tables |
SLA Max. Initial Delay |
The time interval before SLA Interval takes effect instead of SLA Initial Interval |
SLA Max. Monitored Delay |
The maximum time interval for SLA Charts and Tables |
Short Call Wait Limit |
How long must a call be in wait status before being counted as a valid call |
Short Call Talk Limit |
How long must a call be in talk status before being counted as a valid call |
Short Call Attempt Limit |
How long must a call attempt be long to count as a valid call attempt |
Number of CLID digits to search |
Number of CLID digits to count as prefix in Area Code calculations |
Starting from position |
Starting position of the Prefix in Area Code Calculations |
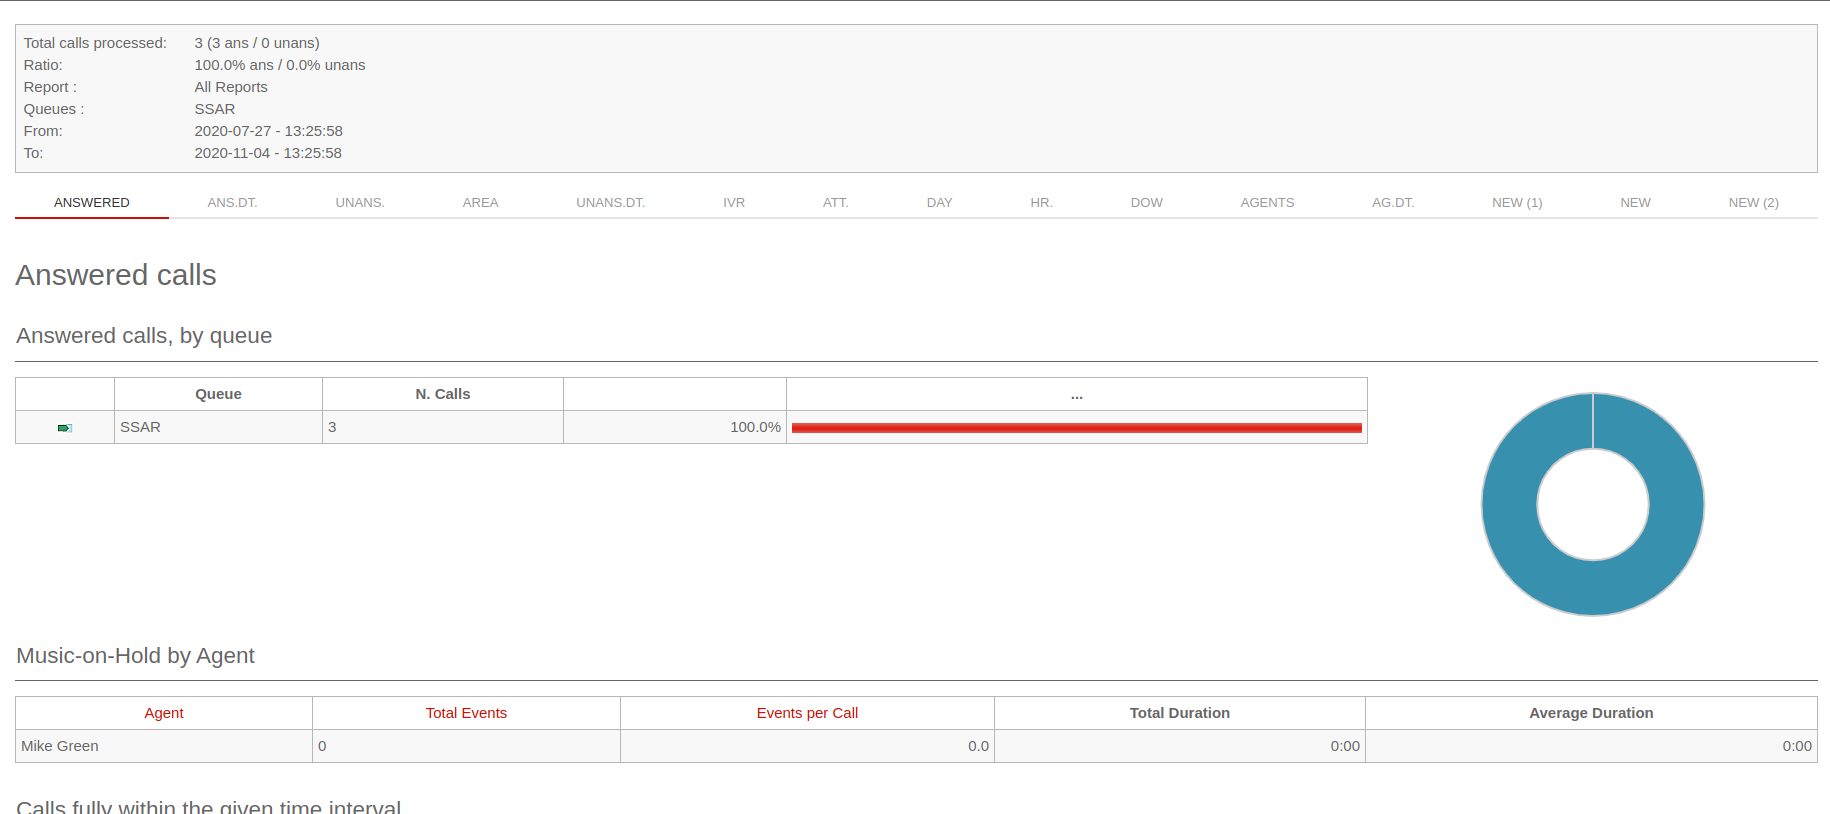
Self Service Agent Reporting (SSAR)
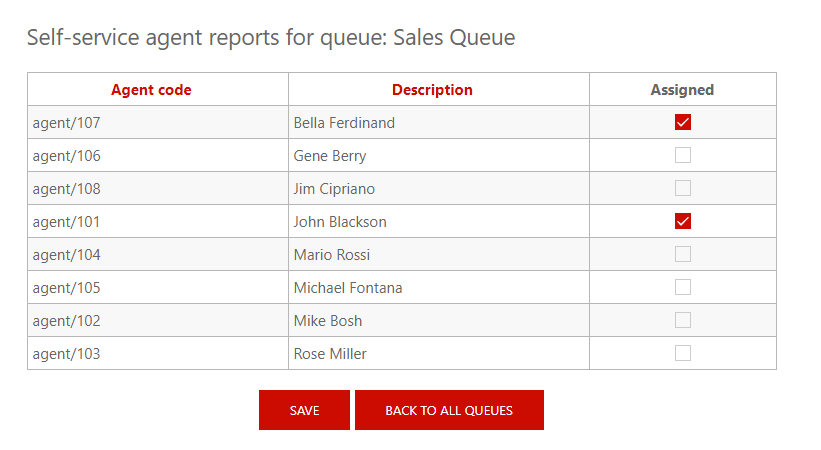
Reports can also be accessed by agents in Self Service Agent Reporting mode, by assigning specific reports to such agents in the settings panel.
To be able to access a report in SSAR mode, an agent needs to hold the following security key:
-
SSAREPORT
This key is usually assigned to the AGENTS class by default.
The last requirement to be able to start SSAR Reports, is that the agent needs to be assigned a set of queues to monitor.
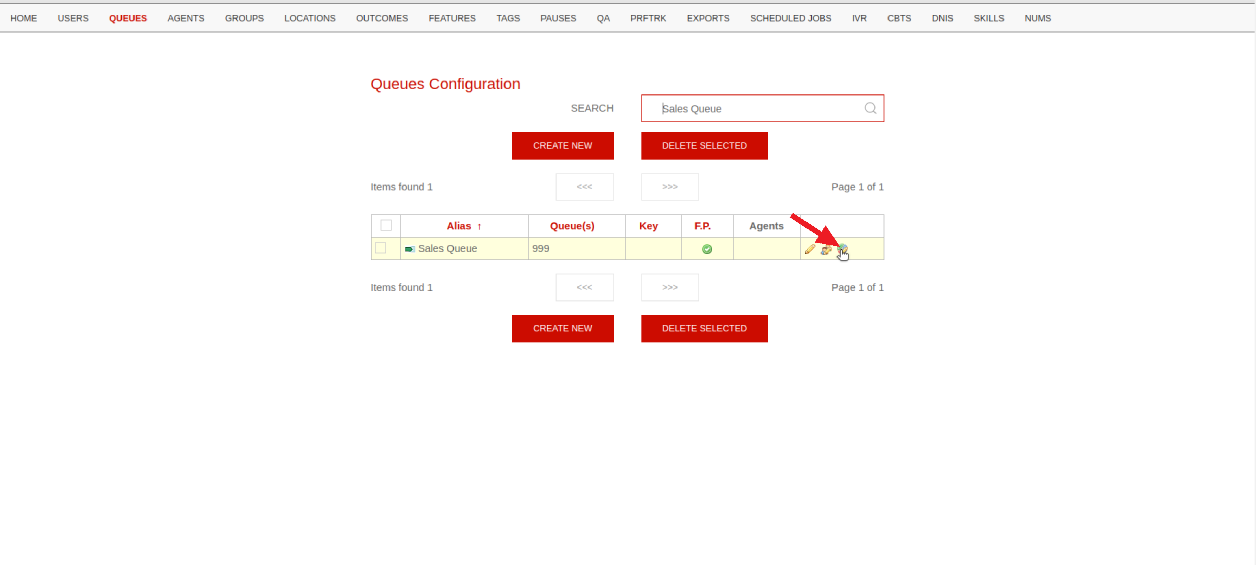
To assign a queue to an agent, a user with sufficient permissions has to navigate to the Queue Editor from the HomePage, and find the queue to assign to the agent.
Once the queue is found, then the user can assign it to the agent by clicking on the "Assign reports to agent" icon on the right side.
Now, if the agent accesses the Home Page, he should see the SSAR InfoBox
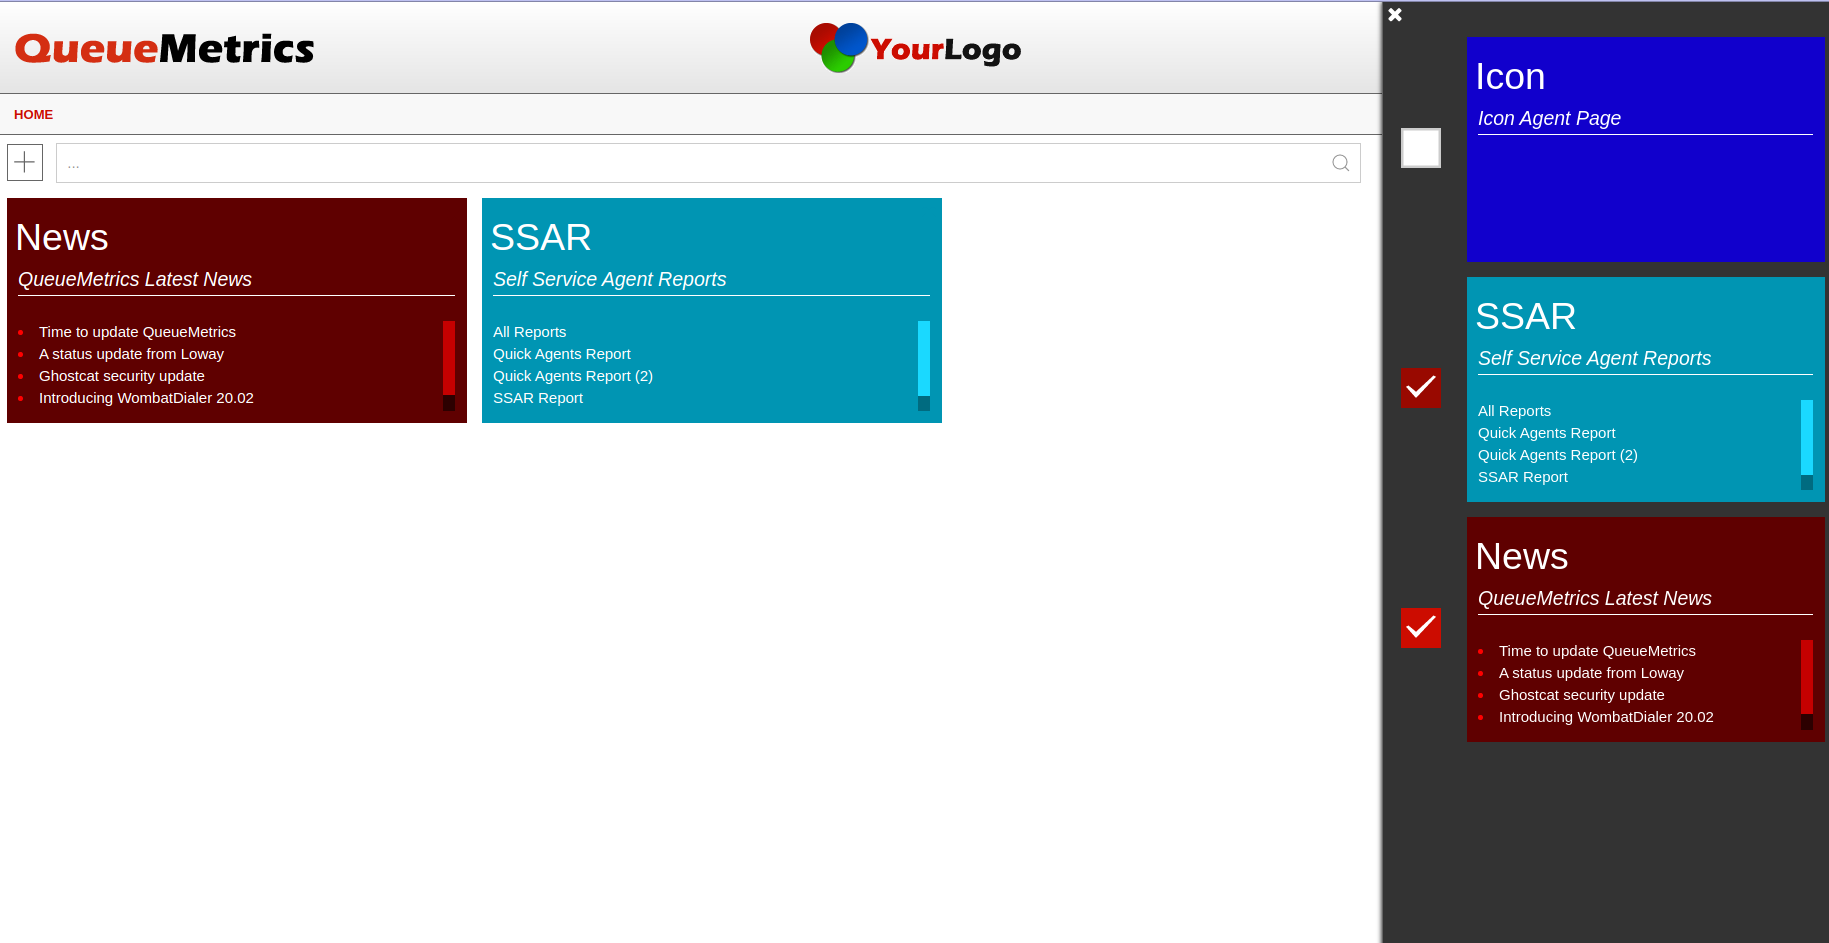
In the InfoBox the agent will see the Reports they have access to in SSAR Mode.
When accessing a report in SSAR mode, an agent will only be able to see the Report, without being able to edit it.
Information will also automatically be filtered to show only data relative to that specific agent.
Timeline
Introduced with QueueMetrics 22.02, the new Timeline panel replaces the old call details panel.
To access a call’s Timeline panel, the user must click on the Magnifying Glass icon on the call’s row, in the Queue Details (OD01) or in the Detail of unanswered calls (UD01) DataBlock.
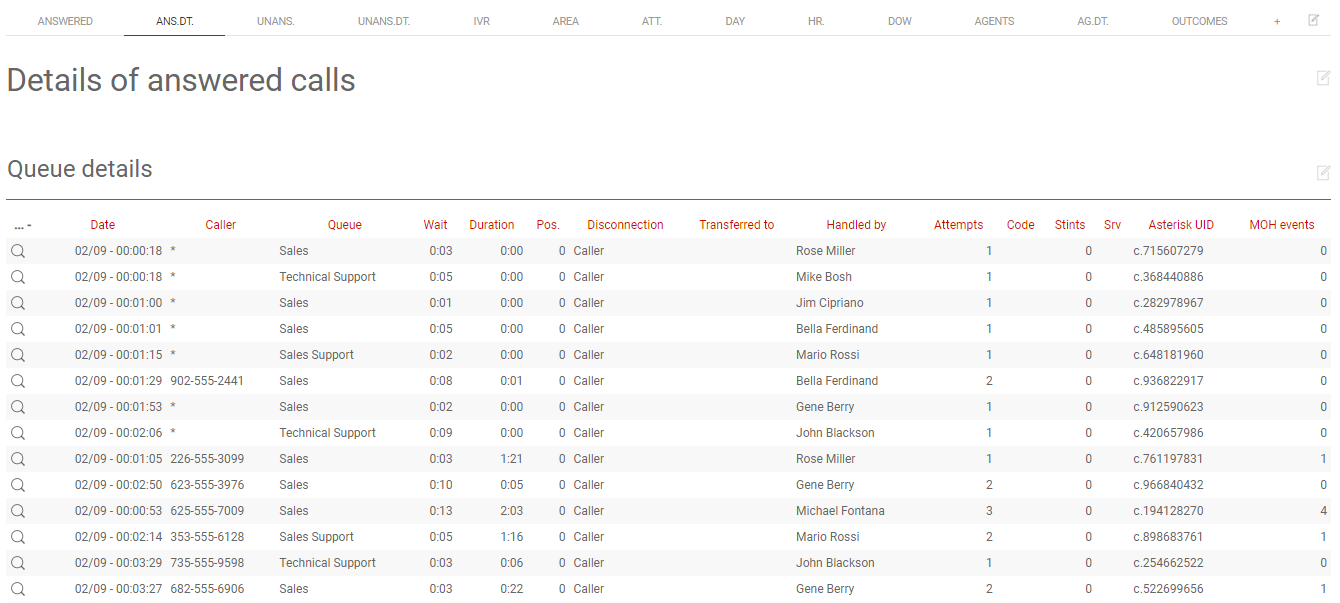
By clicking on the icon, the Timeline panel will appear. This panel presents a few features that are detailed below.
Call Details
On the left side of the screen, when looking at the Timeline panel, the user can see the details of the selected call. These details are exactly the same as the ones shown in the old Call Details popup.
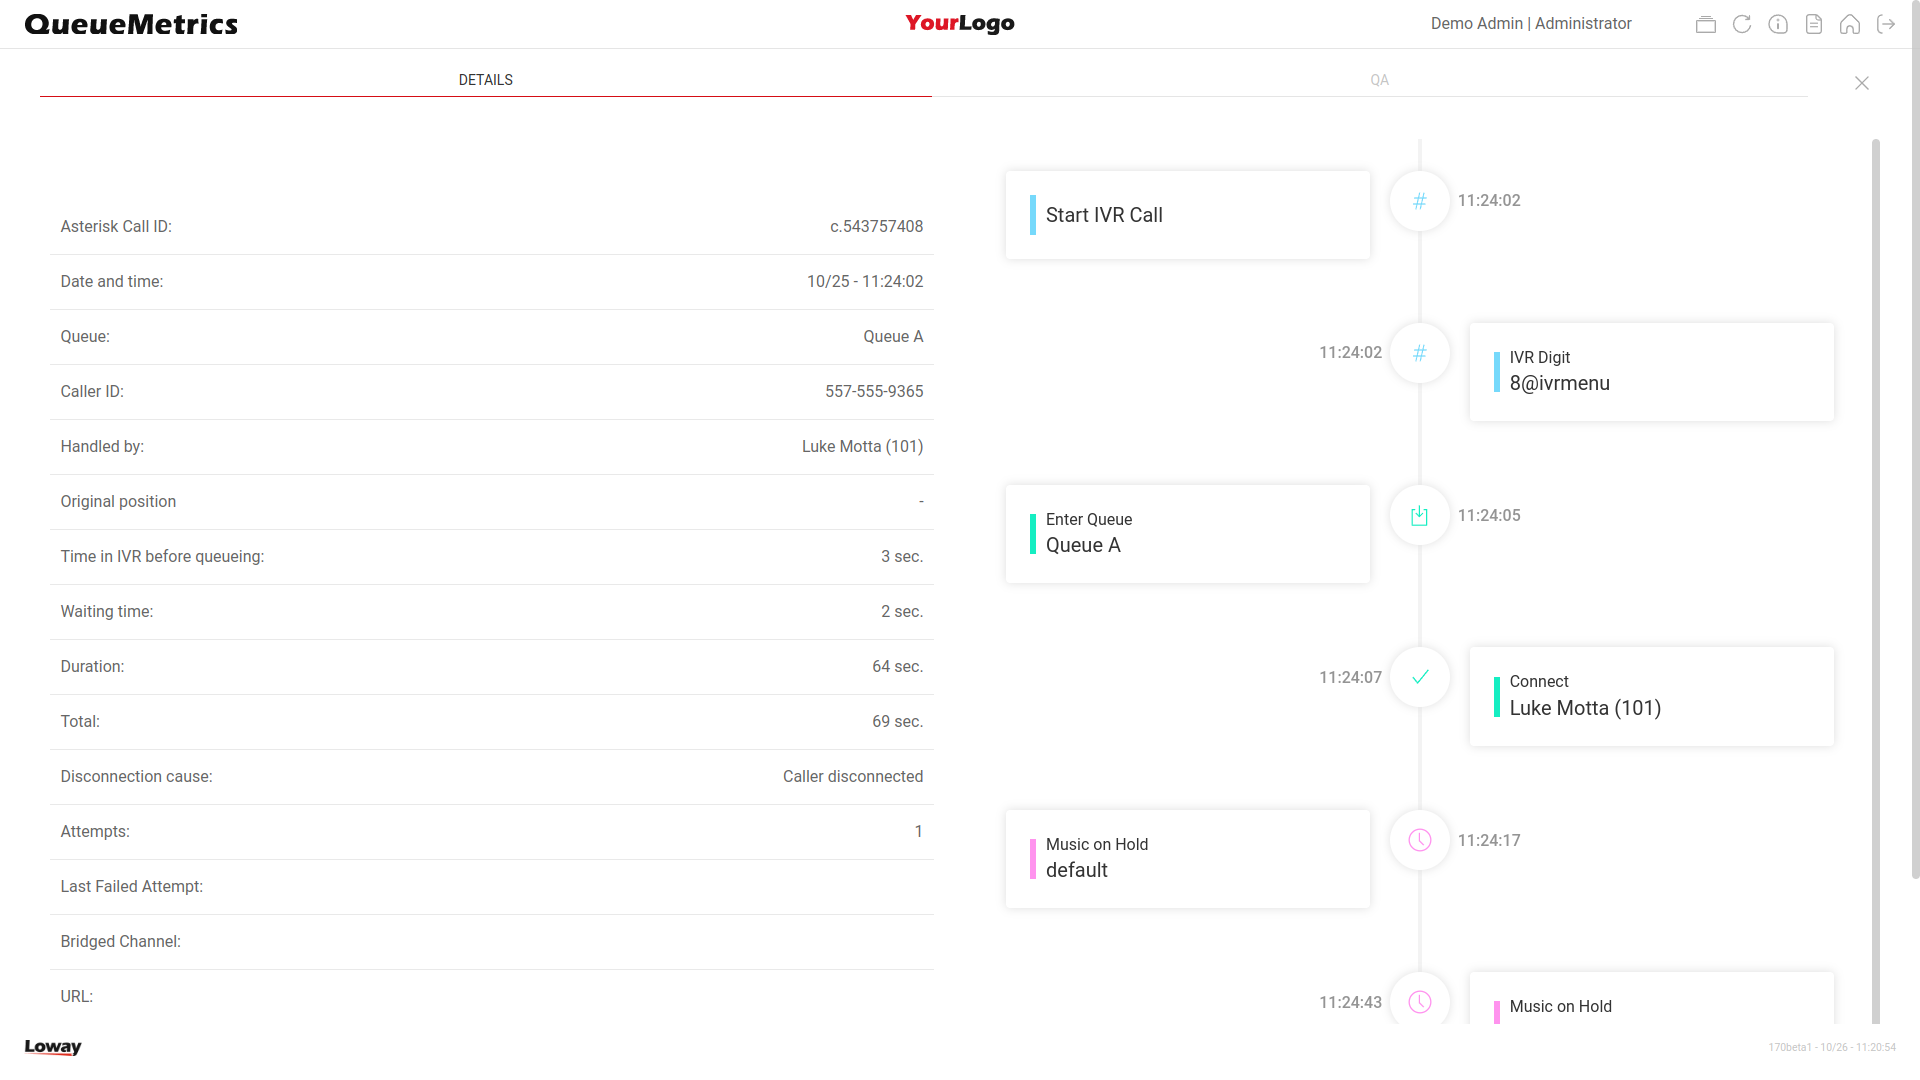
Timeline
On the right side of the screen, the user can see a vertical Timeline listing every call event in chronological order.
Each event shows the time the event happened at, the description and, depending on the case, some additional information about the event itself.
Recordings and QA
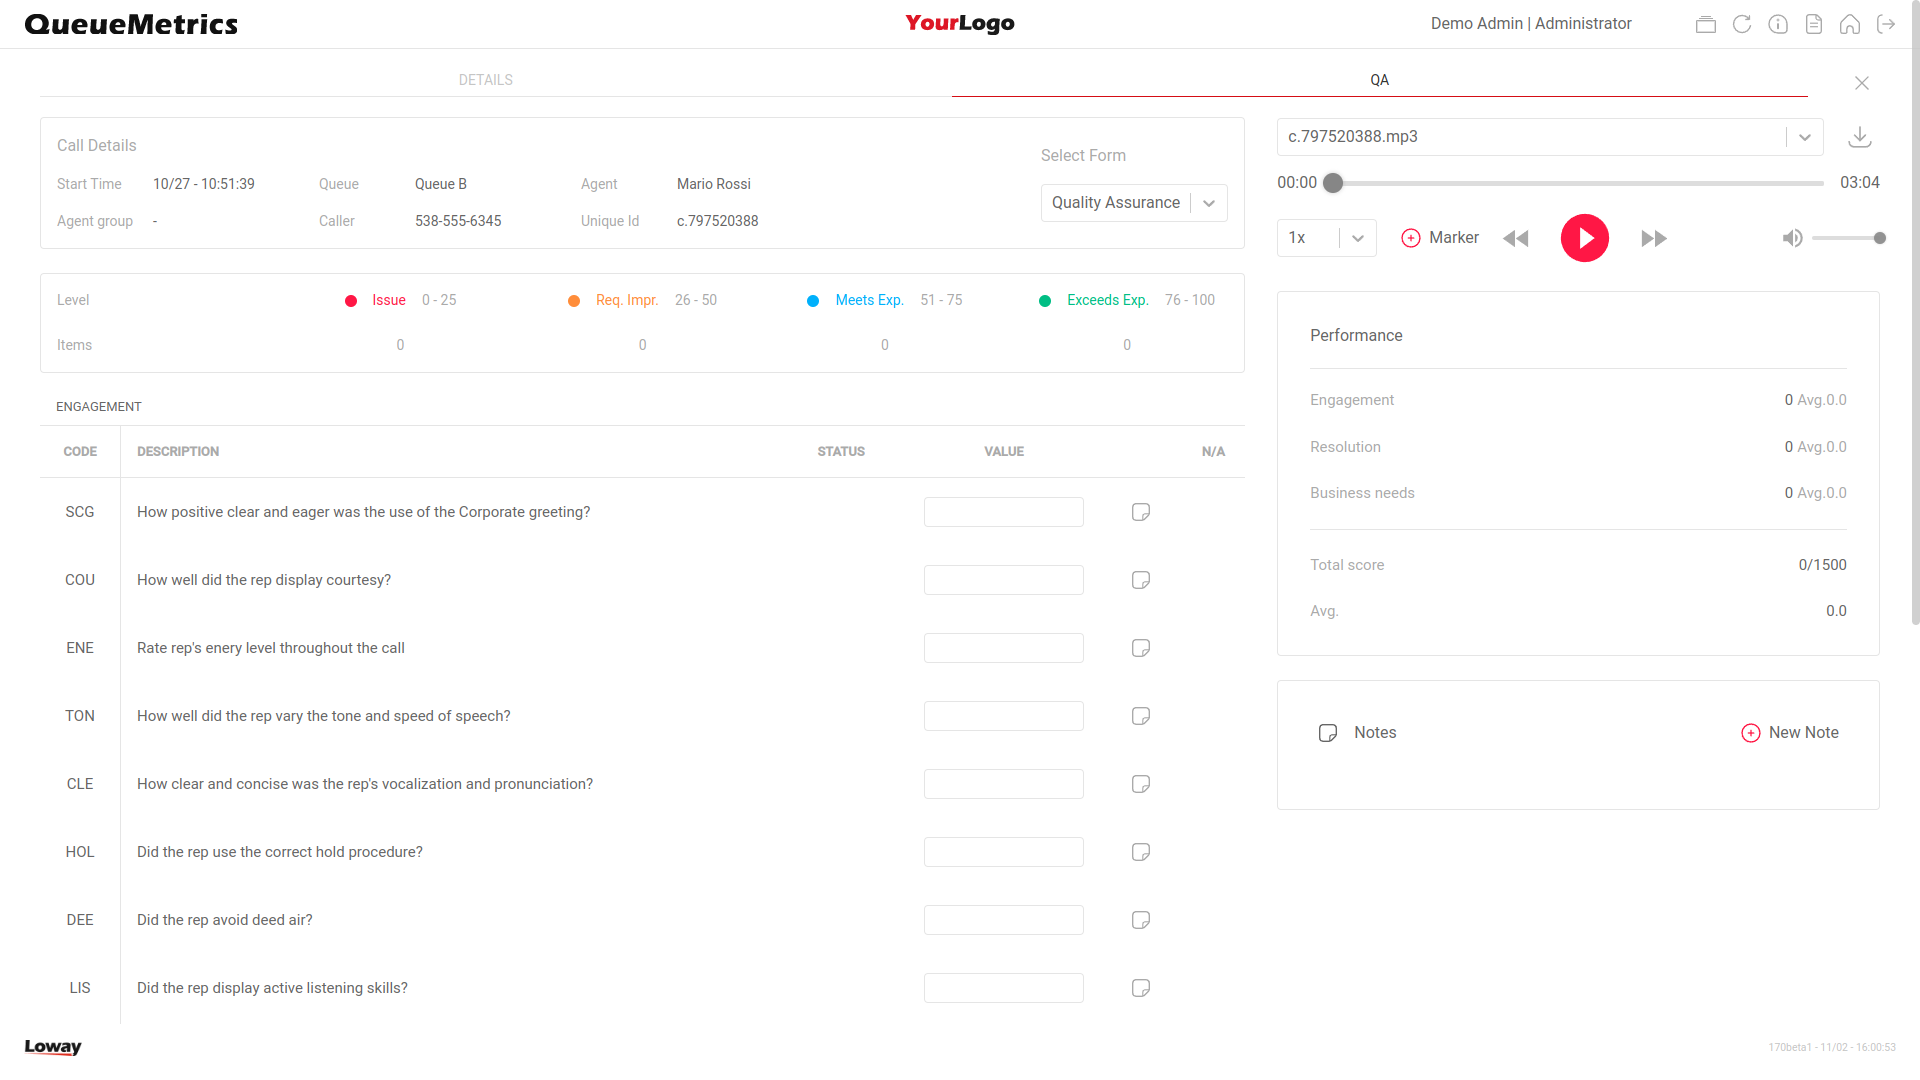
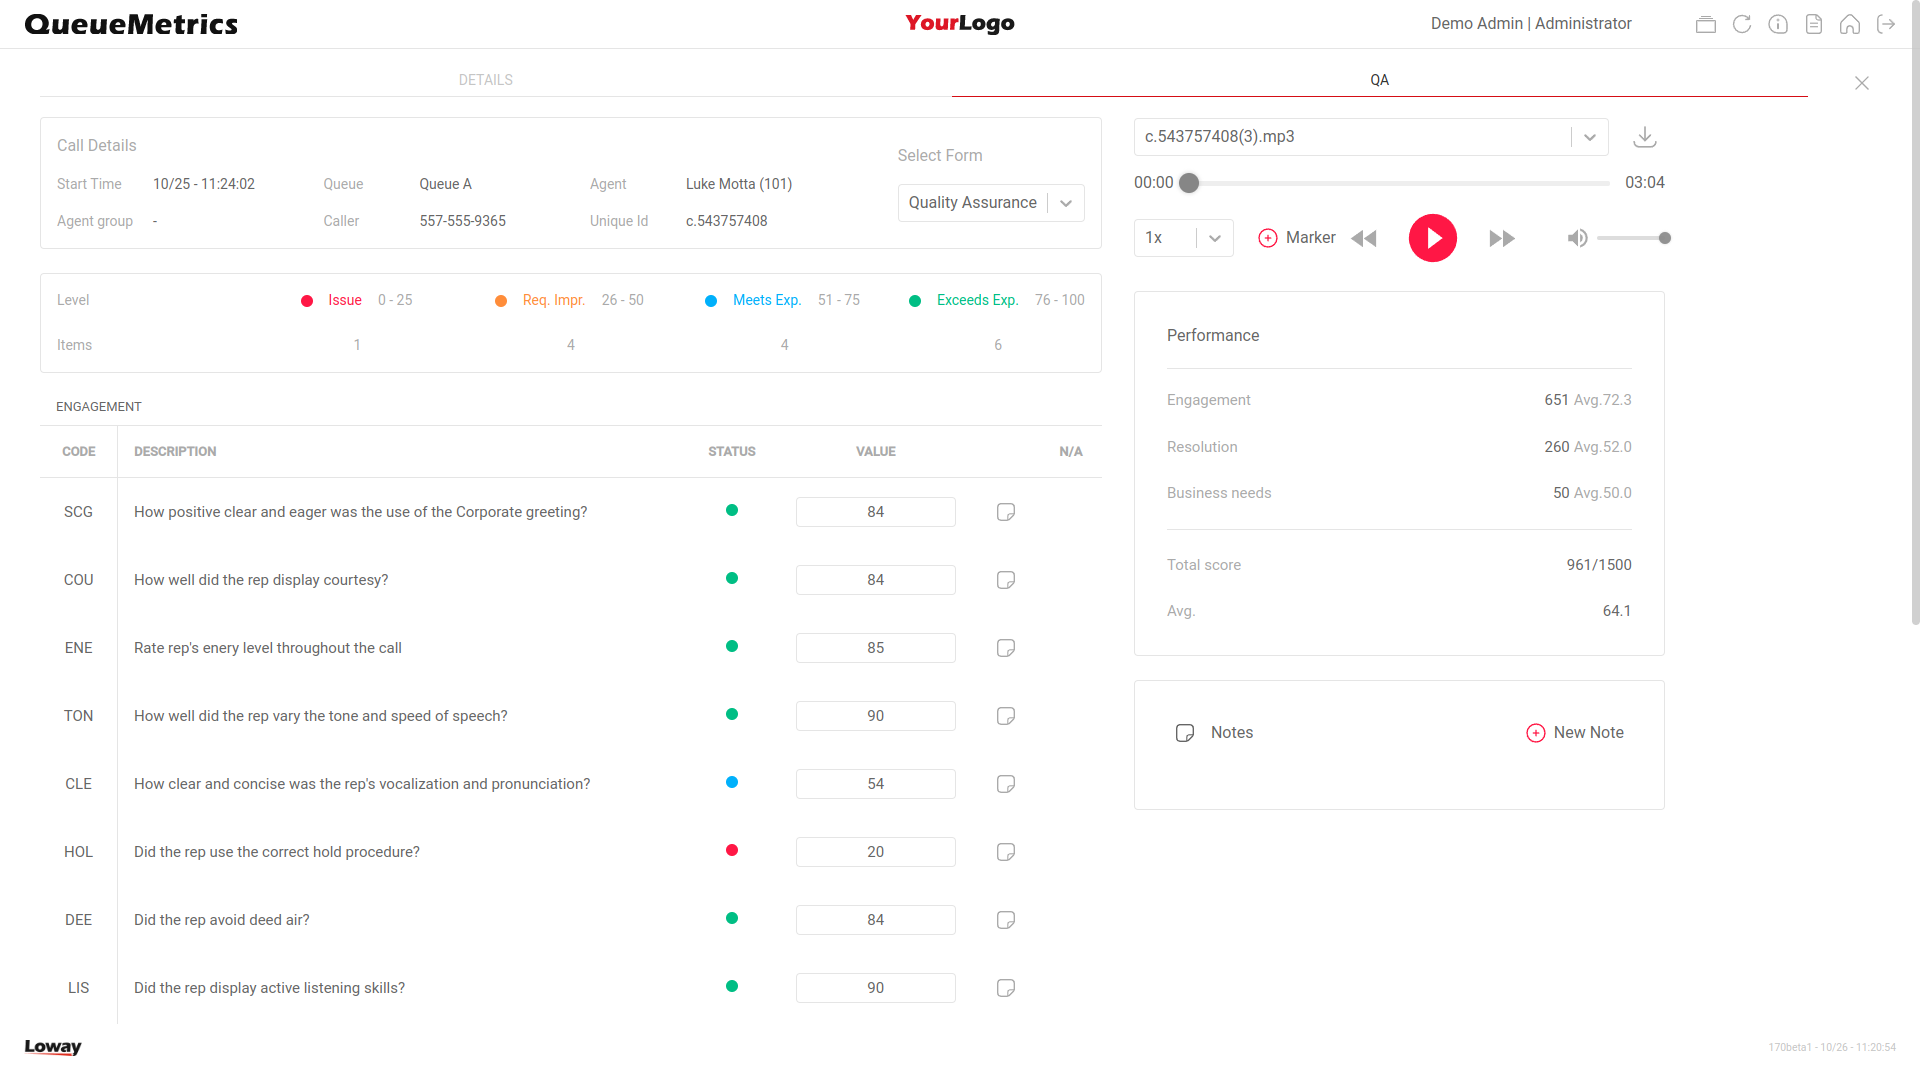
By clicking on the «QA» tab in the top left, the user can access the Quality Assurance and Audio Player tab.
Audio Player
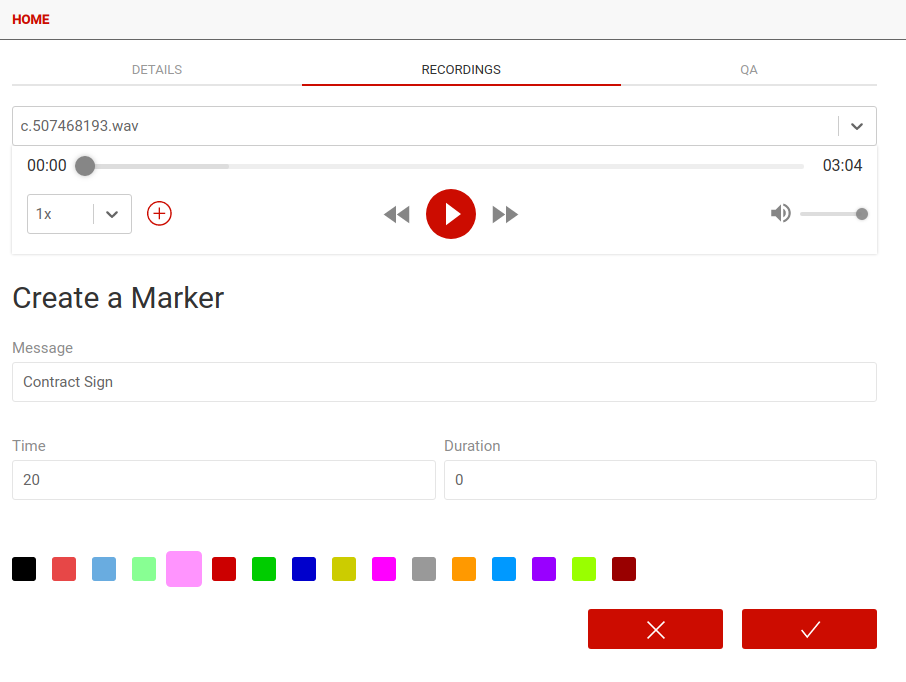
The Audio Player in the top right will allow the user to see which audio recordings are associated with the current call. For each one of them, QueueMetrics allows the user to create markers at specific timestamps and color code them. The user can also increase the playback speed or loop the recordings.
By clicking on a saved marker, the player will skip to the noted timestamp, making navigating recordings easier.
QA
By clicking on the QA tab, the user can access the classic QA panel where they can grade the current call using the available QA Forms.
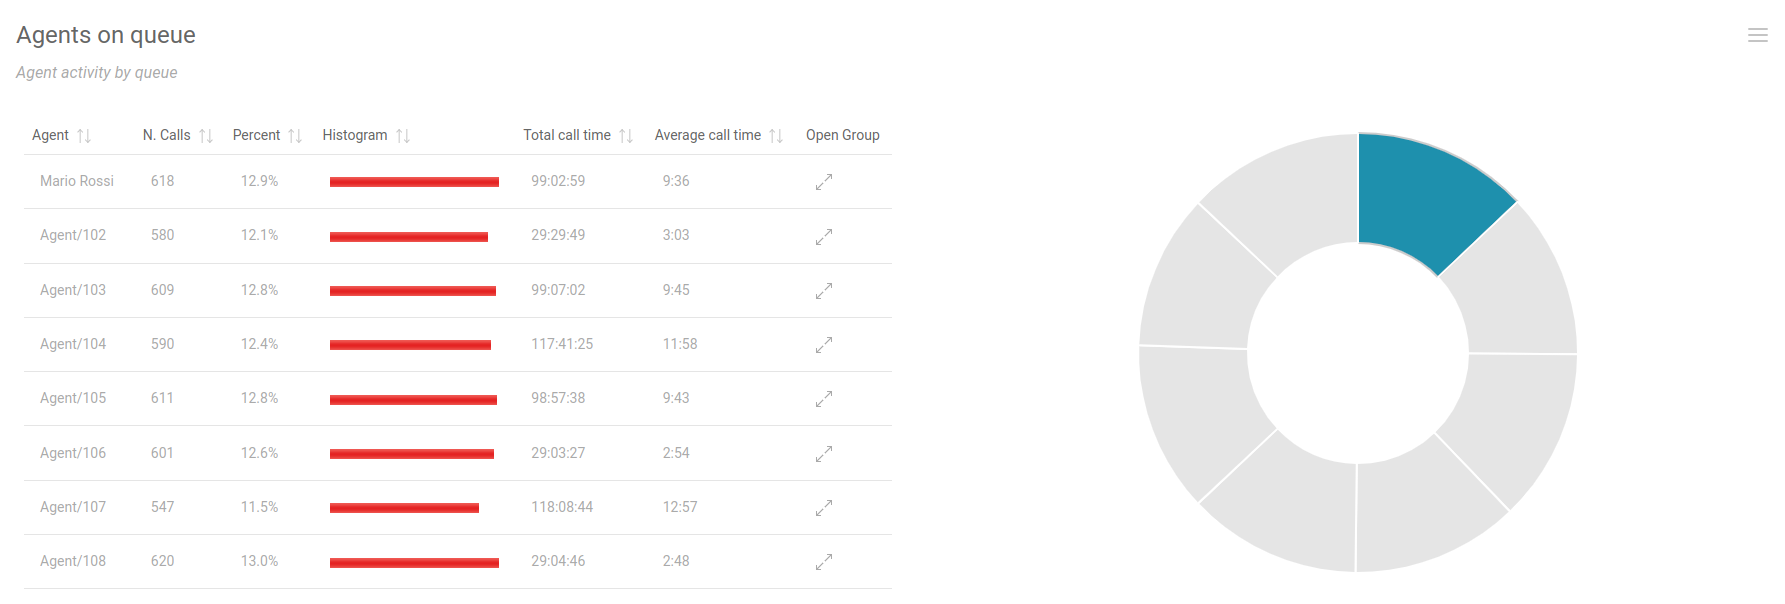
Call Grouping
QueueMetrics 22.02 introduces the concept of Call Grouping. From this version onwards, Datablocks that show metrics that includes a field to indicate the number of calls that fulfill a certain criteria, and that also show this icon:
![]()
will offer the user the ability to see tables indicating which calls make up that number.
The calls are divided into Taken and Lost calls, while a third tab is dedicated to all IVR events.
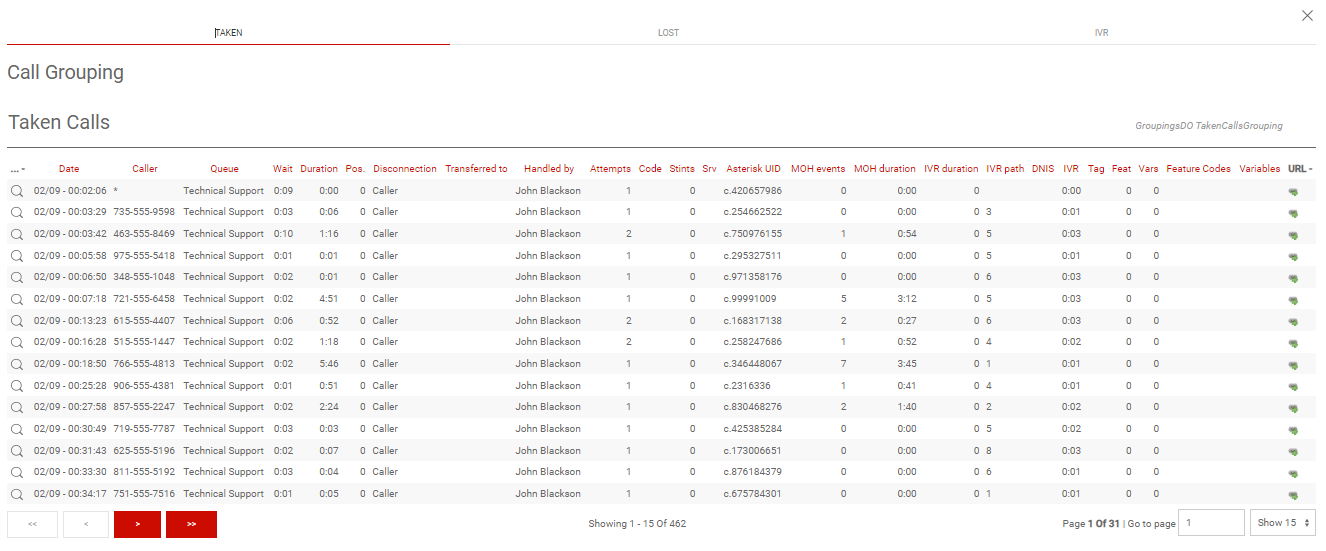
The user is also able, by clicking on the magnifying glass, to reach the Timeline panel for each of the calls listed in these tables.
Call filtering criteria
In the filter expression, a number of criteria can be specified to better zoom in on a given set of calls.
-
Agent is a specific agent code
-
Location is a given location
-
Supervision lets you search only for agents that have the current user as their supervisor
-
Outcome lets you select a call outcome
-
Call features lets you select a call feature code
-
Call tags lets you filter by call tag
-
Variables lets you filter by a generic variable associated to a call (see below).
-
Asterisk call-id search by substring on the Asterisk’s UniqueID of the call
-
Caller search by substring on the Caller-ID. By using a regular expression, this filter can also be used to match on specific Area Codes: for example, a filter
^..393will match all numbers for area code 393 skipping the first two digits. -
Wait duration lets you specify the call waiting duration
-
Call duration lets you specify a minimum and maximum for the call duration
-
Disconnection cause lets you pick a disconnenction reason for the call
-
Enter position lets you enter a minimum and maximum enter position (note: this is not tracked for every call)
-
Number of attempts lets you select a given number of attempts
-
DNIS lets you select calls that have a specific DNIS (if tracked)
-
IVR choice lets you select calls that have a specific IVR choice (if tracked)
-
Server for clustered systems, lets you select only calls that were processed on a given server
-
Non-contiguous reports let you choose the day(s) of the week and the time periods that you want to include in the reports.
Note that:
-
Criteria involving a full-text search (e.g. Caller) can optionally support full Regular Expressions; if they start by "^" they will be processed as Regular Expressions. E.g. entering "^\d+$" means "find all fields which value is made up only of numeric characters, having at least one character".
-
Running criteria with multi-stint calls may or may not lead to the results you are expecting. See Multi-stint calls for more information on this issue.
When a report is run with criteria set, all statistics are computed "as if" those were the only calls available; so e.g. agent sessions may yeld different results from what you would get with no criteria.
Filtering by call variables
Variables allow for very flexible filtering where you can check multiple variables at once, as in:
-
"A B C" (or "A: B: C:") means that on every call all three variables must be present
-
"A:12 B:" (or "A:12 B") means that on the call there must be a variable "A" set to "12" and "B" must be present.
-
"A:\^x." means that the value for A is checked against the regular expression "^x." that matches for example "xy" but not "qqq"
Variables are not logged natively by Asterisk, and can be added as explained in Adding custom variables - but they can be provided automatically if you run a WombatDialer campaign.
Short calls
It is possible to filter out of the report so called "short calls", that is calls where the caller hung up before they could be meaningfully processed. Such calls inflate statistics and provide an inaccurate picture of what actually happened on the queues being processed.
QueueMetrics can filter out three types of short calls:
-
Short Call Wait Limit: excludes calls with a wait time shorter than X seconds that ended with a caller abandon.
-
Short Call Talk Limit: excludes taken calls with a conversation time shorter than X seconds that ended with a caller abandon.
-
Short Attempt Wait Limit: excludes attempts to agents that were shorter than X seconds
While calls are simply excluded and will not appear in reports, if you have short attempts and look at the call details, you can still see the "short attempts" under a different event class, but these events will not be counted for attempt statistics.
Short calls can be enforced on a global basis by setting the properties default.shortCallWait,
default.shortCallTalk and default.shortAttempt.