Showing call details
As shown above, QM lets you see the very detail of calls handled by Asterisk.
Detail of answered calls
For each answered call, the following information is shown:
-
Date and time for the call;
-
The Caller-ID, if available (the Caller-ID format may differ according to your local Telco - in some countries it include the full name of the caller, in others it might be a number and in others it may be unavailable at all);
-
The queue that handled the call;
-
The total waiting time before the agent was connected;
-
The duration of the call, talking to an agent;
-
The initial position of the call
-
The cause of disconnection;
-
Which agent or terminal handled the call.
-
How many agent attempts were made before this call was answered
-
The call completion code your agents entered
-
How many stints make up this call
-
The server that handled this call (in the case of clusters)
Optionally other information could be shown:
-
The asterisk unique ID associated to each call
-
An icon that opens a new web page with an URL user customizable (useful for proprietary CRM integrations). To enable these two columns, the keys default.crmapp and default.showAstClid have to be correctly set. Please read Configuring system preferences and Appendix C: System preferences for further details.
It is possible to sort the table for each title, in either descending and ascending order. To do this, click once on the desired title for descending sort, and twice for ascending sort. Once the table is sorted, an arrow symbol will appear close to the title, so you know on which column it was sorted last. As the sorting is done on the client machine, it may take a while with very large tables.
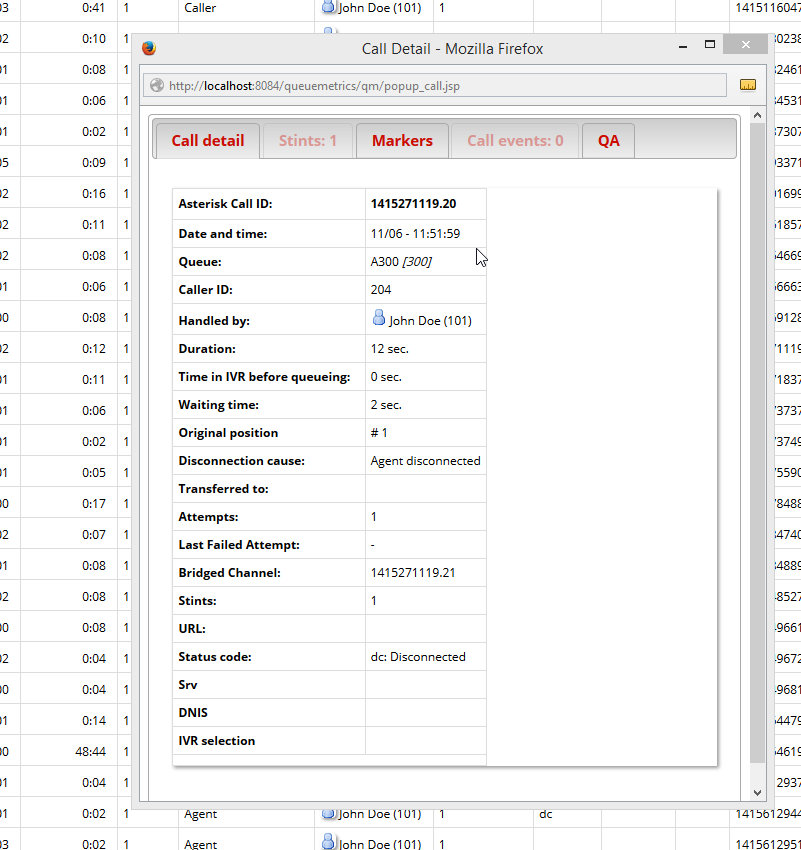
If you click on the small icon on the right, it will be possible to see the details of the call, including:
-
Asterisk’s internal Call-ID code
-
The call date and time
-
The caller-id (if any)
-
The agent handling the call
-
The call duration
-
The wait time
-
The disconnection cause
-
The extension the call was transferred to
-
The URL that was linked to this call through the Queue() command, if any
-
The call status code
-
The server that handled this call
-
The sound files (one or more) that were recorded for this call (see below).
If the call is ongoing and you have the special grants to do so, a red scissor icon might appear next to the call status to allow for brute-force call closure. See the section Closing ongoing calls for further details.
The call may also display:
-
If the call has more than one stint - that is was rebuilt through multi-stint mode - then a list of stints is visible. If a call has only one stint, then the Stints tab is not needed and appears disabled. See Multi-stint calls
-
If a call has events on it - that is specific items happening at points in time that go beyond what is displayed for the main call - they are shown in the Events tab. If not, they are disabled. The ones currently tracked are IVR traversal events, failed call connection attempts and music-on-hold events.
-
A set of markers (Note: QueueMetrics till release 14.10.4 shows "tags" instead of markers).
-
A link to open the QA form(s) available for that call
Listening to answered calls
If there are audio recordings, they will be shown by the bottom of the call details page. If the call was monitored, i.e. recorded to disk, a number of sound files may be shown. By clicking on a sound file you can listen to it straight from your browser.
You can optionally have other types of media linked to a specific call, for example chat transcripts, free text or documents. They will be opened in the browser.
Please note that:
-
The recorded file name must contain the Asterisk Call ID for QM to relate it to the call - see Listening to recorded calls using QM for tips on how to configure Asterisk correctly to implement this feature;
-
The audio storage on the Asterisk server must be readable by the servlet container;
-
You must have the correct sound codecs to listen to the sound file on your PC. WAV files usually work out of the box but are comparatively quite big, while GSM files require an additional codec pack on most Windows machines but consume disk storage much more efficiently. The best compromise is usually to use the WAV49 format on Asterisk, that is played natively by Windows machines but has a compression and sound quality comparable to the GSM format. The HTML5 player requires WAV or MP3 files.
-
Asterisk will usually record two different sound files - one for the caller and the other for the agent and will then mix them together at the end of the call. If this does not happen automatically, you might find two different sound files, named "-in" and "-out", each of which contains the voice of one of the parties. If your call is a multi-stint call, you may find a number of different sound files for it.
-
It is possible to use different PMs to handle different audio needs - see Listening to calls using Pluggable Modules (PM).
-
If generated by Asterisk, QueueMetrics can display a variety of other file type call attachments, ie. calls that are shown with a file extension that is not necessarily a sound file (image, video, audio, text or application files).
It is also possible to add markers in order to keep notes about "points of interest" for the call at hand, as shown in the example below:
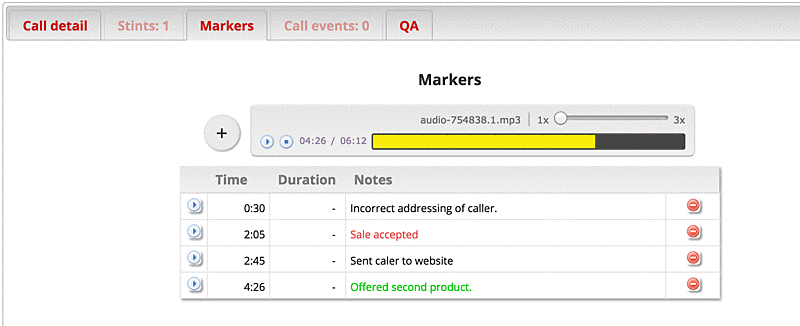
By clicking on the Play icon next to a marker, the correct audio recording is loaded in the embedded player and it is started at the point in time specified in the marker.
| Until release 14.10.4, QueueMetrics used the name "tags" instead of "markers". |
The HTML5 Audio Player and Markers
Since QueueMetrics 15.02, it is possible to play audio straight in the browser using an HTML5-enabled audio player.
This has many advantages:
-
You can play the audio straight in the browser, jumping back and forth as needed
-
You can speed-up the audio playing, in order to take less time to listen to calls
-
It integrates with the Markers editor, so you can add a comment at a specific point in time and see it later. When you click on a comment, the audio editor starts playing at that very point in time.
This is extermely powerful, and can be done either on the Call Details panel (under the Markers tab) or on the QA form.
In order for this to work, you need:
-
A modern browser supporting HTML5 audio playback
-
The system property ''audio.html5player'' must be set to true.
-
If audio files are hosted outside of QueueMetrics, your HTTP server must support Http-Range requests. QueueMetrics supports Http-Range file streaming natively.
-
Files must be stored in a format that is compatible with the browser. Presenty this means that your audio files should either be saved as WAV or MP3. GSM and WAV49 files will likely not work.
-
Streaming is not supported for encoded audio recordings.
Users having the capacity of adding and removing markers should hold the keys CALLMONITOR_ADDTAGS and CALLMONITOR_DELTAGS respectively.
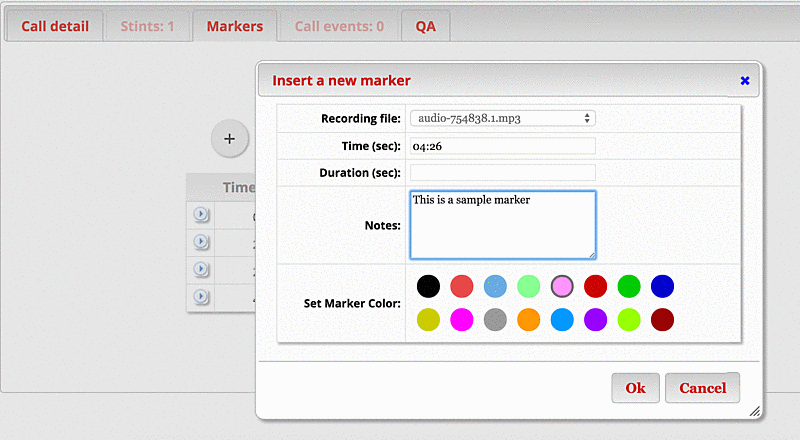
The following pieces of information are tracked through the Markers page:
-
System ID and Asterisk unique-id; marker author and time
-
Time offset and duration (in seconds). You can leave the duration field blank. Values can be input as an integer number of seconds or as MM:SS
-
A title (max 200 characters). Newline characters are allowed.
-
A color for display (this may be used to set, say, all sales in red, all issues in blue, etc).
Auditing access to recordings: the Media Proxy
QueueMetrics can be set up so that each time a user listens to a call, or visits an attached media file, this activity is logged. In order to do this, when the user wants to download a file, QueueMetrics stays "in the middle" - it acts as a proxy and downloads the file on your behalf, forwarding it to to you as it comes.
This way QueueMetrics can track (on the system’s Audit log):
-
Who listened to which media, when this happened, and how much of the media was downloaded.
-
Who tried listening to media, and was rejected for security reasons
-
Whether a file was not downloadable or the upstream service failed
Another important advantage, especially if you use a third-party recorder, is that the QM proxy will replace audio URLs with opaque links which IDs change every time a file is accessed. Therefore users have no visibility on what happens within the storage layer. Links remain valid only for a given period of time (usually 1000 seconds, but this can be changed) and will be rejected after this period.
One last advantage is that all accesses to your media storage layer will only come from your QueueMetrics system, and that can be further authenticated by adding a custom security HTTP header. So it is easy to allow storage access only from a small set of "good" IP addresses.
The main disadvantage, of course, is that using the proxy uses up bandwidth, threads and in general resources on your QM server.
In order to enable this feature, you have to set:
mediaproxy.enabled=true
mediaproxy.linkvalidity=1000
This replaces all links from all audio PMs with custom links that do trigger the proxy.
From the point of view of your users, nothing much will change; but access to media will appear on the Audit log.
Securing the media storage layer
It is possible to have QueueMetrics add some security headers to the HTTP requests that MediaProxy forwards. If you want to, you can have a custom header added that can in turn be checked by your media storage to identify the QM server used.
mediaproxy.header=X-Application/CustomToken
mediaproxy.token=VERYSECURE
In this case, the following headers will be sent along with the media requests:
X-Application/CustomToken: VERYSECURE
X-Application/QM-remoteIp: 1.2.3.4
X-Application/QM-remoteUser: joe_l
The remote IP of the client and the current user name are always forwarded automatically by the Media Proxy.
Some web servers will return error 400 if they receive unknown headers. In this case, you can
set mediaproxy.header=NONE to avoid adding any extra X-Application headers.
|
Detail of unanswered calls
The unanswered calls detail is quite similar to that of answered calls.
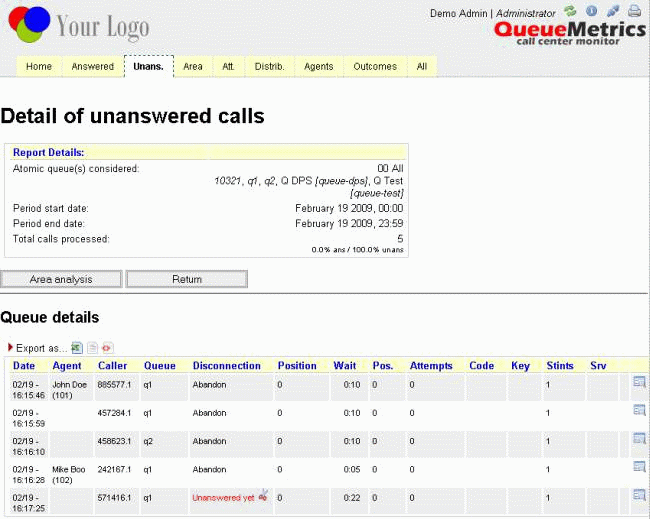
The following data are shown:
-
Date and time of the lost call;
-
The Agent that placed the call (if it’s outbound) or blank if inbound;
-
Caller-ID;
-
Queue that handled the call;
-
Disconnection cause;
-
Position at disconnection, if available;
-
Waiting time before disconnection, if available;
-
The initial position of the call when it joined the queue, if available;
-
The number of Agent attempts made before disconnection;
-
The call code, if entered (this might be added automatically, e.g. by outbound diallers marking unsuccessful attempts as "unanswered" versus "fax" or "voicemail")
-
The key pressed on disconnection (if any)
-
The number of stints this call has
-
The server that handled the call
Optionally other information could be shown:
-
The asterisk unique ID associated to each call
-
An icon that opens a new web page with an URL user customizable (useful for proprietary CRM integrations). To enable these two columns, the keys default.crmapp and default.showAstClid have to be correctly set. Please read Configuring system preferences and Appendix C: System preferences for further details.
Please note that on a queue timeout, Asterisk will not report the waiting time, as it is fixed and same as the queue timeout.
It is possible to sort the table for each column, in either descending and ascending order. To do this, click once on the desired title for descending sort, and twice for ascending sort. Once the table is sorted, an arrow symbol will appear close to the title, so you know on which column it was sorted last. As the sorting is done on the client machine, it may take a while with very large tables.
If the call is ongoing and you have the special grants to do so, a red scissor icon might appear next to the call status to allow for brute-force call closure. See the section Closing ongoing calls for further details.
Detail of IVR calls
IVR calls, that is calls that were handled without being queued, can be displayed through the pop-up linked to the OD04 - IVR details (paged) data block. The contents are very similar to the information displayed for taken or lost calls, though the only information currently tracked are call IVR events, DID and caller-id.