QueueMetrics 12.10
Release 12.10 sees the introduction of noticeable improvements and optimizations to QueueMetrics, offering broader usability and simplifying internal processes. Amongst the main features, the new release offers improved caching and memory efficiency, additional links to administrative tools from the QueueMetrics Home page, the introduction of the Agent Reports accessible directly from the agent web page and the possibility of defining different URLs for agent calls, according to the call path.
The implemented major changes are as follows:
-
Cache RAM monitor [#1636]
-
Memory efficiency [#1688]
-
System diagnostic tools [#1673]
-
Link to dbTest page [# 1692]
-
Agent page Reports [#1663]
-
URL Substitutions [# 1714]
Performance optimizations
We have been tracing and studying QueueMetrics' performance limitations in a number of production settings. The result of this study has led to a series of changes in QueueMetrics that will benefit everyone, but will of course mostly affect larger contact centers.
We worked on QueueMetrics' memory usage by limiting the total memory footprint, besides minimizing the creation of a large number of temporary objects. We also created a new string cache that outperforms the native Java implementation used in previous versions of QueueMetrics by two orders of magnitude on large settings. We also worked on database access caching - as of release 12.10, common items like the list of queues on the Home page are aggressively cached by QueueMetrics itself. You may notice this behavior if e.g. you create a new queue, go back to the Home page immediately and you do not see the queue for about 10 seconds. This has strongly reduced the number of queries sent to the database. Furthermore, we now have an even stronger caching system that keeps pre-processed objects in memory and avoids hitting the database for most real-time queries. This is an optional feature that only affects the Real-Time and the Agent’s Page when running with SQL or CLUSTER storage, and has to be turned on manually by setting:
realtime.useRowCache=true
The results obtained through this change have demonstrated a 10x - 20x performance improvement on page generation times.
We have also provided a new monitoring page, which is accessible from the DBTEST page, that allows to query the status of the new caches in real-time and reset them, as required.
The guide to fine-tuning QueueMetrics memory settings in order to get the best performance can be found in the QueueMetrics Advanced Configuration manual and it is a must-read for system administrators.
'See also:'
-
QueueMetrics User Manual: see chapter 20.17.4 - RAM Cache monitor
Administrative Tools access
Given the frequent need to access specific administrative tools, we have simplified how administrators can reach two main areas of QueueMetrics: the configuration.properties file and the database Test page.
As of QueueMetrics 12.10 it is possible to view the configuration.properties file directly from the Home page. This is achieved by adding the key EDIT_CFG to the admin user, which will enable a link on the Home page, within the 'Administrative Tools', that will allow access to the file.
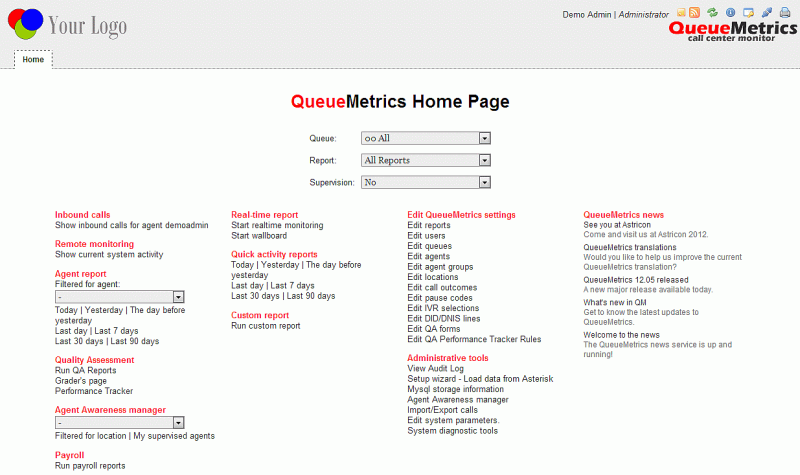
The database Test page is also accessible directly from the QueueMetrics Home page, under the heading 'System diagnostic tools', within the Administrative tools listing. It does not require a specific key to be enabled.
'See also:'
-
QueueMetrics User Manual: see chapter 3.0 - Logging on to QueueMetrics
Agent page reports
The new functionalities allow agents to run specific reports directly from the agent page. These new features are already enabled for the included sample agents. In order to configure other agents having the same functionalities available, the following steps need to be implemented:
-
Assign a queue (or a set of queues) to the agent
-
Assign a new report to the agent
-
Assign the SSAREPORT key to the agent
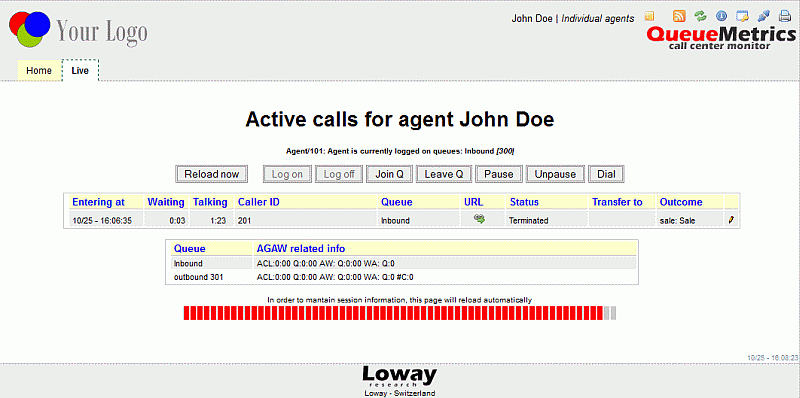
Furthermore, the Agent page now includes a new 'Home' button that allows an agent to get back to his/her main web page at any stage (no security key or property are required to enable this feature) and various reporting options are selectable by queue, report type and durations. This new block of reporting functions is made visible for agents by enabling the SSAREPORT key within the user configuration/administration page, which can be reached from the main QueueMetrics administrator Home page. An agent can run a report based only on the queues and reports assigned to him/her.
An administrator can also assign the maximum amount of time that an agent can have available, when viewing historical reports from the agent web page. When an agent runs a report, the agent does not have a 'Search' button enabled, so s/he is not able to access any kind of Custom Reports.
'See also:'
-
QueueMetrics User Manual: see chapter 8.2 - Self-service agent reporting
URL Substitutions
The new release includes a new agent page URL feature. Each time the call history changes, and if there is a URL associated to the call shown on top of the list, a new window will automatically be opened pointing to the specific URL. This feature could be disabled modifying the value associated to the configuration key realtime.agent_autoopenurl.
URLs are passed to the Queue() command in Asterisk or, if missing, they can defined in the QueueMetrics queue configuration as a default. They can include a set of placeholders that are expanded with the details of the call being handled, as in the following table. The available placeholders are:
-
A agent’s numeric code
-
U call’s Asterisk uniqueID
-
S server ID (cluster mode)
-
Q queue name
-
T call timestamp
-
C caller ID
-
D DNIS
-
I IVR path
-
O outcome code
-
P position in queue
-
M call attempts
'See also:'
-
QueueMetrics User Manual: see chapter 8.0 - The real-time agent page