Your first run
The first time you log-in, you should have the system run automatic configuration. Most of the things that are currertly active come from the green box named "Reports". There you can find some pre-configured reports, namely:
-
Direct calls: calls that went to a Teams user, without going through a queue
-
Outbound: Outbound calls made by Teams users
-
Conferences: group calls for last week, including outbound PSTN calls by invitees to group calls.
-
Voicemails left
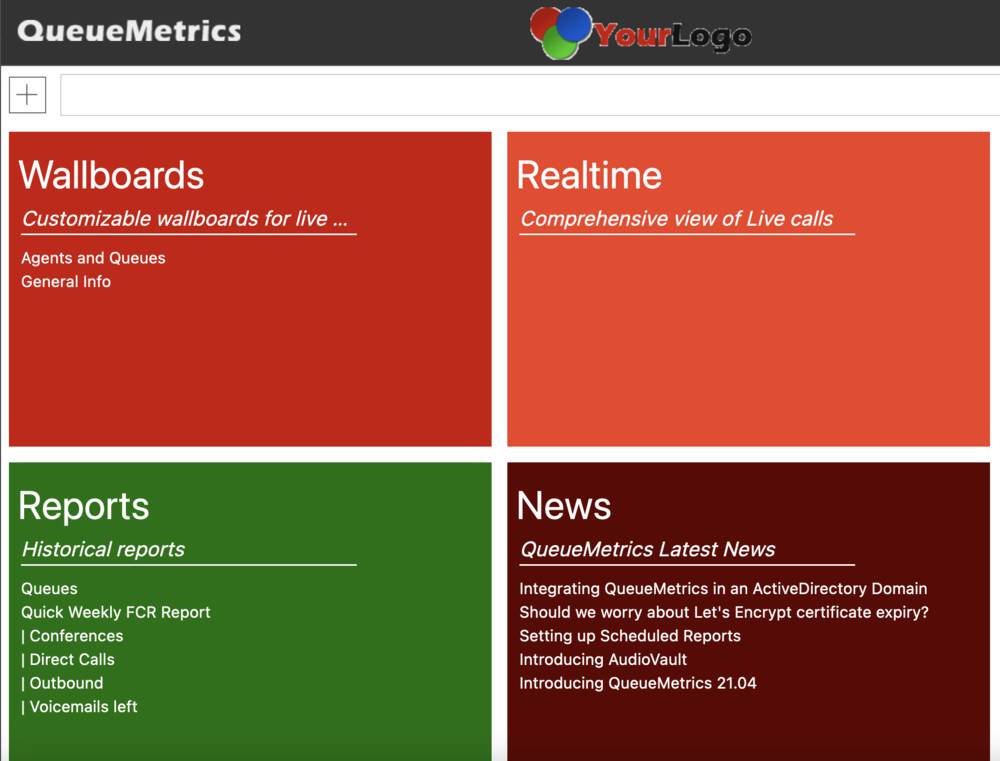
There are also a couple of examples for queues, one that contains most relevant data blocks and called Queues and a shorter one meant to show a streamlined view, but in order to make them work you have to configure queues first.
Configuring queues
The basic unit of reporting in QueueMetrics is the queue. For security reasons, we ask that a queue be explicitly configured before someone can run a report on it. This can be done automatically, and can be repeated when you create a new queue, as soon as data from that queue is loaded.
So, click on the "Cog" to the right; the configuration menu appears.
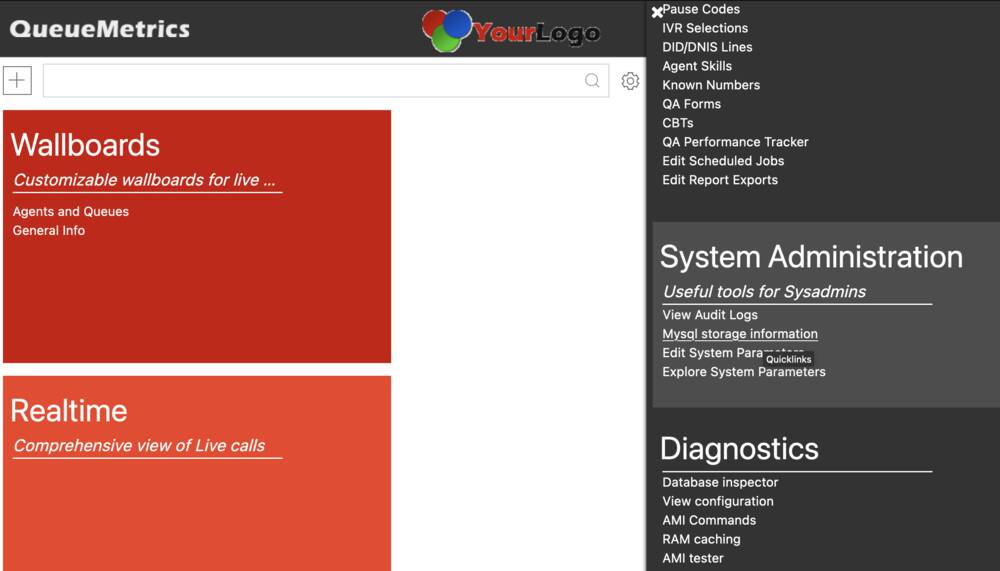
Under System Administration, select "Mysql storage information". This will show you the data set that is currently loaded in your QM Live instance.
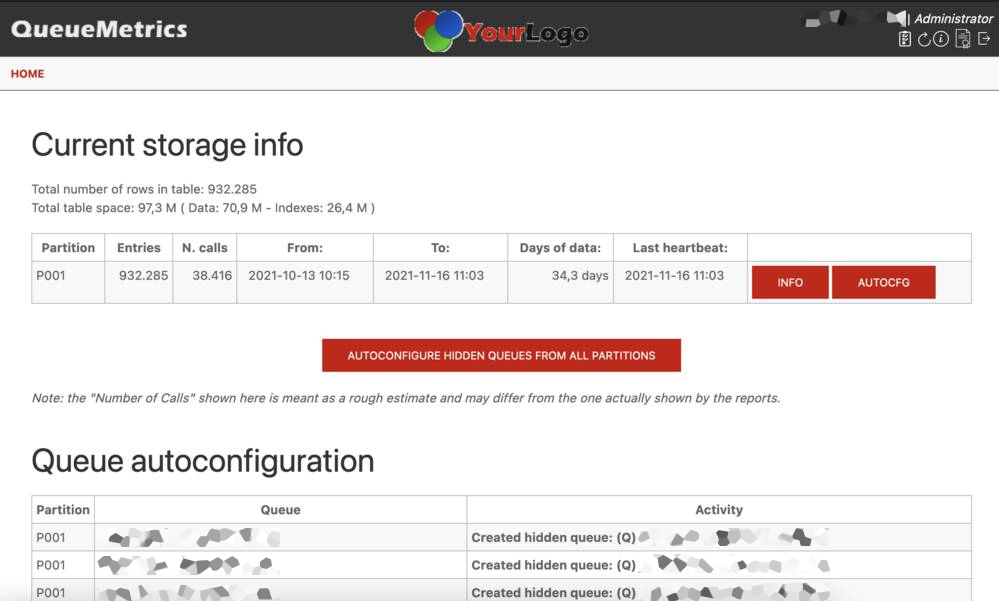
Now click on "Autocfg" and all the queues that are not configured will be created. They are created as "hidden" queues, so they can be seen and reported upon but you cannot select them from a drop-down menu. Maybe you don’t want to have all queues searchable, but you can "turn on" the ones you want by going back to the "Cog" and clicking on "Queues" under "Edit QueueMetrics configuration".
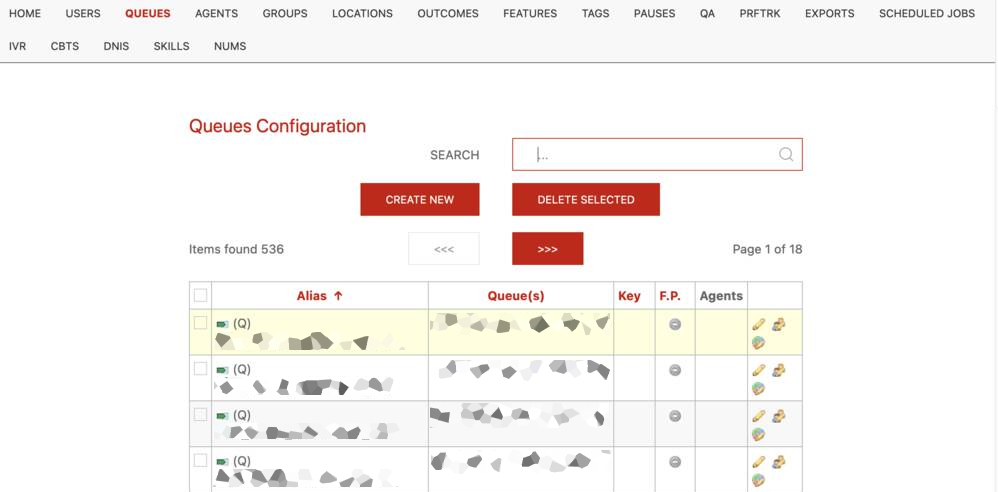
You will see that any queues that were created appear with a gray dot under "F.P.", that stands for Front Page. If you click on the pencil icon, you can set "Shown on front page" to Yes. While you are at it, you can change the Alias to something that is easier for you to remember.
Some queues in QueueMetrics directly map one Teams entity, but you can create what we call "Aggregate queues", that is a queue that is actually a set of other queues. This is very handy for reporting, for example to see all the queues that a teams cares about, or just all the queues in the system - in fact this is so common that there is alredy an aggregate queue called 00 All that expands to all the queues in your system.
To create an aggregate queue, you can enter a number of queue identifiers separated by the pipe symbol, and/or you can use wildcards to match multiple queues.
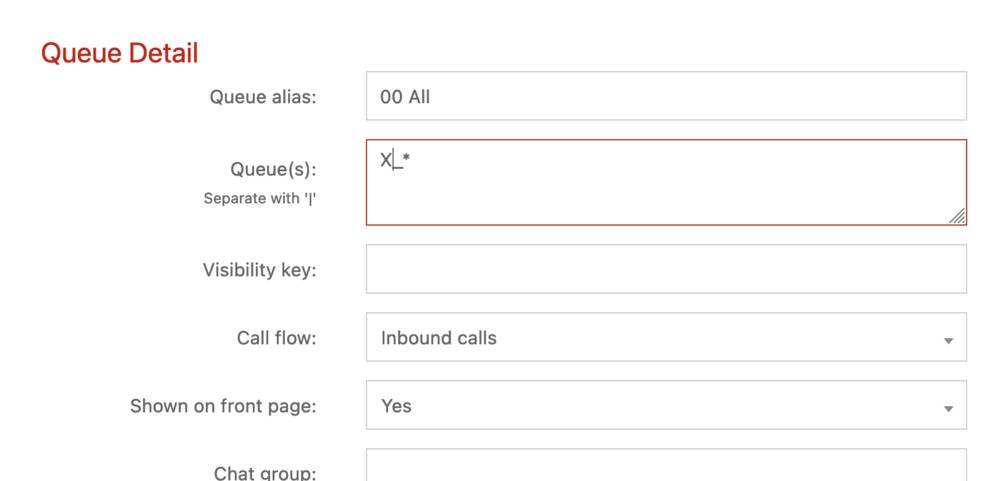
For example, in the picture above all queues starting with X_ will be matched.
Running reports
The pre-defined reports all run on data for the last week. In order to access them, you just click on one of the links from the "Reports" block. If you click on the title, the system will start with an empty report, but it’s generally easier to get started with an existing report and change it as needed.
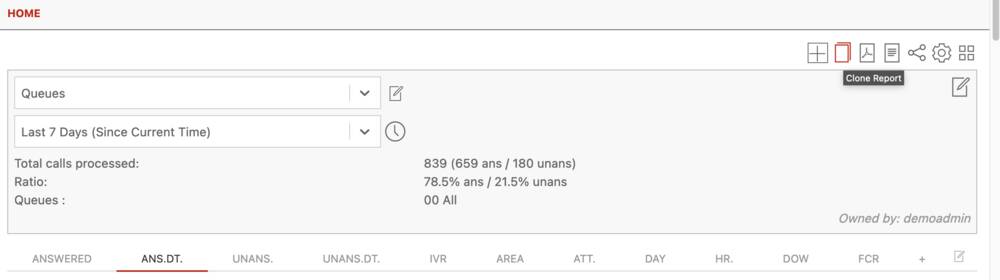
The easiest thing, at least for me, is to open the default report, click on the Clone icon and create a new one. You can have as may reports as you want. Then you can change the reporting period, the queues, and add filters as you need them. New data blocks are available from the last icon on the right, and are shown as a preview with actual live data.
The default reports "Queues" contains a number of statistics divided into 11 pages:
-
Answered: statistics on answered calls -
Ans.Dt.: quick access to the list of answered calls -
Unanswered: details of lost calls -
Unans.Dt.: quick acces to the list of all lost calls -
IVR: IVR traversal (not always present, depends on Teams) -
Area: area code analysis - where are people calling from -
Att.: Attempts, that is, a queue trying to reach an agent. At the moment data is not yet fully loaded from Teams. -
Day,Hr, andDOW: usage details by day, hour and day of the week. The "hour" can be easily customized to your unit of tracking, e.g. by default it is 15 minutes but you can change it by clicking on the "cog" icon in the report and looking for the Hourly slot parameter. -
FCR: tracks First Call resolutions, so people who called multiple times
Everything is very well documented in the QueueMetrics user manual - https://www.queuemetrics.com/manual_list.jsp - but this should be enough to get started.
| At the moment, we do not have agent presence information, so reports that appear in the manual that require agent presence - e.g. how long an agent was logged in, or the pauses they took - will appear empty. |
Taken and Lost queues
For calls that do not really go through a queue (e.g. conferences and direct calls), we assign them to a separate "lost" queue when they fail without connecting. This way you can still see who the caller and destination were.
The pre-set reports for Direct Calls and Conferences already include all the separate queues for both successful and unsuccessful calls - this means that even calls that were not connected, will appear as if they were connected but on a virtual queue named e.g. "Direct Lost" for "Direct" calls.