Enabling MySQL storage
In order to enable MySQL storage, you have to:
-
Install Qloaderd on your Asterisk server and point it to the main QueueMetrics database
-
Tell QueueMetrics to run reports from the database
Understanding MySQL storage
In order to set up the system, we first have to understand the concepts involved.
-
The QueueMetrics database is a MySQL database loaded with the QueueMetrics default database structure. This is usually installed with QueueMetrics (as it is needed to make it work) and can be on any machine, as QueueMetrics will connect to it via a TCP/IP socket. When we refer to the database in the context of MySQL storage, we are usually thinking about a table called queue_log; that’s where Asterisk log information is uploaded to.
-
The database is logically divided into one or more partitions; these are virtual tables that reside within one single physical table. Partitions are useful as they let you have more than one Asterisk queue data set within the same database. This is useful e.g. for testing, or for sending multiple queue_log data sets to the same physical database for clusters. You can call a partition any name you like, as long as it does not exceed 5 characters.
-
Qloaderd is a small Perl script that will upload the data Asterisk produces to one chosen partition. It is built to be lightweight and pretty smart; in case it is restarted, it will automatically detect which data is already present in the database and upload only missing data. It runs on the Asterisk server and points to the MySQL server that QueueMetrics uses; in order to run it, you must decide a partition for it to upload data to. If multiple copies of Qloaderd are run at once, each copy must point to its own partition, or data corruption will surely happen.
-
QueueMetrics will access MySQL data by using a special file name, that is usually "sql:partition". In order to see what is going on with your database, QueueMetrics offers a special MySQL storage inspection mode to see which partitions are available, which are active and how much data is in them.
Installing Qloaderd
First you have to install Qloaderd and then you’ll have to configure it to suit your needs.
Installing on TrixBox or other CentOS based Linux distros
If you run TrixBox or any other CentOS/RHEL base Linux distro, you can install Qloaderd very easily using the provided yum package manager:
wget https://yum.loway.ch/loway.repo -O /etc/yum.repos.d/loway.repo
yum install qloaderd
If in the future you would like to upgrade it, you will do so by running:
yum update qloaderd
The installation process installs all necessary components and dependencies, Qloaderd itself and starts it immediately. Qloaderd is installed in /usr/local/qloader and its startup script is installed as /etc/init.d/qloaderd. If you just installed Qloaderd using yum, skip to the section called Customizing Qloaderd
Manual Qloaderd installation
In order to download the Qloaderd package, go to the Downloads page on QueueMetrics' website.
Make sure you have the following packages available on your system, as Qloaderd will use Perl’s DBI to connect to MySQL:
libdbi
libdbi-dbd-mysql
libdbi-drivers
Unpack the Qloaderd tar-ball and copy the file qloader.pl to a location of your choice (we suggest /usr/local/qloader). Run the following commands to make sure the file is executable:
cd /usr/local/qloader
dos2unix qloader.pl
chmod a+x qloader.pl
We also provide a "plain-vanilla" startup script that can be installed in your local startup directory in order to start Qloader automatically. It may require a bit of tweaking, but it will run on all Linux distributions. You should very likely copy it from Other-initscript to /etc/init.d on your system.
Run the following commands to make sure the file is executable:
dos2unix /etc/init.d/qloaderd
chmod +x /etc/init.d/qloaderd
In order to have the service started on boot, use the command:
chkconfig --add qloaderd
(or the equivalent for your distribution).
Customizing Qloaderd
Before using Qloaderd, you must define:
-
The name and address of the MySQL database server
-
On which partition is it supposed to upload data to
-
The Asterisk log file it must upload
-
Its own error log file
To set the name and address of the MySQL server, edit the file /usr/local/qloader/qloader.pl and change the following lines as needed:
my $mysql_host = "10.10.3.5";
my $mysql_db   = "queuemetrics";
my $mysql_user = "queuemetrics";
my $mysql_pass = "javadude";
Please make sure that the MySQL server will allow connecting from the Asterisk server - this can usually be obtained by running a SQL statement on the database server, such as:
grant all privileges on queuemetrics.* to 'queuemetrics'@'10.10.3.100'
           identified by 'javadude';
where the string "10.10.3.100" in the example is the internal IP address of the Asterisk box we’re installing Qloaderd on.
To set the other parameters, edit the file /etc/sysconfig/qloaderd and change the following parameters:
PARTITION=P001
QUEUELOG=/var/log/asterisk/queue_log
LOGFILE=/var/log/asterisk/qloader.log
If you are unsure what to set the partition to, just leave it to P001 for the moment. The queuelog parameter is the name of the file Asterisk produces and it is to be uploaded. The logfile parameter is a log file where Qloaderd will write its activity to and that you can look up to debug problems.
Starting and stopping Qloaderd
To test if everything is in order, you can now start Qloaderd by running:
/etc/init.d/qloaderd start
It should start up and start writing to its own log file. To see if everything is okay, you just run:
tail -f /var/log/asterisk/qloader.log
And it should output something like:
 |Fri Sep 14 09:33:24 2007|QueueMetrics MySQL loader - $Revision: 1.3 $
 |Fri Sep 14 09:33:24 2007|Partition P001 - PID 2827 - TZ offset: 0 s.
        - Heartbeat after 900 s.
 |Fri Sep 14 09:33:24 2007|Now connecting to DB qm14 on 10.10.3.5 as
        user queuemetrics with password queuemetrics
 |Fri Sep 14 09:33:24 2007|Ignoring all timestamps below 0
As you can see, it states what it is trying to do and will start uploading data. Every 100 lines of uploaded data or 900 seconds of Asterisk ACD inactivity, it will output a reference line that tells how much data it has uploaded in the current usage session.
If you see something like:
 |Fri Sep 14 09:25:49 2007|QueueMetrics MySQL loader - $Revision: 1.3 $
 |Fri Sep 14 09:25:49 2007|Partition P001 - PID 2749 - TZ offset: 0 s.
        - Heartbeat after 900 s.
 |Fri Sep 14 09:25:49 2007|Now connecting to DB log_code on 10.10.3.5 as
        user ldap with password ldappo
E|Fri Sep 14 09:25:49 2007|---ERROR FOUND--
E|Fri Sep 14 09:25:49 2007|Error type: dr
E|Fri Sep 14 09:25:49 2007| Statement:
E|Fri Sep 14 09:25:49 2007|     Error: Unknown database 'log_code'
E|Fri Sep 14 09:25:49 2007|Waiting 15s before reattempting to connect
This means that it was not possible to connect to the database - very likely your server, database, user, password or access grants are wrong. Please note that in case of an error, it will simply try again - this way, no matter what happens to your database, Qloaderd will try again and again until it can establish a working connection and will then upload data.
You can stop or restart Qloaderd using the following commands:
/etc/init.d/qloaderd stop

/etc/init.d/qloaderd restart
Testing if data is actually being uploaded
To make sure that data is being uploaded correctly, you should log on to the database server, open the MySQL shell and issue a command like:
select partition, queue, count(*) as n_records
from queue_log
group by partition, queue
order by partition, queue
The result should look something like this:
 +-----------+------------------+-----------+
 | partition | queue            | n_records |
 +-----------+------------------+-----------+
 | P003      | myqueue          |         9 |
 | P003      | NONE             |       121 |
 | P003      | queue-abc        |      2096 |
 | P003      | queue-test       |      1341 |
 | P003      | UNK              |        17 |
 | P01       | qq-group         |     33000 |
 | P01       | cust-rajax       |       204 |
 | P01       | NONE             |      8139 |
 | RT        | NONE             |      8064 |
 | RT        | q1               |      9216 |
 | RT        | q2               |      9216 |
 +-----------+------------------+-----------+
 11 rows in set (0.16 sec)
This report shows:
-
That we are using three distinct partitions: P003, P01 and RT. (Af first you will only find one).
-
For each partition, we see the Asterisk queue names involved plus the special keyword NONE
-
For each queue, we get an idea of how many records it generated, i.e. how big it was. As a rough estimate, consider that each call generates an average of around three or four records (but this is dependent on how your call center is set up).
As your Asterisk system runs and data is uploaded into the database, you should see the figures for the number of records rise between repetitions of the same query. If the figures don’t change, or you do not see you partition at all, this means that Qloaderd is not uploading data.
Setting up QueueMetrics
Setting up QueueMetrics is very straightforward: if you click on "Run custom reports" and enter "sql:P001" as the filename, you can check if your partition P001 contains data for the queue you just selected.
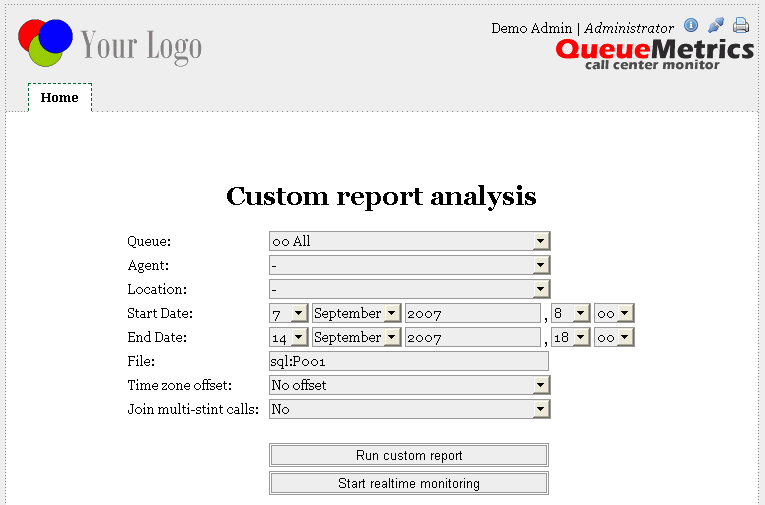
Just remember to configure the queues you want to report on, before running this test.
Changing the defaults
Of course, you’ll want QueueMetrics to automatically use the partition you choose as its default data source - you can easily do this by editing the file configuration.properties and setting:
# This is the default queue log file.
default.queue_log_file=sql:P001
After restarting QueueMetrics, the MySQL storage source will be used as a default.
Using the QueueMetrics database inspector
As it is not always easy to understand how much data is in the database, QueueMetrics offers a database inspection tool to easily see which data is available.
You can enter it by clicking on the "Mysql storage information" link from the "Edit QueueMetrics settings" section (if you do not find that link, make sure your admin user holds the key USR_MYSQL).
If it takes a while to enter the page, this is perfectly normal; in order to produce the data seen through the inspector, it performs a series of table scans. As adding the correct indexes for faster analysis would use a lot of disk space and slow down the database system considerably versus an occasional use of the inspector, they were not included with QueueMetrics.
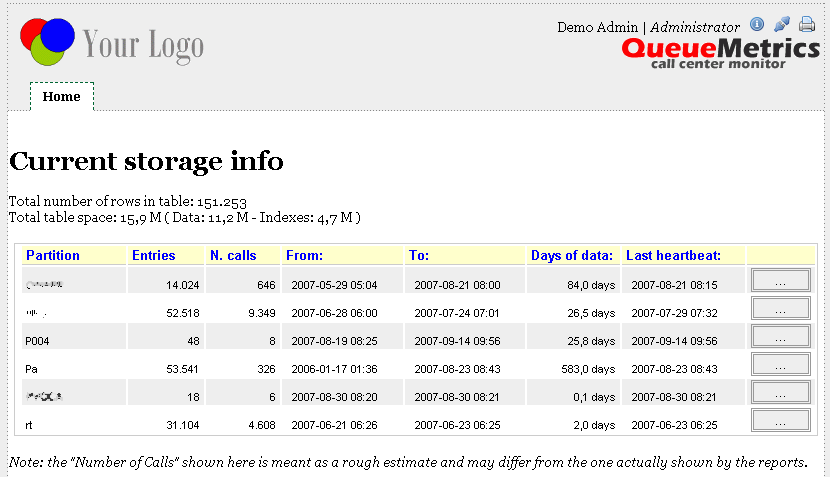
From this page we see which partitions are available for analysis. For each partition we can see:
-
The total number of entries available
-
An estimated number of calls
-
The date of the oldest and most recent call entry
-
How many days does the data span over
-
The last heartbeat: if there is no data to upload (e.g. at night), the Qloaderd will in any case upload a Heartbeat record every 15 minutes. This makes it clear that, even if there is no recent data in it, a working Qloaderd is currently uploading data on that partition. If there is no new data and the last heartbeat is over 20 minutes old, this probably means that the Qloaderd process is not running.
If we click on the details of a partition, we see a screen like the following one:
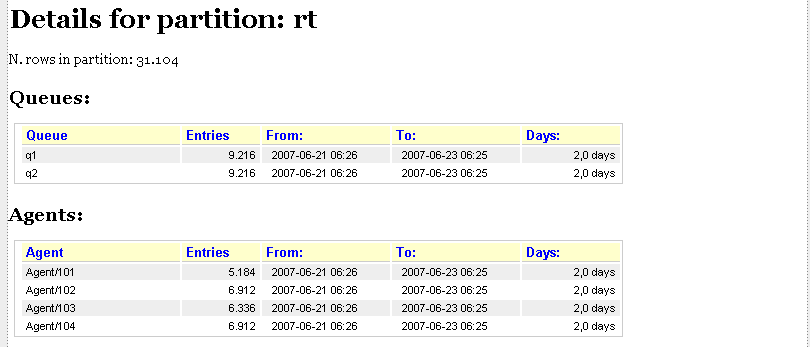
This shows which queues and agents are available on the partition, and also shows the oldest and most recent records regarding each queue or each agent.