Advanced QueueMetrics monitoring
The Java VM offers very powerful APIs to monitor and diagnose live systems while they are running; they are meant to be run in production with negligible performance impact.
This can be useful to diagnose specific problems, e.g. Java heap exhaustion issues, or to monitor the activity of your QM servers.
Prerequisites
-
A QueueMetrics instance runnining under JDK 6 or newer. The specific version of Java that is being run can easily be seen under the License page of QueueMetrics.
Recent versions of QueueMetrics installed using 'yum' should already be running under JDK 8 or 11. If this is not your case, you should upgrade the 'queuemetrics-java' package.
Assessing memory problems
If you feel you are experiencing memory issues, you should take multiple memory and thread dumps spaced a couple of hours in between and send them to Loway for inspection.
We will usually need:
-
The current memory settings
-
A memory dump
-
A thread dump
They should be obtained as described below.
Finding the current QueueMetrics PID
In order to perform the procedures described below, you must know the PID of your currently running QueueMetrics instance. It can usually be found out by running:
[root@qm ~]# ps fax | grep catalina
32313 pts/0    S+     0:00          \_ grep catalina
12345 ?        Sl     0:14 /usr/java/jdk1.6.0_17/bin/java -Xms128M .....
Here in the example QM is running with a PID of 12345.
The PID is used to attach to the current JVM and query it. It is also possible to start the JVM so that it allows administrative access over a network; therefore all the procedures described below can be run on a remote JVM as well.
Taking a memory dump
A memory dump presents a (long) list of all the loaded Java classes, and how many instances of each are present in memory.
[root@qm ~]# /usr/java/jdk1.6.0_17/bin/jmap -histo:live 12345
You should also collect general memory area usage statistics by running:
[root@qm ~]# /usr/java/jdk1.6.0_17/bin/jmap 12345
Taking a thread dump
A thread dump prints out - thread by thread - what each one is doing at a given moment. This is useful to diagnose load-based issues where too many requests and open sessions "flood" the QM server.
[root@qm ~]# /usr/java/jdk1.6.0_17/bin/jstack -l 12345
This lets you know what a "frozen" server with high CPU usage is actually doing.
Remote monitoring with VisualVM
'VisualVM' is a graphical tool that comes with the Java SDK that lets you monitor a remote QueueMetrics instance while it’s running (it can actually be used with any Java-based process).
It allows monitoring over a network, so it is common to run it on a workstation to monitor one or more remote servers.
You can find it at: https://visualvm.github.io/ and it is already included in all modern Java downloads (so it is likely you already have it on your PC) - if not, it can be easily downloaded.
Remote monitoring over SSH with RPM
To make your life easier, we made it possible to set up a fully working JMX connection just by uncommenting a single line, and creating an SSH tunnel that will let us access the data in a secure way. You will need a recent Tomcat RPM (8.5.64 or newer).
So, once it is installed, you edit /etc/sysconfig/qm-tomcat6, and where it says:
# Remove the comments below to activate JMX monitoring
# JAVA_RMI_ADDRESS=localhost
JAVA_JMX_PORT="30000"
You uncomment the line with JAVA_RMI_ADDRESS; save the file and restart. You just need to do this once, and this can be done safely even on production systems. You can change the JMX port if you need to - does not matter which port you choose, as long as it is the same on your PC and on the server.
Now, you go to your workstation and start a new SSH session with the following incantation, to create a local tunnel for port 30000 and the following one too:
ssh root@my.queuemetrics.server \
    -L 30000:localhost:30000 \
    -L 30001:localhost:30001
You can now run VisualVM on your workstation - most likely it will already be installed if you have a Java SDK; if not, you can download it from: https://visualvm.github.io
Note that while the example above logs in over SSH as 'root', any user will do.
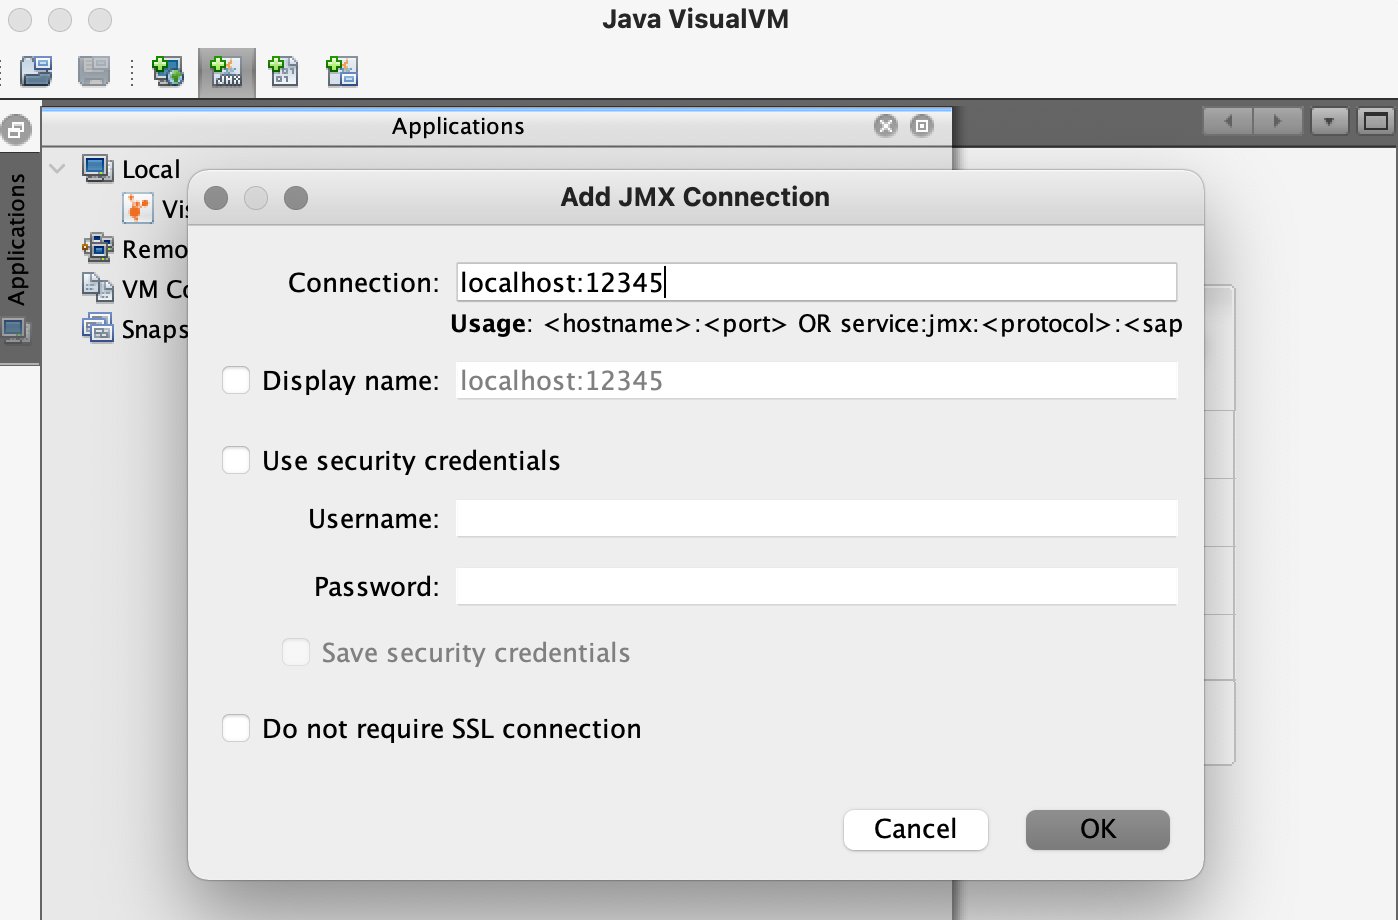
When you launch VisualVM, you should now click on the button 'Add JMX connection', and create a new connection to 'localhost:30000', with no password and no encryption (as we use SSH for security and encryption).
Remote monitoring over SSH
If you cannot use the simplified method above, as getting the configuration right for remote access can be tricky (see below for an example), it is usually better to use a SSH tunnel to connect to a running JVM instance.
The Java RMI protocol requires forwarding of two ports, and those ports must be the same on your box as they are on the remote server. As you can assign such ports freely, if you need to monitor multiple servers at once, make sure that the ports used are unique.
In order to allow it, you should add the following line to '/etc/init.d/qm-tomcat6':
export JAVA_OPTS="-Dcom.sun.management.jmxremote \
      -Dcom.sun.management.jmxremote.port=12345 \
      -Dcom.sun.management.jmxremote.rmi.port=12346 \
      -Dcom.sun.management.jmxremote.authenticate=false \
      -Dcom.sun.management.jmxremote.ssl=false \
      -Dcom.sun.management.jmxremote.local.only=false \
      -Djava.rmi.server.hostname=localhost \
      $JAVA_OPTS"
Restart the JVM after adding it. At this point the JVM allows connections, but only locally, on ports 12345 and 12346.
Now set up an encrypted tunnel to forward both ports to the same ports on your workstation:
ssh root@my.queuemetrics.server \
    -L 12345:localhost:12345 \
    -L 12346:localhost:12346
Note that while the example above logs in as 'root', any user will do.
When you launch VisualVM, you should now click on the button 'Add JMX connection', and create a new connection to 'localhost:12345', with no password and no encryption (as we use SSH for security and encryption).
When done, click on the newly created connection to start monitoring.
Allowing remote access
The standard JVM settings for QM 'do not' allow remote access over a network, for obvious security reasons. In order to allow it, you should add the following line to '/etc/init.d/qm-tomcat6':
export JAVA_OPTS="-Dcom.sun.management.jmxremote \
      -Dcom.sun.management.jmxremote.port=12345 \
      -Dcom.sun.management.jmxremote.authenticate=false \
      -Dcom.sun.management.jmxremote.ssl=false \
      -Djava.rmi.server.hostname=10.10.5.106 \
      $JAVA_OPTS"
Restart the JVM after adding it. You can change the port (in this case we set it to 12345) for security purposes. Please note you must also set an host name or IP address for the machine - failure to do so will prevent all remote monitoring.
If you run this on a publicly-available server and/or you have a firewall, you should set up an encrypted connection and use SSL and password authentication - see http://docs.oracle.com/javase/1.5.0/docs/guide/management/agent.html
To make sure that the system restared correctly and the JMX connection is actually used, you can run the following command:
[root@localhost ~]# lsof -i -P | grep 12345
java      14513     root   15u  IPv6 1133153       TCP *:12345 (LISTEN)
As you can see, Java process 14513 is listening on port 12345.
Starting VisualVM
To start VisualVM, you run 'bin/visualvm.exe' in Windows, or just 'jvisualvm' in Unix/Mac.
When started, click on "Remote" and enter the IP address of your QM server. Click on "Advanced settings" and set the port to the one you specified in the QM configuration (12345 in this example).
After that, you select your server and select "Add JMX connection" from the right-button menu. You enter the JMX connection as "IP:12345".
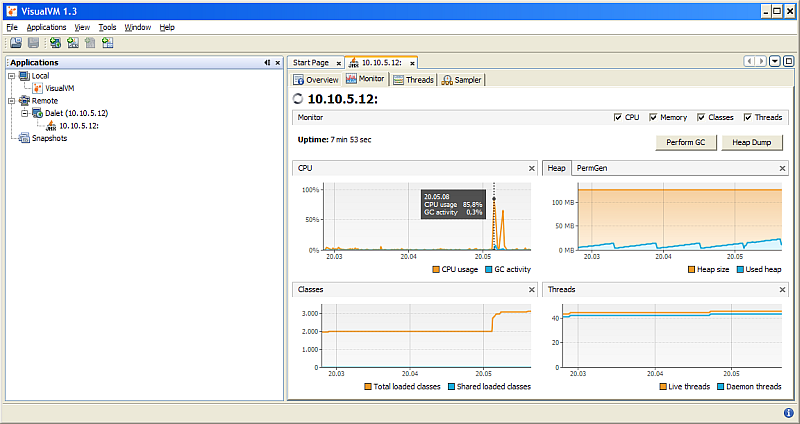
By clicking on it, you get a working connection, like in the picture below:
Things you can do in VisualVM
A number of interesting things can be done with VisualVM:
-
'Know your JVM': you can see the JVM settings from 'Overview' / 'JVM arguments'.
-
'Memory monitoring': you can see the current CPU, memory and thread usage from the 'Monitor' page. Note that with most settings, it is normal that all memory be used up before a garbage collection is performed; so you would expect to see spikes and falls in the graph. You can also force a garbage collection if you want to see the "true" memory usage, but this may be unwise on heavily loaded production servers.
-
'Thread monitoring': you can get a textual thread dump like the one discussed above by selecting 'Threads' / 'Thread dump'
-
You can use the 'Sampler' to acquire a breakdown of memory and CPU usage per class (you first need to install the plugin 'VisualVM-Sampler' from the Plugins menu)
-
You can keep a server open with multiple instances of VisualVM in order to monitor multiple QM servers
Tracing CPU hot-spots
In order to trace CPU hot-spots, getting to the right point requires a bit of black magic:
-
attach to process via VisualVM
-
go to "Sampler"
-
click on "Sample: CPU"
-
Wait a few minutes
-
click on "Sample: Stop"
-
Under "CPU Samples", click on "Collected data: Snapshot"
-
Then in the section "View", click "Hot spots"
-
At this point, click on the diskette and choose "Export hot spots"
You can also click on "Export profile", save an NPS file, and send it over. If you do, please send both files (NPS and Export Hot Spots), as sometimes NPS files are not readable with different version of Java.
The profile can then be loaded by opening VisualVM, choose "load" and select the NPS file.